Particle-covered droplet and a particle shell under compressive electric stress
←
→
Page content transcription
If your browser does not render page correctly, please read the page content below
PHYSICAL REVIEW E 103, 062605 (2021)

                 Particle-covered droplet and a particle shell under compressive electric stress

                               Khobaib Khobaib ,1 Tomasz Hornowski ,1 and Zbigniew Rozynek                         1,2,*
                   1
                     Faculty of Physics, Adam Mickiewicz University, Uniwersytetu Poznańskiego 2, 61-614 Poznań, Poland
                   2
                     PoreLab, The Njord Centre, Department of Physics, University of Oslo, Blindern, N-0316 Oslo, Norway

                        (Received 15 October 2020; revised 19 March 2021; accepted 20 May 2021; published 8 June 2021)

                   Understanding of the behavior of an individual droplet suspended in a liquid and subjected to a stress
                is important for studying and designing more complex systems, such as emulsions. Here, we present an
                experimental study of the behavior of a particle-covered droplet and its particle shell under compressive stress.
                The stress was induced by an application of a DC electric field. We studied how the particle coverage (ϕ), particle
                size (d), and the strength of an electric field (E) influence the magnitude of the droplet deformation (D). The
                experimental results indicate that adding electrically insulating particles to a droplet interface drastically changes
                the droplet deformation by increasing its magnitude. We also found that the magnitude of the deformation is not
                retraceable during the electric field sweeping, i.e., the strain-stress curves form a hysteresis loop due to the energy
                dissipation. The field-induced droplet deformation was accompanied by structural and morphological changes
                in the particle shell. We found that shells made of smaller particles were more prone to jamming and formation
                of arrested shells after removal of an electric stress.

                DOI: 10.1103/PhysRevE.103.062605

                        I. INTRODUCTION                                       tal methodologies involved in research on particle-covered
                                                                              droplets include compressive strain [25,30], atomic force mi-
    Droplets covered by granular or colloidal particles have
                                                                              croscopy [31], as well as ultrasonic and magnetic methods
recently been actively studied from the perspective of both the
                                                                              [32,33]. Another approach for studying the properties of
fundamental and the applied sciences. They are considered as
                                                                              particle-laden droplets is the application of an electric field
suitable materials to be used in the food technology [1], drug
                                                                              (E field).
delivery [2], cosmetics [3], biomedical applications [4], and
                                                                                  E fields have demonstrated to be an adaptable method
oil industry [5]. Particle-covered droplets have characteristics
                                                                              for studying particle-droplet stability [20], electrorotation
that make them useful also for fabricating adaptive structures
                                                                              [16,22], as well as steady-state [34,35] and transient defor-
[6,7], porous materials [8], colloidal photonic crystals [9],
                                                                              mations [36–38]. In this paper, we use an E field to study
and responsive microcapsules with homogenous [10,11] or
                                                                              the behavior of a particle-covered oil droplet and its particle
heterogeneous particle shells [12,13]. Moreover, the particle-
                                                                              shell under induced electric stress. In the oil-oil systems, an
covered droplets can be used as experimental model systems
                                                                              E field can be used to generate the electric stresses that either
for studying different phenomena taking place on curved
                                                                              compress or stretch a particle-covered droplet depending on
liquid-liquid interfaces, for example, particle assembly [14],
                                                                              physical parameters of the fluids and particles (e.g., electrical
ordering [15], mixing [16], as well as particle-layer buckling
                                                                              conductivity and dielectric properties), and the parameters
[17].
                                                                              of an applied E field (frequency and strength). For exam-
    In many research areas, knowledge of the stability and me-
                                                                              ple, a particle-covered droplet subjected to a DC E field can
chanics of an individual particle-covered droplet is essential,
                                                                              compressively deform, whereas an application of an AC E
e.g., for the efficient fabrication of Pickering emulsions [18],
                                                                              field to the same droplet may stretch it [6]. Here, we wished
for designing emulsions with controlled stability [19,20], and,
                                                                              to investigate a particle-covered droplet under compressive
in general, for the further development of the above men-
                                                                              stress. Therefore, we chose to use a uniform DC E field and
tioned research fields. In this context, several research groups
                                                                              work with a three-phase system comprising an electrically
have studied theoretically and experimentally the deformation
                                                                              weakly conductive silicone oil droplet covered by electrically
[21–24], relaxation [25,26], dynamics [27], and mechanical
                                                                              insulating microparticles and suspended in slightly more elec-
properties of particle-laden droplets [28,29]. Experimen-
                                                                              trically conductive castor oil. In such a system, the E field
                                                                              causes free ions with opposite charges (impurities in the oils)
                                                                              to accumulate at the two hemispheres of the particle-covered
 *
     Corresponding author: zbiroz@amu.edu.pl                                  droplet. Electric stress is induced at the hemispheres when the
                                                                              E field acts on these charges, and it compresses the droplet
Published by the American Physical Society under the terms of the             that eventually acquires an oblate geometry, i.e., the longest
Creative Commons Attribution 4.0 International license. Further               droplet axis is perpendicular to the E field.
distribution of this work must maintain attribution to the author(s)              Many experimental and theoretical studies have been con-
and the published article’s title, journal citation, and DOI.                 ducted on this type of deformation. Initially, the majority

2470-0045/2021/103(6)/062605(12)                                  062605-1                             Published by the American Physical Society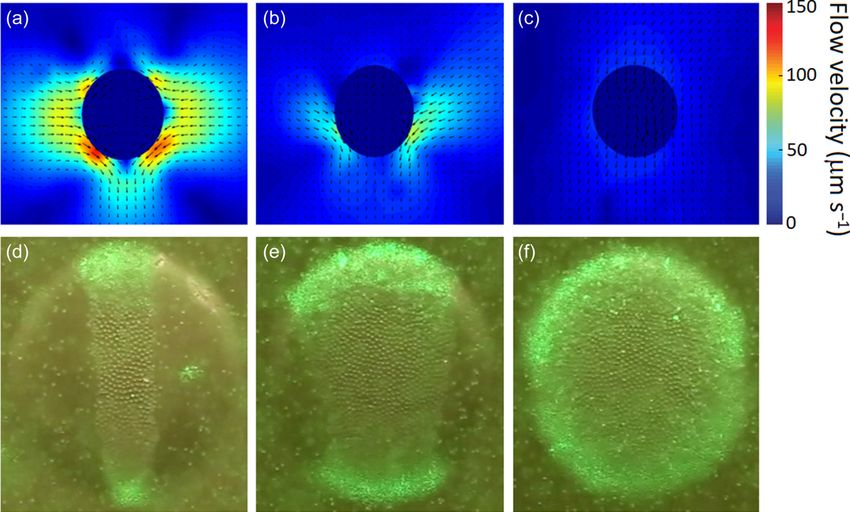
KHOBAIB, HORNOWSKI, AND ROZYNEK                                                          PHYSICAL REVIEW E 103, 062605 (2021)

of the studies concerned particle-free droplets. The theory            Thus, in this paper, our objectives are to show: (i) how
on the droplet deformation and relaxation (after reducing          the particle coverage, particle size, and the strength of the E
E-field strength) was established a long time ago [39] and         field influence the magnitude of steady-state deformation of a
has since been further developed [37,40–43]. Thus, the in-         droplet with a particle shell; and (ii) how the particle size and
fluence of liquids’ electrical properties and parameters of        the strength of the E field affect the recovery of a particle shell
the E field on the mechanics of pure droplets is now well          and the arrangements of the surface particles.
described. Much less is known about the deformation of
particle-covered droplets, although, lately the knowledge gap
                                                                          II. EXPERIMENTAL SETUP AND MATERIALS
has been narrowing by the works of several research groups
[6,24,34–36,44]. However, in all these research contributions          The experimental setup consisted of an optical acrylic cu-
the particle-covered droplets were studied in a narrow range of    vette (10 × 10 × 30 mm3 ) used as a sample cell with two
E-field strengths. This is because the particle-covered droplets   copper plates that constituted electrodes, a signal generator
suspended roughly in the middle of the sample cell and             (SDG1025, SIGLENT Technologies), a high voltage amplifier
unattached to any surface could freely translate and rotate in     for generating a direct current electric signal (10HVA24-BP1,
the presence of an E field. Thus, at moderate strengths of E       HVP High Voltage Products GmbH), and a digital microscope
fields (above ∼150 V mm−1 ) a particle-covered droplet begins      (AM7315MZT, Dino-Lite) for viewing perpendicular to the
electrorotating, which prevents researching on the droplet de-     direction of the applied E field. A schematic illustrating the
formation at higher E-field strengths. In the research presented   experimental setup is shown in Figs. 1(a) and 1(b). A plastic
here, we solve this problem by docking a droplet into an           washer (outer diameter 4.0 mm, inner diameter 2.3 mm, and
O-ring washer attached to one of the walls of the sample           thickness 0.4 mm) was glued to one of the copper electrodes
cell. In this way the droplet is held in place preventing: (i)     (at its center). The washer was used to hold a droplet in place,
its motion in the sample cell due to the presence of convective    i.e., prevent: (i) its motion in the sample cell in the presence
flows of liquid in the cell and (ii) its electrorotation as well   of convective flows of liquid and (ii) its rotation [22]. The
as easing the experimental observations. Therefore, we can         presence of the washer influenced only slightly (by less than
study the behavior of a droplet and its particle shell subjected   15%) the magnitude of the droplet deformation (see Fig. S1
to much greater E-field strengths (∼300 V mm−1 ).                  of the Supplemental Material [52]). We, therefore, do not
    There is also little knowledge about the influence of par-     take it into account in the data analysis and discussion. In
ticle coverage on the droplet deformation. In this paper,          the experiments with results presented in Figs. 8 and 9, we
we investigate thoroughly this correlation. Another subject        used a cell made of glass with two glass walls coated by an
of consideration is the relaxation of the particle-covered         electrically conductive indium tin oxide (ITO) layer.
droplets. Numerous research articles deal with the relaxation          Polyethylene particles (WPMS-0.98, size ∼3 μm,
kinetics [25,35,44,45]. Lately, several works have been pub-       density ∼0.98 g cm−3 ; GPMS-0.98, size ∼18 μm, density
lished on the behavior of the particle shell after removal of      ∼0.98 g cm−3 ; BLPPMS-1.00, size ∼30 μm, density
the external force. The research concerned particle jamming        ∼1.00 g cm−3 ; REDPMS-0.98, size ∼50 μm, density
(leading to formation of stable nonspherical droplets), par-       ∼0.98 g cm−3 ; GPMS-0.98, size ∼100 μm, density
ticle shell buckling, and structural changes [46–49]. In our       ∼0.98 g cm−3 ; electrical conductivity ∼10−15 S m−1 ,
previous work on opening and closing of particle shells on         purchased from Cospheric LLC) and clay mineral particles
droplets, we found that the magnitude of the droplet defor-        (Li fluorohectorite, size ∼5 μm; density ∼2.8 g cm−3 ,
mation was nonretractable and exhibited hysteresis, and the        Corning, Inc., USA) were used to make a monolayer shell
particle shell underwent structural and morphological changes      on a silicone oil (VWR Chemicals, Rhodorsil® 6678.1000,
[46]. Rane et al. [30] reported hysteresis in deformation          density 0.96 g cm−3 , electrical conductivity ∼10 pS m−1 ,
of liquid marbles during the mechanical compression and            relative permittivity ∼2.6–2.9 at 25 °C, and viscosity 50 mPa
decompression. They attributed the presence of the hystere-        s) droplet formed in castor oil (Sigma-Aldrich 83912, density
sis to the interlocking and rearrangement of particles at the      0.961 g cm−3 at 25 ◦ C, electrical conductivity ∼60 pS m−1 ,
droplet interface. Monteux et al. [50] and Xu et al. [51] also     relative permittivity ∼4.6–4.8 at 25 °C, and viscosity 750
demonstrated the hysteresis effect by volume compression           mPa s). The interfacial tension between the two immiscible
and expansion of the droplet, and they attributed the slow         oils was around 4.5 mN m−1 .
rearrangement due to the particles aggregation at the droplet
interface.
                                                                    III. FORMATION OF PARTICLE-COVERED DROPLETS
    Different mechanisms of droplet compression and decom-
                                                                            AND EXPERIMENTAL PROCEDURES
pression were used in the four above mentioned works, and
the force on a particle-covered droplet was exerted in a differ-      We used an E-field approach (see Ref. [7]) to form a mono-
ent way. This has certain consequences. For example, during        layer particle shell on the surface of a silicone oil droplet.
the mechanical compression of a droplet by two flat slabs,         Initially, silicone oil dispersion of polyethylene (PE) particles
the particles in the shell become loosely packed. Whereas, in      was prepared using a specific particle concentration required
the method presented here and in our previous work [46], the       to form a particle-covered droplet of a certain size and a
particles are kept tight during the application of the E field,    desired particle coverage. The dispersion was ultrasonicated
which may result in buckling of the shell. Due to the limited      for 5 min to avoid particle aggregating, and, subsequently, a
understanding of our previous result, we decided to conduct        dispersion droplet was formed (using a regular mechanical
further research.                                                  pipette) in a cuvette filled with castor oil. Next, an E field

                                                             062605-2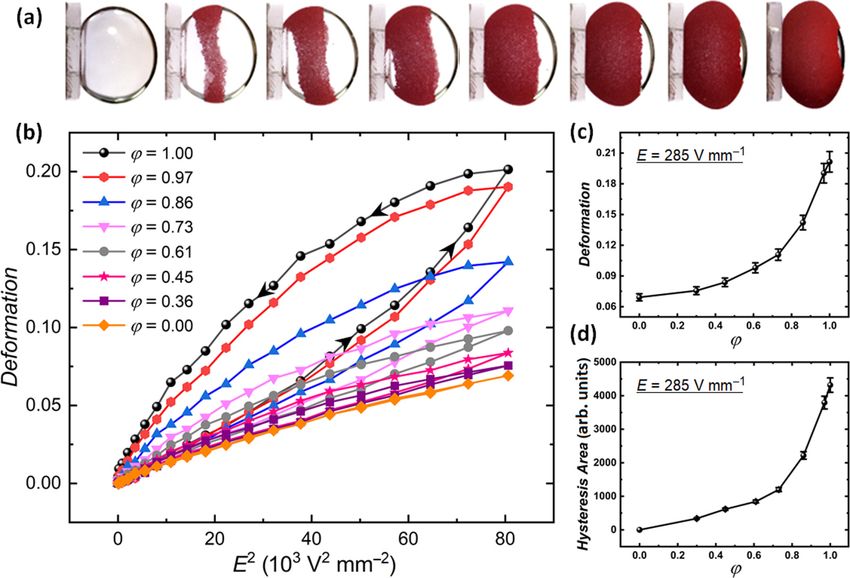
PARTICLE-COVERED DROPLET AND A PARTICLE …                                                               PHYSICAL REVIEW E 103, 062605 (2021)

    FIG. 1. (a) and (b) Schematics illustrating the experimental setup, which consisted of a digital microscope for viewing perpendicular to the
direction of the applied E field, a sample cell placed on a mechanical XYZ translational stage, a signal generator, and a voltage amplifier for
generating a high-voltage electric signal, which is provided to the electrodes inserted inside the sample cell. (c) Schematics of particle shell
opening: A droplet with the surface particles is viewed at a 30 ° angle with respect to the E-field direction, which is horizontal. Application of
an electric field (E1 ) to the initially spherical droplet (t0 ) densely covered with particles results in its deformation due to the electric stress. The
induced EHD flows convect particles away from the droplet’s electric pole thereby forming an opening in the particle layer. After application
of a stronger electric field (E2 ), the droplet deforms more, allowing the opening to grow in size, and the EHD flows to strengthen (indicated by
the longer curved arrows).

(∼200 V mm−1 ) was applied so that the particles in the                        where R = σσexin , S = exin , λ = μμexin , and R, S, and λ are the
bulk liquid of the dispersion droplet were guided toward                       conductivity, dielectric constant, and viscosity ratios, εex is
the droplet’s interface by electrostatic force. As the particles               the dielectric constant of the surrounding fluid, r0 is the ra-
reached the surface of the droplet, they were carried toward                   dius of the droplet, and γ is the interfacial surface tension
the electric equator of that droplet by the E-field induced                    between the droplet and the exterior fluid. The subscript “ex”
liquid flows. It took several minutes for all particles to get onto            represents the exterior fluid (castor oil), whereas the sub-
the interface and eventually form a packed particle monolayer.                 script “in” represents the interior fluid which is the droplet
The particles were irreversibly trapped at the droplet interface               (silicone oil). In the system studied here, the electric stress
by capillary forces as the thermal energy is a few orders of                   compresses the droplet, therefore, the magnitude of the defor-
magnitude smaller than that stemming from the capillary in-                    mation has a negative sign if the deformation is described as
teraction for microparticles [48]. The droplet was then docked                 D = (d − d⊥ )/(d + d⊥ ), where d and d⊥ are the droplet’s
in an O-ring washer to prevent its motion in the sample cell                   axes parallel and perpendicular to the E-field direction, re-
and ease the experimental observations. To avoid particles                     spectively. However, in all our plots we use the absolute value
inside the ring, we first docked a pure silicone oil droplet and               of D. Application of the E field also results in the induc-
then brought the particle-covered droplet and let it electrocoa-               tion of the electrohydrodynamic (EHD) flows. In the case
lesce. To adjust the droplet volume and the particle coverage,                 of the particle-covered droplets, these flows convect particles
some of the silicone oil was extracted from the droplet using a                away from the droplet’s electric pole, forming a particle-free
micropipette. This spherical particle-covered droplet was then                 area there. The convected particles pack densely within the
studied in an E field, which was in the horizontal direction.                  particle shell. When the E-field strength is increased, the
   When a particle-free droplet or a droplet covered with PE                   droplet deforms more, allowing the particle-free area to grow
particles is subjected to a direct current E field, free charges               in size and the EHD flows to strengthen as presented in
(ionic impurities in oils) accumulate at the droplet’s interface.              Fig. 1(c).
This results in the generation of the electric stress that deforms                 In our experiments, we varied the E-field strength and
the droplet, thereby increasing the droplet’s surface area and                 the particle coverage as well as the droplet size and studied
decreasing the particle coverage. The steady-state deforma-                    changes in the magnitude of the droplet’s deformation
tion of the droplet due to the electric stress is given by the                 by estimating the major and minor lengths of the droplet
Melcher-Taylor model [53],                                                     using GRAPHS software. We limited the E-field strength to
                                                                               285 V mm−1 because at stronger E fields (above
                                                                             ∼300 V mm−1 ) particles detached irreversibly from the
     9r0 ε0 εex E02                           2λ + 3                           droplet’s surface. The particles coverage was also estimated
D =                  S(R + 1) − 2 + 3(RS − 1)
                        2
                                                      ,
    16γ S(2 + R)2                             5λ + 5                           through image analysis of the droplets. We define here the
                                                     (1)                       particle coverage of the droplets as ϕ = S/A, where S is the

                                                                       062605-3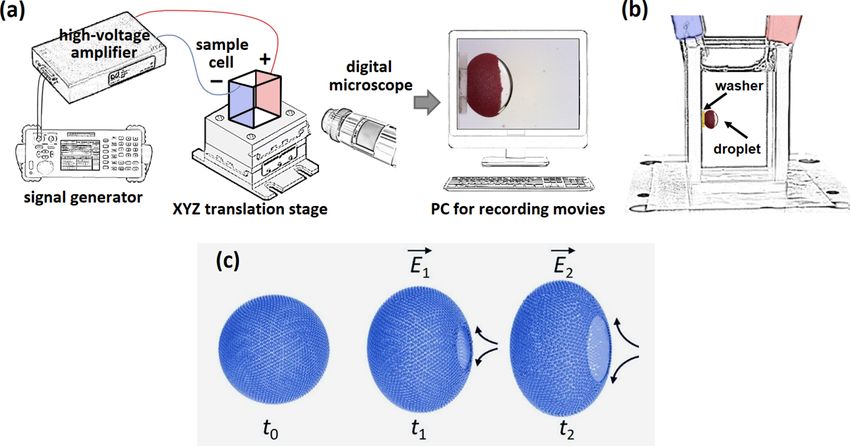
KHOBAIB, HORNOWSKI, AND ROZYNEK                                                            PHYSICAL REVIEW E 103, 062605 (2021)

surface area of the particle film and A is the surface area of      spherical. Application of the E field induced electric stress
the droplet with excluded part of the droplet in the washer.        on the droplets and resulted in their deformation, i.e., all
Thus, the value of the particle coverage as defined here is in      droplets developed an oblate shape. The strength of the E field
the range from 0 to around 1.0. ϕ = 0 defines the silicone oil      was increased stepwise from 0 V mm−1 to 285 V mm−1 and
droplet without particles, and ϕ = 1 defines the silicone oil       then decreased in the same manner to 0 V mm−1 . At each
droplet fully covered by the PE particles.                          step, the E-field strength was increased by 15 V mm−1 and
                                                                    maintained until a steady state (droplet’s deformation and par-
 IV. PARTICLE IMAGE VELOCIMETRY EXPERIMENTS                         ticle arrangement) was observed. The difference in the droplet
                                                                    deformation can be easily observed qualitatively, especially at
    The flowlines around droplets were traced using particle        strong E fields, for example, at 285 V mm−1 as presented in
image velocimetry (PIV). Fluorescent PE particles (UVPMS-           Fig. 2(a). The droplets with higher particle coverage deform
BY2-1.00, size of ∼35 μm, Cospheric LLC) were dispersed             more. In Figs. 2(b)–2(d), we present the quantitative data from
in castor oil (0.3% by weight) and poured in the sample cell.       the experiments, which reveal the nonobvious behavior of
A 500-μm thin sheet of particles was selected by focusing a         particle-covered droplets.
532-nm laser light (COM-09906-5 mW, SparkFun Electron-                  In Fig. 2(b), the magnitude of droplet deformation is plot-
ics) from above the sample cell through a laser line generator      ted against the square of the E-field strength. As expected, the
lens (Powell lens), similar as in the experiment presented in       magnitude of the deformation of the pure silicone oil droplet
Ref. [6]. During the experiments, the laser sheet was always        scales as E 2 at weak E fields (up to around 15 kV2 mm−2 ))
aligned in the middle of the drop, oriented along the E-field di-   and follows Taylor’s theory [39,54]. At stronger E fields, the
rection, and perpendicular to the view direction of the micro-      curve becomes nonlinear and bends downward. The reason
scope (see Fig. S2 in the Supplemental Material [52]). Movies       for this nonlinearity is the surface-charge convection (not
(5 fps) were recorded for each experiment with a 1920 × 1080        included in Taylor’s theory) due to the EHD liquid flows
-pixel resolution (1 pixel ∼6.2 μm). Twenty-five sequen-            making it more difficult to deform the droplet into more
tial frames were then compared and analyzed using PIVLAB            oblate shape as explained and experimentally presented in
(v.1.41, MATLAB toolbox application), yielding flow velocities      Refs. [40–42,55]. The curve for the pure silicone oil droplet is
for each interrogation area (the frames were split into a num-      entirely retraceable when the E field is decreased back to zero,
ber of interrogation areas of size 64 × 64 pixels, which were       i.e., the data points () overlap when sweeping the E field up
then individually cross-correlated with the previous frame          and down.
to obtain displacement vectors). MATLAB (v.R2017b, Math-                A different situation is observed for the droplet covered
Works) was then used to plot the flow velocities.                   with particles. The magnitude of the deformation is not re-
                                                                    traceable (i.e., there are different values of the deformation
                         V. RESULTS                                 depending on the direction of change of the E-field strength)
                                                                    and the curves form a hysteresis loop (will come back to
    General concept of the experiments: In all the experiments
                                                                    that later). In addition, the magnitude of droplet deformation
we used a tabletop experimental setup, which consisted of a
                                                                    is sensitive to particle coverage. In general, the deformation
sample cell with two electrodes, a source of a high voltage
                                                                    is greater with the increased particle coverage. In Fig. 2(c),
DC signal, and a digital microscope for viewing either parallel
                                                                    we plot the deformations measured at the strongest E field
or perpendicular to the direction of the applied E field. A
                                                                    used in the experiment (285 V mm−1 ) versus the particle
schematic illustrating part of the experimental setup is shown
                                                                    coverage (ϕ). It can be seen that the magnitude of the de-
in Figs. 1(a) and 1(b). Application of a DC E field results
                                                                    formation does not change much for the droplets with low
in a compressive electric stress that acts on particle-covered
                                                                    particle coverage but increases sharply at higher particle
droplet deforming it. When the droplet deforms, its surface
                                                                    coverages.
area increases leading to unjamming of particles in a shell.
                                                                        There are possibly two reasons for this: (i) As more of the
This, in turn, enables the induction of the EHD flows. In our
                                                                    droplet’s surface is covered by particles, the charge convection
system, these flows convect particles away from the droplet’s
                                                                    may be depleted due to the reduced strength of EHD flows
electric pole, forming a particle-free area there. The convected
                                                                    leading to accumulation of a larger amount of free charges on
particles pack densely within the particle shell. When the E-
                                                                    the droplet’s surface. This, in turn, results in stronger electrical
field strength is increased, the droplet deforms more, allowing
                                                                    stress acting on the droplet. In addition, (ii) the effective
the particle-free area to grow in size and the EHD flows to
                                                                    electrical conductivity of the droplet interface may decrease
strengthen as presented in Fig. 1(c).
                                                                    (because the PE particles are several orders of magnitude less
                                                                    conductive than silicone oil [44]), leading to the greater elec-
 A. Influence of particle coverage on the droplet deformation       trical contrast between the particle-covered silicone oil droplet
                and emergence of its hysteresis                     and castor oil and, thus, enhancing the compressive electric
   We began our research with studying the influence of             stress acting on the droplet. We conducted experiments and
particle coverage on the magnitude of steady-state droplet          performed calculations to confront the above statements.
deformation at different strengths of an E field. We pre-               In Fig. 3, we present the results of PIV experiments per-
pared seven silicone oil droplets (∼4 mm) covered by the            formed on a silicone oil droplet with PE particle particles
PE particles (∼50 μm), each droplet with different particle         (∼50 μm) at different particle coverages subjected to a DC
coverage. We also used a particle-free droplet as a reference.      E field of 170 V mm−1 . The results from the PIV experiments
Initially, in the absence of the E field, the droplets were         confirm that the induced EHD flows at droplet interfaces are

                                                              062605-4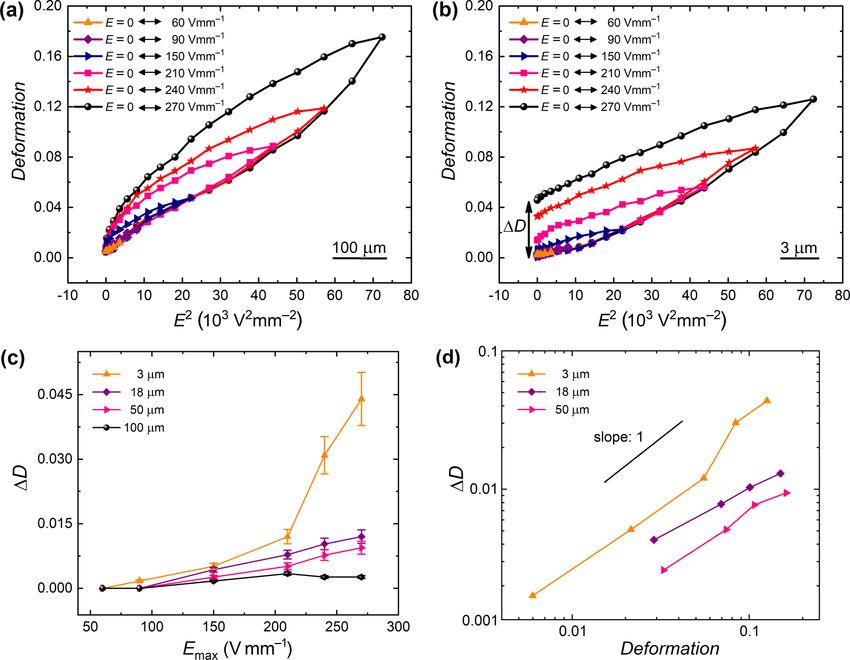
PARTICLE-COVERED DROPLET AND A PARTICLE …                                                        PHYSICAL REVIEW E 103, 062605 (2021)

   FIG. 2. (a) Silicone oil droplets with different particle coverages (ϕ) subjected to E-field strength of 285 V mm−1 . The diameter of each
droplet is ∼4 mm, and the size of the PE particles is ∼50 μm. (b) Steady-state deformation of droplets plotted as a function of the square of
the applied DC E field. The E field was increased stepwise from 0 to 285 V mm−1 and then decreased stepwise to 0 V mm−1 . The black arrows
represent the E-field sweep direction. (c) The magnitude of the droplet deformation and (d) the hysteresis area of the droplet deformation at
E = 285 V mm−1 plotted as a function of particle coverage.

indeed greatly reduced by adding surface particles. When                  flow velocity decreased from around 130 to nearly 0 μm s−1 ,
the particle coverage was increased from 0.25 to around 0.9               verifying that the straining flows surrounding a silicone oil
(droplet nearly fully covered by particles), the maximum EHD              droplet in castor oil are suppressed when the droplet is fully

    FIG. 3. (a)–(c) PIV images and (d)–(f) corresponding pictures of silicone oil droplets (diameter ∼2 mm) covered with PE particles
(size ∼50 μm). The droplets were formed in a dispersion of tracer particles (∼35 μm) in castor oil and subjected to an E-field strength of
170 V mm−1 (in the horizontal direction) yielding steady-state droplet deformations. The asymmetry of the flow fields in (a) and (b) was
caused by a slow droplet sedimentation causing slightly nonuniform particle distribution (more particles on the top of a droplet). The particle
coverage was (a) and (d) ∼0.25, (b) and (e) ∼0.55, and (c) and (f) ∼0.9.

                                                                  062605-5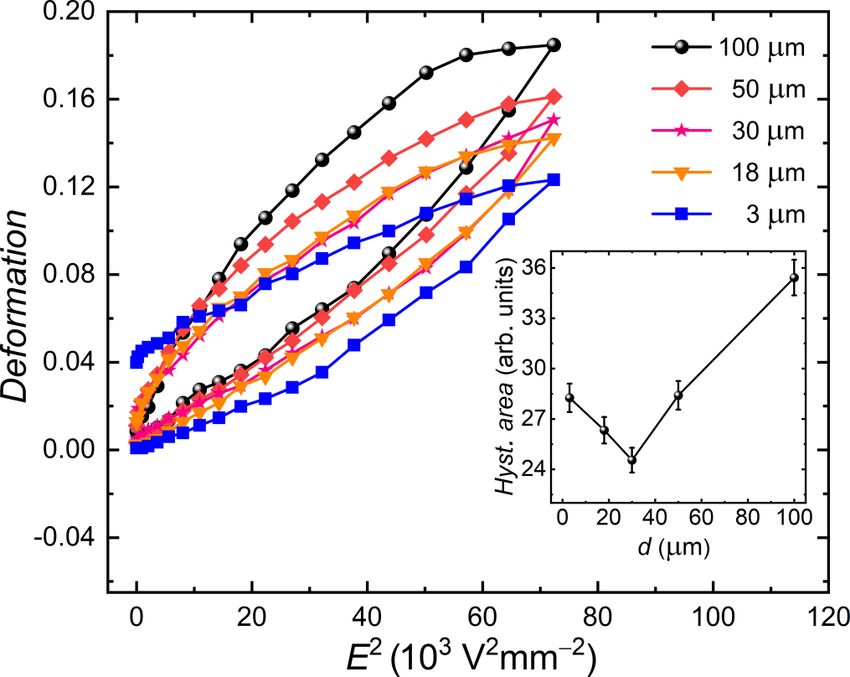
KHOBAIB, HORNOWSKI, AND ROZYNEK                                                             PHYSICAL REVIEW E 103, 062605 (2021)

   FIG. 4. (a) The electrical conductivity ratio (R) plotted as function of the particle coverage (ϕ). (b) The magnitude of the droplet
deformation (D) plotted as a function of droplets’ particle coverage. The solid line is obtained by using the Melcher-Taylor equation in
which the trigonometric dependency for the effective electrical conductivity [see panel (a)] is included.

covered by the particles. This leads to the buildup of a greater      droplet into the washer results in reduced magnitude of defor-
number of charges at the droplet’s interface, which, in turn,         mation by up to 15%. As the particle coverage increases, the
deforms the droplet more.                                             difference between the experimental and the theoretical points
    We will now estimate the change in the effective conduc-          decreases, and at high ϕ values, the magnitude of deformation
tivity of the particle covered droplet and examine its effect         is underestimated. This is because the Melcher-Taylor theory
on the magnitude of droplet’s deformation. We recall that the         does not represent well such large deformations. In addition,
EHD flows convect the particles towards the electric equator.         the presence of surface particles may influence the surface
Thus, by adding particles to the droplet’s interface, the particle    tension. Ouriemi and Vlahovska [22] showed that the surface
shell widens towards the droplet’s electric pole. The contri-         tension can be significantly reduced by adding particles to
bution of the particles’ conductivity to the effective electric       the droplet’s interface, which resulted in the increased mag-
conductivity of the droplet’s interface is practically zero for       nitude of the deformation. Overall, the tendency illustrated
those particles residing at the droplet’s electric equator. We        in Fig. 4(b) confirms the above stated hypothesis that the
know that the surface charge density distribution on a droplet        decreased effective electrical conductivity of the droplet in-
scales as cos(θ ) [55], where θ is the angle measured from            terface enhances the compressive electric stress acting on the
the zenith direction. Therefore, the particles nearest to the         droplet. However, nontrivial numerical calculations would be
droplet’s electric pole should contribute the most to the change      needed to better represent the experimental data.
in the effective conductivity. We, thus, attempt to represent the         We also observed the emergence of the hysteresis loops as
effective conductivity by the cosine function,                        the particle coverage was increased [see Fig. 2(d)]. The hys-
                                                                    teresis loop area does not change much for the droplets with
                                         π
                   σeff (ϕ) = σsil cos C1 ϕ ,                  (2)    low particle coverage. However, above coverage of around
                                         2                            0.65 the increase is sharp. The hysteresis loop is an indication
where the prefactor C1 = 0.9999 is introduced to obtain the           of the energy dissipation. In the studied system, the energy can
finite value of the conductivity when ϕ = 1, which is here the        be dissipated through heat and viscous drag. The decoupling
conductivity of PE particles. For simplicity, we assumed that         of these contributions and the estimation of the amounts of
ϕ scales linearly with θ , and θ is in the range of 0−90◦ for ϕ       energy loss from the heat dissipation and the viscous drag is
in the range of 0–1. The calculated values of the conductivity        nontrivial and is beyond the scope of this paper. Nevertheless,
ratio (R), using Eq. (2), are plotted in Fig. 4(a). Taking into       we note that during the droplet compression and recovery, the
account this trigonometric dependency in the Melcher-Taylor           particles relocate separately or through particle gliding and ro-
equation [Eq. (1)], we calculated values of D(ϕ) and plotted          tate dissipating the energy. In addition, (as it will be presented
them in Fig. 4(b) (see the solid black curve).                        in the section Jamming of a particle shell) shells composed of
    The theoretical results capture the upward bending trend          smaller particles (5 μm or smaller) undergo fracturing, which
with the particle coverage. Although, the magnitude of defor-         indicates that they form cohesive films, which may affect
mation is overestimated for ϕ values in the low range. This is        droplet’s deformation and relaxation. We, therefore, decided
what we expected: The Melcher-Taylor model does not take              to study this more closely by investigating the role of particle
into account straining flows present at low particle coverage.        size on droplet deformation and relaxation.
The straining EHD flows affect the deformation by reducing
its magnitude. As presented in Ref. [40] (see Fig. 7), the mag-
nitude of droplet’s deformation can be reduced by around 30%                B. Influence of particle size on droplet deformation
compared to that estimated from the Melcher-Taylor model. In                          and recovery of a particle shell
our case the value of the droplet’s deformation is smaller by            We performed an experiment with five silicone oil droplets
around 40% compared to the calculated valued. The reason for          (∼4 mm), each covered with different sizes of PE particles
this could be the experimental procedure in which the droplet         (from 3 to 100 μm). In the experiment, the E field was swept
is docked into the washer. As mentioned before, docking the           0 ↔ 270 V mm−1 in the same manner as in the previous

                                                               062605-6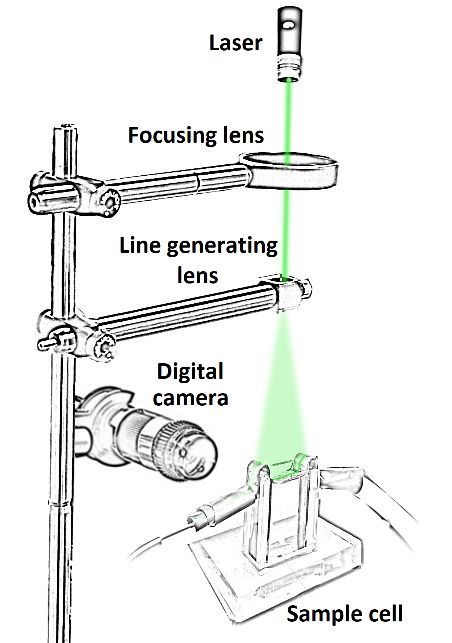
PARTICLE-COVERED DROPLET AND A PARTICLE …                                                          PHYSICAL REVIEW E 103, 062605 (2021)

                                                                            the droplet’s interface and, thus, to the magnitude of droplet
                                                                            deformation. The heterogeneous electrical characteristics of
                                                                            the particle-covered droplet, such as particle shell’s electrical
                                                                            conductivity and electrical conductivity of the droplet can be
                                                                            replaced by the equivalent homogeneous electrical conductiv-
                                                                            ity σeq using the expression [57,58],
                                                                                              2(1 − β )σPE + (1 + 2β )σsil
                                                                                       σeq = σPE                           ,
                                                                                               (2 + β )σPE + (1 − β )σsil

                                                                                                 d 3
                                                                                         β = 1−      ,                                    (3)
                                                                                                2a
                                                                            where, d is the polyethylene particle diameter and a is the
                                                                            radius of the droplet.
                                                                                According to Eq. (3), the conductivity ratio (R = σeq /σcas )
                                                                            decreases with the particle diameter as illustrated in Fig. 6(a).
                                                                            In Fig. 6(b), we plot the droplet deformation (subjected to
                                                                            the E-field strength of 270 V mm−1 ) as a function of particle
    FIG. 5. Effect of the particle size on the hysteresis area of droplet   radius plotted using Melcher-Taylor’s equation [Eq. (1)] with
deformation: Five silicone oil droplets (∼4 mm), each covered with          the conductivity ratio. Although the deformation increases
different sizes of PE particles (from 3 to 100 μm) subjected to             with the increase in particle radius, the calculated difference in
E fields. The magnitude of steady-state deformation of the droplet          the magnitude of deformations due to the particle size is much
plotted against the square of the E field that was increased stepwise       smaller than that observed experimentally (Fig. 5). Thus, the
from 0 to 270 V mm−1 and then decreased stepwise to 0 V mm−1 .              mechanical properties of the particle shell seem to dominate
The inset plot shows the estimated hysteresis area plotted against the      over the electric contribution or a different model has to be
particle size. The data reveal the threshold of particle size (30 μm),      used than the membrane model [Eq. (3)].
below which the hysteresis area grows due to the presence of residual           As can be observed in Fig. 5, the strain-stress curve is not
deformation of a particle-covered droplet (when the E field is turned
                                                                            a complete hysteresis loop for the droplet covered with the
off).
                                                                            smallest particles (3 and 18 μm). In the inset of Fig. 5, we
                                                                            plot the hysteresis area against the particle size. From that plot
experiment. The results presented in Fig. 5 show that the                   we learn that there is a particle size threshold below which, the
magnitude of droplet deformation is consistently lower for                  hysteresis area grows due to the presence of residual deforma-
the droplet covered with the smaller particles at all E-field               tion of a particle-covered droplet (when the E field is turned
strengths.                                                                  off). For better comprehension of the origin of this behavior,
    This result was surprising for us—we expected the oppo-                 we performed experiments in which we studied the effect of
site trend, i.e., the magnitude of droplet deformation to be                different E-field strengths and particle sizes on a droplet’s
consistently lower for droplets covered with the bigger parti-              deformation. Four droplets, each covered with particles of dif-
cles. We initially assumed that the tangential component of the             ferent average size ranging from 3 to 100 μm, were subjected
electric stress (everywhere on the droplet’s interface, except              to six E-field cycles, each cycle with a different maximum
the droplet’s electric pole and equator, the electric force acting          field strength.
on accumulated free charges has two components: normal                          In Figs. 7(a) and 7(b), we plotted the magnitude of droplet
and tangential) should be balanced by the bending stiffness                 deformation against the square of the applied E field for two
of the elastic particle shell that would deform out of plane.               (out of four) droplets with shells composed of 100- and 3-μm
In such a case, shells made of particles with larger diameter               PE particles, respectively. As expected, the hysteresis area
(d) should withstand greater electric stress as the bending                 increased with the increase of the E-field strength—the more
stiffness (B) of a particle monolayer formed on liquid-liquid               work performed on the particle-covered droplet, the more
or liquid-air interface scales as B ∼ d 2 [48,56]. However,                 energy is dissipated. However, when sweeping the E field
after taking a closer look on what was happening with par-                  down to zero the curves did not come back to their original
ticles at the droplet’s electric pole (we viewed the droplet                points. This is particularly apparent for the droplet covered
subjected to E fields with a direction along the E field), we               with the smallest particles [see Fig. 7(b)]. It turns out that the
understood that particle interlocking and/or rearranging had to             magnitude of the residual deformation ( D = dr − di , where
play an important role. Particle shells made of small particles             di and dr are the shapes of the initial droplet before application
are typically more cohesive comparing to a shell formed of                  of the E field and the relaxed droplet after the sweeping cycle,
larger particles. Thus, it should be more difficult to rearrange            respectively) depends on both the maximum E-field strength
particles during the compression and, hence, more difficult to              and the particle size. In Fig. 7(c), we plotted the residual
deform the droplet covered by smaller particles.                            deformation ( D) against the maximum strength of the E field
    The increased magnitude of the deformation for larger par-              applied during the sweeping. The results demonstrate that the
ticles may also have an electric origin. Therefore, we decided              magnitude of D generally increases continuously with the
to perform calculations and estimate the contribution of the                increase in the maximum strength of the E field. The data for
particle size to the change in the electrical conductivity of               the three droplets for which we see the residual deformation is

                                                                      062605-7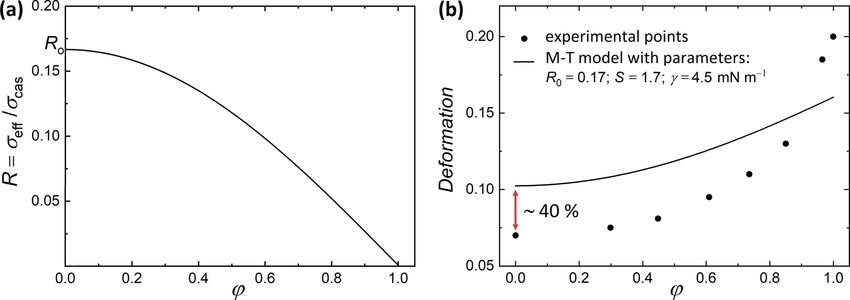
KHOBAIB, HORNOWSKI, AND ROZYNEK                                                                     PHYSICAL REVIEW E 103, 062605 (2021)

    FIG. 6. (a) The electrical conductivity ratio (R) plotted as function of the particle diameter (d). The equivalent conductivity of the particles
shell changes with the thickness of the film as expressed by Eq. (3). (b) The magnitude of the droplet deformation (D) is plotted as a function
of the particle diameter (d). The inset figures in both panels are the log-log plots.

also presented in a log-log plot of D versus D [see Fig. 7(d)].             shell, preventing the droplet from returning to its spherical
The plot reveals that D is ultimately proportional to D (the                shape. We decided to further study the jamming of particles
slope of 1 is included for a reference) within the used strengths           by viewing the droplet along the E-field direction.
of the E field. In addition, D increases with the decrease in
the particle size. This may indicate that the particles within the
shell undergo structural changes and jam before the droplet                                    C. Jamming of a particle shell
fully relaxes. When lowering the E-field strength, the particles               In Fig. 8, we present the results of an experiment on three
move on the curved surface back towards the droplet’s elec-                 droplets covered with PE particles of different sizes (diameter
tric pole. To be able to accommodate the particles and pack                 3, 18, and 100 μm). The droplets (viewed along the E-field
them densely, they need to move and rearrange without any                   direction through transparent ITO electrodes) were subjected
restrictions. Otherwise, the particles jam and form an arrested             to E = 180 V mm−1 for around 1 min and after that the E

    FIG. 7. Effect of the E field on the hysteresis area of droplet deformation: Droplets of diameter ∼4 mm fully covered by PE particles with
different particle sizes (a) ∼100 μm and (b) ∼3 μm were subjected to different E-field strengths for six cycles. (c) Residual deformation ( D)
of the four particle-covered droplets plotted against the maximum E-field strength. (d) A log-log plot of D versus D for the three droplets
(covered with particles in the size range of 3–50 μm) for which the residual deformation is observed.

                                                                    062605-8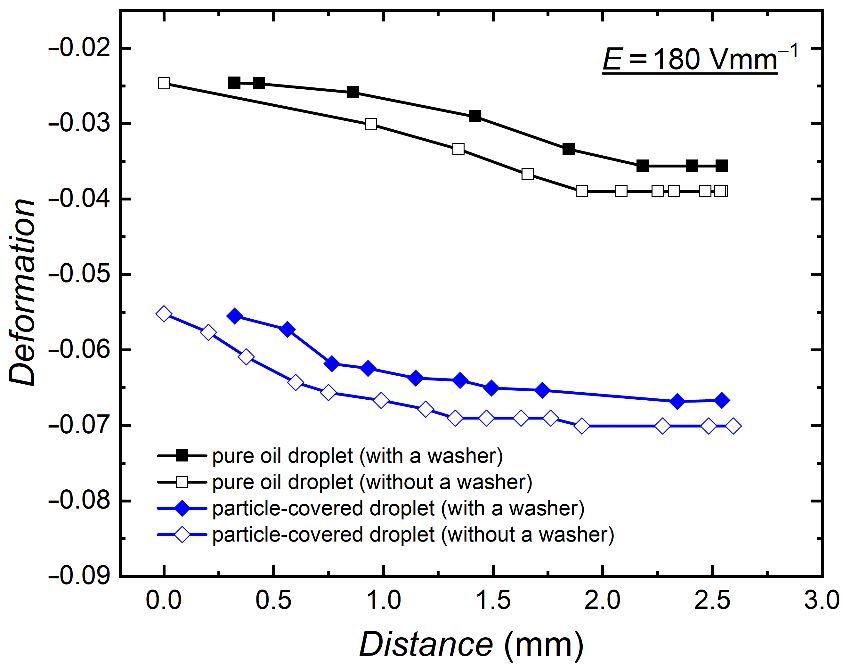
PARTICLE-COVERED DROPLET AND A PARTICLE … PHYSICAL REVIEW E 103, 062605 (2021)
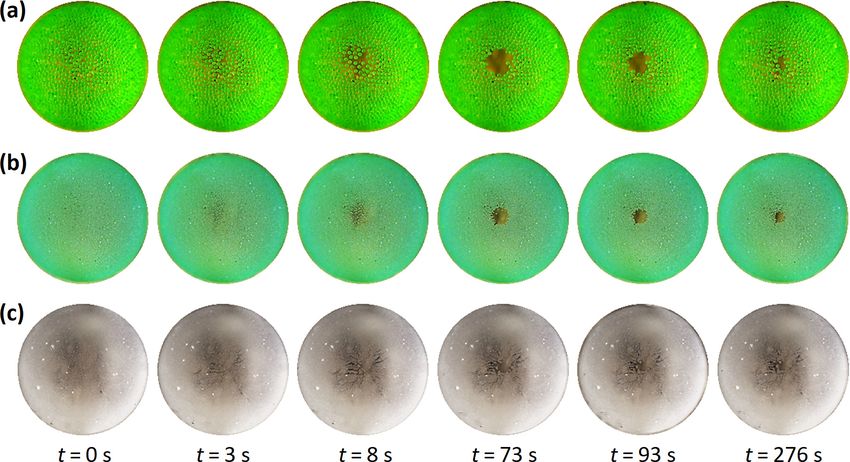
FIG. 8. Opening and closing of PE particle shells made of (a) 100 μm, (b) 18 μm, and (c) 3 μm. Initially at t = 0 s, the particle shells
were spherical in shape. Application of the E field of strength 180 V mm−1 (up to t = 73 s) resulted in (a) and (b) liquifying and (c) fracturing
of a particle shell leading to formation of a hole at the droplet’s electric pole. After the E field was turned off, the droplet relaxed back and
opening area at pole decreased by around 75%, 50%, and 25% for the shells made of 100-, 18-, and 3-μm PE particles, respectively.
field was turned off enabling droplets to relax. As shown and 50% for the shells made of 100- and 18-μm PE particles,
in Figs. 8(a) and 8(b), the application of the E field to the respectively. The behavior of the shell composed of the small-
droplets covered with 100- and 18-μm PE particles resulted est PE particles was different. Unlike the two other shells, the
in formation of a small opening at the electric pole of each shell made of 3-μm PE particles fractured during the droplet
droplet. The particles separated very easily from one another, compressive deformation [see Fig. 8(c)]. A small hole was
and the particle layer liquified. The openings had circular formed in the particle shell that recovered very little (around
shapes without any fracturing features. After switching off the 25%) after turning off the E field, leaving unhealed cracks.
E field, the droplets relaxed returning nearly to the spherical The reason for this could be the increased cohesive force be-
shapes. The size of the opening was reduced by around 75% tween the particles (which is inversely proportional to particle
FIG. 9. Opening and closing of clay mineral particle shell under different E-field strengths. The camera view is along the direction of the
applied E field. The droplet is subjected to an E-field strength of (a) 150 V mm−1 , (c) 180 V mm−1 , (e) 210 V mm−1 , and in panels (b), (d), and
(f) the E field is turned off, respectively. See also the corresponding Movie S1 in the Supplemental Material [52].
062605-9KHOBAIB, HORNOWSKI, AND ROZYNEK PHYSICAL REVIEW E 103, 062605 (2021)
size [59]) that prevents the individual particle’s rearrangement Vlahovska [22]. The researchers observed that the magnitude
during the droplet relaxation and/or the increase in packing of the droplet deformation becomes less sensitive to the par-
density of particles forming the shell. We know from our ticle coverage at high coverages. This is not the case here,
previous experiments that clay mineral particles suspended i.e., the magnitude of deformation clearly increases with the
in oils form cohesive films [52]. Therefore, we decided to particle coverage until the droplet is entirely covered. Perhaps,
perform an additional experiment in which we formed a clay the difference in the observations originates from the fact
mineral particles shell on a silicone oil droplet to compare its that Ouriemi and Vlahovska studied deformation of droplets
behavior with that of the PE particle shells. unattached to any surface and the measurements were per-
In Fig. 9, we present the results of an experiment on a formed in the narrower range of E-field strengths. This would
droplet covered with Li fluorohectorite clay mineral particles require further investigations.
(average size ∼5 μm) subjected to different E-field strengths We also found that the magnitude of the deformation is
(150–210 V mm−1 ). Typically, clay mineral particles adhere not retraceable during the electric-field sweeping, i.e., the
to each other strongly when suspended in oil due to the strain-stress curves form a hysteresis loop with the area
presence of small amounts of water (in the clay). Therefore, increasing with the increase in the E-field strength. We
they form an elastic membrane that fractures under the load observed that during the droplet compression and recovery,
unlike a sheet made of noncohesive particles that liquefies the particles relocate separately or through particle gliding
under the load [60]. When a weak E field (150 V mm−1 ) was and rotate dissipating the energy. The particle rotation and
applied, the clay particle shell fractured as shown in Fig. 9(a). gliding were documented as contributing to the friction by
The fracturing is similar to that observed for the shell made Mikkelsen et al. [27]. In addition, shells composed of small
of the smallest (3- μm) PE particles presented in Fig. 8(c). At particles fractured during the droplet compression, indicating
stronger E fields (180–210 V mm−1 ), the EHD flows ripped that they form cohesive films, which greatly affected droplet’s
off small fragments of clay particle clusters and redistributed deformation and relaxation.
them within the droplet’s surface and a nearly spherical The smallest particles were more prone to jamming and
opening was formed on the droplet’s electric pole with a size formed arrested shells on relaxed droplets. Stable nonspher-
depending on the strength of the E field (see Figs. 9(c) and 9(e) ical droplets and bubbles created by the interfacial jamming
and Supplemental Material [52] Movie S1). After turning off of arrested shells have been studied by other researchers
the E field the particle-covered droplet relaxed. However, the [12,29,63]. However, in many studies the jammed state was
droplet did not return to the initial spherical shape. Similar to achieved by increasing the particle concentration (by addition
the experiments with small PE particles [Figs. 7(b) and 8(c)], of particles to the interface or coalescing particle-covered
the clay mineral particles jammed and formed an arrested droplets). Here, the jamming occurs due to the change in
shell, leaving the hole in the particle shell. The size of the hole the particle arrangement, whereas the particle concentration
depended on the magnitude of the E field, i.e., the stronger remains unchanged. We believe, that the electric method
the applied E fields, the larger the remaining hole in the shell demonstrated here can be used as a noncontact indenter to
after E field removal. The high cohesiveness between particles study and understand the stability of curved colloidal or gran-
inhibits particle relocation when the droplet with the particle ular crystals and amorphous particle shells under load [64].
shell relaxes after turning off the E field. This, in turn, leads The results of our studies are important for developing an
to particle jamming before the opening in the shell is healed. understanding of the mechanics and rheology of monolayered
colloidal and granular shells formed on droplets (or other
curved interfaces) and the surface particle organization as
VI. CONCLUSIONS
well as the behavior of particle-covered droplets probed by
We used E fields to study the behavior of both a particle- induced stress. We demonstrated that E-field-induced droplet
covered droplet and a particle shell under compressive stress. deformation was accompanied by structural and morpholog-
Unlike the mechanical approaches (e.g., using a micropipette ical changes in the particle shell. This can be exploited in
or a micromanipulator [61,62]), the E-field methods enable multiple ways, for example, to form and study buckled ar-
contactless application of stress and measurement of droplet mored droplets and plastic rearrangements of the particle shell
deformation simultaneously with the examination of mechan- as well as to investigate fracturing of cohesive films on curved
ical properties of the particle shell. We wondered how the surfaces.
particle coverage and the particle size as well as the strength of The results of our research go beyond the academic sphere
the E field influenced the magnitude of the droplet deforma- and have practical relevance. For example, a particle-covered
tion. The experimental results indicate that adding particles droplet can be used as a miniaturized optical diaphragm with
to a droplet interface drastically changes the magnitude of an adjustable aperture [46]. Controlling reliably the light pas-
the droplet deformation. With the PIV experiments we have sage through such a diaphragm requires the knowledge on
shown that the straining flows were suppressed by the addition mechanical properties of a particle shell that opens and closes
of particles to the droplet’s surface, which, in turn, enabled via application of an E field. With the results presented here,
for generation of greater electric stress acting on the droplet. we can now better design such a responsive optical element.
We also performed theoretical calculations to capture the up- To further extend the research presented here, we suggest
ward bending trend of the magnitude of droplet deformation the future experimental studies to investigate the influence of
as a function of the particle coverage. Our experimental re- particle properties (e.g., electrical conductivity and particle
sults on the particle coverage dependency of the magnitude packing) on the stability and mechanics of particle shells
of deformation differ from those presented by Ouriemi and under E fields.
062605-10PARTICLE-COVERED DROPLET AND A PARTICLE … PHYSICAL REVIEW E 103, 062605 (2021)
ACKNOWLEDGMENTS K.K. initiated the project, designed, and performed all of
This research was funded by the Polish National the experiments. T.H. performed the theoretical calculations.
Science Centre through PRELUDIUM (Grant No. 2019/35/ K.K. authored the first draft of the paper. K.K., T.H., and Z.R.
N/ST5/02821) and OPUS (Grant No. 2015/19/B/ST3/03055) took part in discussions towards the finalization of the paper.
and programmes. We also thank the Research Council of Nor- All authors have read and agreed to the published version of
way for its support through the Centres of Excellence funding the paper.
scheme, Project No. 262644. The authors declare no conflict of interest.
[1] E. Dickinson, Curr. Opin. Colloid Interface Sci. 15, 40 [28] A. Mikkelsen, P. Dommersnes, and J. O. Fossum, Rev. Cub. Fis.
(2010). 33, 47 (2016).
[2] T. Bollhorst, K. Rezwan, and M. Maas, Chem. Soc. Rev. 46, [29] M. Cui, T. Emrick, and T. P. Russell, Science 342, 460 (2013).
2091 (2017). [30] Y. Rane, E. Foster, M. Moradiafrapoli, and J. O. Marston,
[3] D. Venkataramani, A. Tsulaia, and S. Amin, Adv. Colloid Powder Technol. 338, 7 (2018).
Interface Sci. 283, 102234 (2020). [31] S. Y. Tan, R. F. Tabor, L. Ong, G. W. Stevens, and R. R.
[4] C. L. G. Harman, M. A. Patel, S. Guldin, and G.-L. Davies, Dagastine, Soft Matter 8, 3112 (2012).
Curr. Opin. Colloid Interface Sci. 39, 173 (2019). [32] D. Zang, J. Li, Z. Chen, Z. Zhai, X. Geng, and B. P. Binks,
[5] J. Lee and T. Babadagli, J. Dispers. Sci. Technol. 41, 2048 Langmuir 31, 11502 (2015).
(2020). [33] X. Liu et al., Science 365, 264 (2019).
[6] A. Mikkelsen, K. Khobaib, F. K. Eriksen, K. J. Måløy, and Z. [34] M. S. Abbasi, H. Farooq, H. Ali, A. H. Kazim, R. Nazir, A.
Rozynek, Soft Matter 14, 5442 (2018). Shabbir, S. Cho, R. Song, and J. Lee, Materials 13, 2984 (2020).
[7] P. Dommersnes, Z. Rozynek, A. Mikkelsen, R. Castberg, K. [35] A. Mikkelsen, P. Dommersnes, Z. Rozynek, A. Gholamipour-
Kjerstad, K. Hersvik, and J. O. Fossum, Nat. Commun. 4, 2066 Shirazi, M. d. S. Carvalho, and J. O. Fossum, Materials 10, 436
(2013). (2017).
[8] V. O. Ikem, A. Menner, T. S. Horozov, and A. Bismarck, Adv. [36] A. Mikkelsen, Z. Rozynek, K. Khobaib, P. Dommersnes, and
Mater. 22, 3588 (2010). J. O. Fossum, Colloid. Surf., A 532, 252 (2017).
[9] S. N. Yin, C. F. Wang, S. S. Liu, and S. Chen, J. Mater. Chem. [37] P. M. Vlahovska, Annu. Rev. Fluid Mech. 51, 305 (2019).
C 1, 4685 (2013). [38] Z. Rozynek, R. Castberg, A. Kalicka, P. Jankowski, and P.
[10] J. Wang et al., Lab Chip 17, 1970 (2017). Garstecki, Arch. Mech. 67, 385 (2015).
[11] R. Bielas, D. Surdeko, K. Kaczmarek, and A. Józefczak, [39] G. I. Taylor, Proc. R. Soc. 291, 159 (1966).
Colloids Surf., B 192, 111070 (2020). [40] D. Das and D. Saintillan, J. Fluid Mech. 810, 225 (2017).
[12] Z. Rozynek, A. Mikkelsen, P. Dommersnes, and J. O. Fossum, [41] J. W. Ha and S. M. Yang, Phys. Fluids 12, 764 (2000).
Nat. Commun. 5, 3945 (2014). [42] P. F. Salipante and P. M. Vlahovska, Phys. Fluids 22, 112110
[13] Z. Rozynek and A. Józefczak, Eur. Phys. J. ST 225, 741 (2016). (2010).
[14] V. N. Manoharan, Science 349, 1253751 (2015). [43] D. Das and D. Saintillan, J. Fluid Mech. 914, A22 A22,(2021).
[15] W. T. Irvine, V. Vitelli, and P. M. Chaikin, Nature (London) 468, [44] M. Ouriemi and P. M. Vlahovska, J. Fluid Mech. 751, 106
947 (2010). (2014).
[16] Z. Rozynek, J. Banaszak, A. Mikkelsen, K. Khobaib, and A. [45] P. Siahcheshm, F. Goharpey, and R. Foudazi, Rheol. Acta 57,
Magdziarz, Soft Matter 17, 4413 (2021). 729 (2018).
[17] F. Sicard and A. Striolo, Nanoscale 9, 8567 (2017). [46] Z. Rozynek, K. Khobaib, and A. Mikkelsen, ACS Appl. Mater.
[18] Z. Rozynek, R. Bielas, and A. Józefczak, Soft Matter 14, 5140 Interfaces 11, 22840 (2019).
(2018). [47] Y. Xue, H. Wang, Y. Zhao, L. Dai, L. Feng, X. Wang, and
[19] C. P. Whitby and E. J. Wanless, Materials 9, 626 (2016). T. Lin, Adv. Mater. 22, 4814 (2010).
[20] K. Hwang, P. Singh, and N. Aubry, Electrophoresis 31, 850 [48] A. Mikkelsen and Z. Rozynek, ACS Appl. Mater. Interfaces 11,
(2010). 29396 (2019).
[21] J. K. Ferri, P. Carl, N. Gorevski, T. P. Russell, Q. Wang, A. [49] M. Kaganyuk and A. Mohraz, Soft Matter 16, 4431 (2020).
Boker, and A. Fery, Soft Matter 4, 2259 (2008). [50] C. Monteux, J. Kirkwood, H. Xu, E. Jung, and G. G. Fuller,
[22] M. Ouriemi and P. M. Vlahovska, Langmuir 31, 6298 (2015). Phys. Chem. Chem. Phys. 9, 6344 (2007).
[23] C. Gu and L. Botto, Soft Matter 12, 705 (2016). [51] H. Xu, S. Melle, K. Golemanov, and G. Fuller, Langmuir 21,
[24] R. B. Karyappa, S. D. Deshmukh, and R. M. Thaokar, Phys. 10016 (2005).
Fluids 26, 122108 (2014). [52] See Supplemental Material at http://link.aps.org/supplemental/
[25] L. Becu and L. Benyahia, Langmuir 25, 6678 (2009). 10.1103/PhysRevE.103.062605 for [brief description].
[26] A. B. Pawar, M. Caggioni, R. Ergun, R. W. Hartel, and P. T. [53] J. R. Melcher and G. I. Taylor, Annu. Rev. Fluid Mech. 1, 111
Spicer, Soft Matter 7, 7710 (2011). (1969).
[27] Y. Mei, G. Li, P. Moldenaers, and R. Cardinaels, Soft Matter 12, [54] D. A. Saville, Annu. Rev. Fluid Mech. 29, 27 (1997).
9407 (2016). [55] J. Q. Feng and P. Roy, Proc. R. London, Ser A 455, 2245 (1999).
062605-11KHOBAIB, HORNOWSKI, AND ROZYNEK PHYSICAL REVIEW E 103, 062605 (2021)
[56] D. Vella, P. Aussillous, and L. Mahadevan, Europhys. Lett. 68, [61] O. I. Vinogradova, O. V. Lebedeva, and B. S. Kim, Annu. Rev.
212 (2004). Mater. Res. 36, 143 (2006).
[57] A. Morshed, P. Dutta, M. R. Hossan, and R. Dillon, Phys. Rev. [62] M. P. Neubauer, M. Poehlmann, and A. Fery, Adv. Colloid
Fluids 3, 103702 (2018). Interface Sci. 207, 65 (2014).
[58] M. Pavlin and D. Miklavcic, Biophys. J. 85, 719 (2003). [63] A. B. Subramaniam, M. Abkarian, L. Mahadevan, and H. A.
[59] H. Shi et al., KONA Powder Part. J. 35, 226 (2018). Stone, Nature (London) 438, 930 (2005).
[60] Z. Rozynek, P. Dommersnes, A. Mikkelsen, L. Michels, and J. [64] K. Khobaib, A. Mikkelsen, T. Vincent-Dispotal, and Z.
O. Fossum, Eur. Phys. J.: Spec. Top. 223, 1859 (2014). Rozynek, Soft Matter 17, 5006 (2021).
062605-12SUPPORTING INFORMATION
A particle-covered droplet and a particle shell under compressive electric stress
Khobaib Khobaib1, Tomasz Hornowski1, Zbigniew Rozynek1,2
1
Faculty of Physics, Adam Mickiewicz University, Uniwersytetu Poznańskiego 2, Poznań 61-614, Poland;
2
PoreLab, The Njord Centre, Department of Physics, University of Oslo, N-0316 Oslo, Norway;
FIG. S1. Influence of the washer on the droplet’s deformation: Pure droplet and 50-µm PE particle-covered droplet
(diameter of around 3.5 mm) subjected to E-field strength of 180 V mm–1. The droplets’ deformation was studied at
different distance in respect to the electrode (being a wall of the sample cell). Two sample cells were used: with and
without a washer attached to the electrode. It can be seen that the presence of the washer influenced only slightly (by
less than 15%) the magnitude of droplets’ deformation.
FIG. S2. Experimental setup to estimate flowlines around the droplet: The experimental setup consisted of a sample
cell, a digital microscope to view flowlines around the droplet (perpendicular to the direction of the electric field), a
532-nm laser light (COM-09906-5mW laser, purchased from SparkFun Electronics), a lens for generating a 500-µm thin
laser line by fanning out one-dimensional collimated beam. The laser sheet was aligned in the middle of the droplet and
the droplet was placed in the centre of the sample cell.You can also read