TAXON-SPECIFIC TEMPORAL SHIFTS IN POLLINATING INSECTS IN MASS-FLOWERING CROPS AND FIELD MARGINS IN IRELAND
←
→
Page content transcription
If your browser does not render page correctly, please read the page content below
Special Issue on Pollination: Conference Reports from SCAPE

TAXON-SPECIFIC TEMPORAL SHIFTS IN POLLINATING INSECTS IN MASS -
FLOWERING CROPS AND FIELD MARGINS IN IRELAND

Irene Bottero*, Simon Hodge, Jane C. Stout
Department of Botany, School of Natural Sciences, Trinity College Dublin, Dublin, Republic of Ireland

                                   Abstract— In intensively cropped agricultural landscapes, the vegetation in edges
                                   and hedges (henceforth “field margins”) represents an important semi-natural
                                   habitat providing fundamental resources for insect pollinators. We surveyed the
                                   pollinating insects associated with two mass-flowering crops, apple and oilseed
                                   rape, and compared the insect fauna of the main crop with that in the field margins
                                   in the grass-dominated agricultural landscapes of Ireland. Different insect groups
                                   responded differently to the presence of the flowering crop, with honey and
                                   bumble bees more abundant in crops than margins during crop flowering, but more
                                   hover flies and butterflies in margins throughout. The composition of the insect
                                   assemblage also shifted over time due to taxon-specific changes in abundance. For
                                   example, solitary bees were most abundant early in the season, whereas hover flies
 Journal of Pollination Ecology,   peaked, and butterflies declined, in mid-summer. The temporal shift in insect
 28(8), 2021, pp 90-107            community structure was associated with parallel changes in the field margin flora,
                                   and, although we found no relationship between insect abundance and abundance
 DOI: 10.26786/1920-               of field margin flowers, Bombus abundance and total insect abundance were
 7603(2021)628
                                   positively correlated with floral diversity. After the crop flowering period, floral
                                   abundance and diversity was maintained via margin plants, but by late summer,
                                   floral resources declined. Our results confirm the importance of field margins for
                                   insect pollinators of entomophilous crops set within grass-dominated landscapes,
 Received 28 September 2020,
                                   even during the crop flowering period, and provide additional support for agri-
 accepted 21 March 2021
                                   environment schemes that protect and/or improve field margin biodiversity. The
                                   results also demonstrate that although shifts in insect and plant communities may
 *Corresponding author:
                                   be linked phenologically there may not always be simple relationships between
 botteroi@tcd.ie
                                   insect and floral abundance and richness.

                                   Keywords—Apis mellifera, Bombus spp., hover flies, butterflies, Ireland, phenology

INTRODUCTION                                                     resources subsequently leading to disruption of
                                                                 plant-pollinator interaction networks (Day 1991;
    Flower-visiting insects such as honey bees,                  O’ Toole 1994; Gathmann & Tscharntke 2002).
bumble bees, solitary bees, hover flies and
                                                                    Shifts in land use from semi-natural habitat to
butterflies provide an ecosystem service by
                                                                 intensive agriculture have been associated with
pollinating a wide range of wild and cultivated
                                                                 greatly reduced biodiversity, including pollinating
plants (Ollerton et al. 2011). Many of these insects
                                                                 insects, in many regions of the world (Ghazoul
are declining due to a combination of threats
                                                                 2005; Goulson et al. 2008). In degraded agricultural
arising from habitat loss, pesticide exposure,
                                                                 landscapes, outside of the flowering period of
invasive species and climate change (IPBES 2016).
                                                                 mass-flowering crops, both managed and
Habitat disturbance (fragmentation, degradation
                                                                 naturally-occurring pollinating insects can face
and habitat loss) is one of the main stressors
                                                                 ‘hunger gaps’ when the quantity and quality of
negatively impacting insect communities (Goulson
                                                                 pollen and nectar available does not meet
et al. 2008; Winfree et al. 2009; Le Féon et al. 2010;
                                                                 requirements (Timberlake et al. 2019). In this
Kovács-Hostyánszki et al. 2011; Scheper et al. 2013;
                                                                 scenario, hedgerows and naturally-occurring wild
Hass et al. 2018), with associated losses of floral

                                                       90
July 2021 Taxon-specific temporal shift in pollinating insects 91
flowering species in field margins represent an In the Republic of Ireland, more than 60% of
important food resource for many insect species total land area is managed as agricultural land, and
(Stanley & Stout 2014), and positive relationships 80% of this land is considered as “improved” (i.e.
between farmland pollinating insects and the intensively managed) agricultural grassland for
diversity of floral resources in these habitats are livestock production and dairy, with a smaller area
often demonstrated (e.g. Papanikolaou et al. 2017). used for arable-based crop and horticultural
In addition, hedgerows and field edges (i.e. the production (The Heritage Council, 2010; Marshall
space beyond the edge of the crop, and the & Moonen 2002; Sheridan et al. 2011; Scheper et al.
physical boundary, be that a wall, hedgerow or 2013). These landscapes are characterised by
fence; henceforth “field margins”) provide shelter, highly modified monoculture grasslands and rye-
larval host plants, a source of prey, and relatively grass leys, subjected to intensive management,
high floral diversity compared with that occurring such as reseeding, fertilisation, grazing and silage
in the centre of the main crop, and so are important making (Fossitt 2000). Field margin structures such
for supporting biodiversity in agricultural as hedgerows are a consistent feature in Irish
landscapes (Wratten 1988; Marshall & Moonen farmland, and in a landscape dominated by
2002). Because of their natural seasonal flowering species-poor improved grasslands, often provide a
sequence, the plants in field margins provide large portion of the semi-natural habitat available
resources at different times of the year, at different for wild pollinators and other wild animals. Larkin
stages of the pollinator life cycle, and/ or the et al. (2019), in a study of 119 intensively managed
development of the colony (Rotenberry 1990; farms, reported that hedgerows were present in
Marshall & Moonen 2002; Cole et al. 2017). 100% of arable, beef and dairy farms and
Additionally, the interactions between managed comprised almost 3% of their areas.
and wild pollinators will, inevitably, change in
Flowering crops are rare in Irish landscapes but
space and time in relation to both the phenologies
include oilseed rape (OSR; 10,000 ha grown in
of the mass-flowering crop and that of the wild
Ireland), other brassicas used for animal fodder,
plant species present in the same foraging ranges.
and apples for both direct consumption and cider
Deliberate introduction of native plant species making ( 700 ha; fao.org/faostat 2018 data). As
into field margins, augmentation of flora by mass-flowering entomophilous crops, both apples
sowing seed mixes or the creation of floral ‘strips’, and OSR produce large amounts of pollen and
are common techniques used in agri-environment nectar that attract a range of flower-visiting insects,
schemes to increase numbers and diversity of and are especially useful for insects such as bees
pollinators and other beneficial insects (e.g. when high quantities of resources are required
Haaland et al. 2011; Campbell et al. 2017; Curtis et early in the season for nest establishment and, in
al. 2019; Heller et al. 2019). The value of these social species, colony growth. In terms of
planting schemes to pollinating insects, however, pollination services, apple growers often augment
can be highly variable and taxonomically biased natural pollinator populations by installing
(Campbell et al. 2017; Wix et al. 2019), and their commercially produced bumble bee colonies and/
overall effectiveness can be dependent upon the or have honey bee apiaries onsite. Oilseed rape is
landscape context and the type of farming under not obligately dependent on bees or other insects
consideration (e.g. cropland vs grassland) (Scheper for pollination, but beekeepers often site apiaries
et al. 2013). In general, studies have focussed on the on or near OSR fields, and studies have shown that
role of field margins for pollinators in crop- seed set and total yield can be significantly
dominated landscapes, and in grasslands of “high reduced if insect pollinators are excluded (Stanley
biological value” – e.g. wet, calcareous or alpine et al. 2013; Perrot et al. 2018).
grasslands (Marshall & Moonen 2002; Plantureux
Thus, overall, communities of pollinating
et al. 2005). Relatively few studies have examined
insects in field margins will be influenced by
the role of field margins in shaping insect
multiple factors, including landscape context, crop
communities in agricultural landscapes
type and management, the diversity and
dominated by intensive grasslands (but see Power
abundance of flower resources present in the field
& Stout 2011; Stanley & Stout 2013).
margin and seasonality with regards to crop mass-92 Bottero et al. J Poll Ecol 28(8)
flowering. This study used both an annual (OSR) STUDY SITES
and a perennial (apple) early-season, mass- The investigation was conducted between
flowering crop, within a grass-dominated April and August 2019 at eleven study sites in The
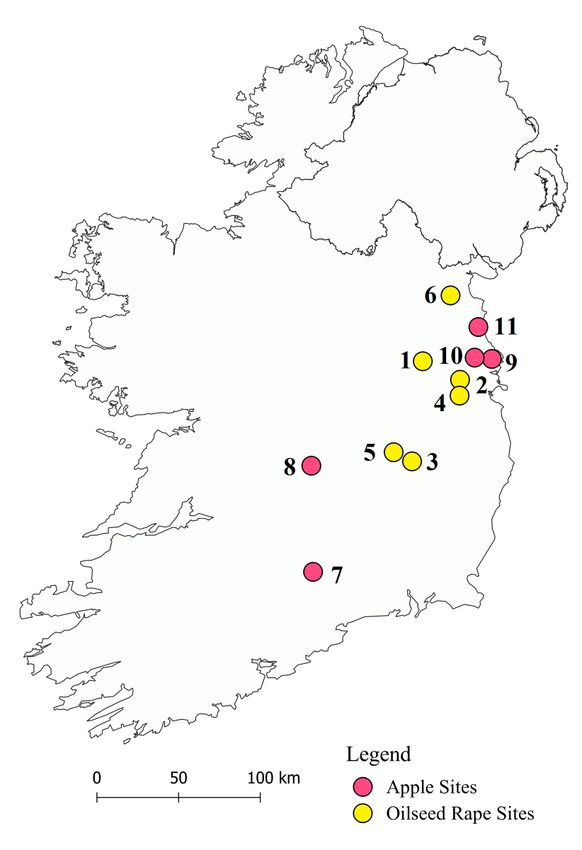
agricultural landscape, to: (1) compare the Republic of Ireland. Six sites consisted of fields of
abundance of major pollinating insect groups winter-sown OSR to represent an annual mass-
within the centre of the main flowering crop with flowering crop, and five sites were apple orchards
their abundance in the field margins, (2) that represented a perennial flowering crop (Fig. 1;
investigate whether and how the composition of Appendix I). Study sites ranged in size from 0.4 ha
the pollinator assemblage shifted in time, in to 22 ha and were a minimum distance of 9 km
connection with the changes that occur during and apart. The area of grassland in the landscape which
after the blossoming period of the mass-flowering surrounded the sites (1 km radius) ranged
crops, and (3) identify any relationships between approximately from 15% to 74%, with a mean of
insect abundance and diversity with the almost 40% (Appendix I). All sites had honey bee
abundance and diversity of wild flowering plants hives (≥ 3) and commercial colonies of Bombus
occurring in field margins. terrestris (≥ 3) along some field boundary or in close
proximity.
MATERIALS AND METHODS
FIGURE 1. Location of study sites.
Numbers correspond with
descriptions in Appendix I. Image
created with QGIS software.July 2021 Taxon-specific temporal shift in pollinating insects 93
2. Approximately one to two months after the crop
INSECT SURVEYS
flowering period (June-July 2019)
The aims of the insect pollinator surveys were
twofold: (1) to compare the communities of insects 3. Approximately three months after the crop
within the centre of the target crops with their flowering period (August 2019)
associated field margins during the crop flowering In Period 1, during crop flowering, each site
period, and (2) to examine how the field margin was visited on two occasions. On each visit, two
insect communities changed over time relative to 10-minute insect surveys were performed in the
the flowering period of the main crop.Each survey centre of the crop, and then a mean of the counts
consisted of walking a 100 m transect over a 10- for each insect group obtained. The two transects
minute period and recording the flower-visiting were chosen to be at least 30 m apart. The
insects 1 m either side of the observer (total area samplings were performed close to the crop centre
200 m2), both those actually visiting flowers, and or, when the crops/orchards were too wide, at least
those flying/resting in the transect area. Effort was 30m from the edge of the crop. Similarly, two 10-
made to avoid re-counting the same individuals minute surveys were performed in the field
during the course of the surveys but, since margins (one survey on each of two randomly
individuals were not captured, it is possible that chosen field boundaries) and a mean of these
some individuals were counted more than once. counts was obtained.
All surveys were performed between 9 am and 6
To examine the change in field margin insect
pm and were conducted during suitable weather
communities over time, each site was visited on
conditions for insect activity (wind speed < 6 m/s;
two occasions in Periods 2 and 3. At all 11 sites, one
temperature 10-28°C; no rain).
10-minute field margin survey was performed on
For quantitative analysis, insects were assigned each of two randomly chosen field boundaries on
to one of five groups: Apis mellifera, Bombus spp, each visit. For each site, the pollinator counts on
solitary bees, hover flies, or butterflies. We chose each sampling visit were performed on the same
to use these five pollinator taxa because they are two margins that were randomly chosen during
well recognized, sub-divisions of the of pollinating Period 1. Additionally, at the apple sites, two 10-
insects, and we feel information at this level minute insect surveys were also performed in the
provides a suitable description of the coarse centre of the crop. No surveys were performed in
structure of the functional guild. We did not Periods 2 and 3 in the centre of OSR crops because
perform any lethal sampling which meant that we of limited access to the fields due to normal
could not identify hoverflies and solitary bees to farming operations.
species with confidence. Nevertheless, to gain
SURVEY OF FLOWERING PLANTS
some insight into which species were found in the
study sites, the more abundant butterflies and The aim of the floral surveys was to collect
Bombus were also identified to species level, with information concerning the relative abundance
cryptic Bombus species grouped under the label of and diversity of floral resources in addition to the
Bombus terrestris/lucorum agg. (Carolan et al. 2012). main crop during the different periods of the
study. One floral survey was conducted at each
As a measure of insect richness, the number of
site in each study period.
insect groups (from five) present in each site visit
was recorded. The counts of each of the five groups In each survey, the field margin flora was
were then used to produce a version of the assessed at 12 locations, located at approximately
Shannon-Wiener diversity index, where diversity 25%, 50% and 75% of the length of the four main
(H) = -Σpi.ln(pi) and pi is the proportion of field boundaries. GPS coordinates of each location
individuals making up the ith insect group. were recorded so approximately the same
locations could be used in each study period.
The pollinator surveys were performed during
Using a 1 x 1 m quadrat to give a standardized
three different periods (Appendix I):
sample area, at each location, the entomophilous
1. During the crop flowering period (April-May plant species that were in flower were recorded on
2019) the ground and also in a vertical plane at a height
of 1.5 m if the boundary was surrounded by a94 Bottero et al. J Poll Ecol 28(8)
hedge, wall or fence. In each quadrat, the total fixed factors and site as a random factor. For this
number of floral units (Dicks et al. 2002; Baldock et analysis, a mean of the insect counts from all four
al. 2015) present was assigned to four categories: 0 surveys over the two visits for each site was
≡ no flowers present; 1 ≡ 1-10 floral units; 2 ≡ 11-100 obtained, resulting in one value per site per period
floral units; 3 ≡ > 100 floral units. for each pollinator group. This procedure
simplified the repeated measures analysis, and
To produce a summary measure of floral
resulted in an insect taxon-by-sample matrix with
abundance on each site visit, the median of the 12
the same structure as that of the floral taxon-by-
scores was calculated. As a measure of floral
sample matrix, which subsequently allowed the
diversity, the number of flowering species present
comparison of insect and floral similarity matrices
in the 12 samples, on each site visit, was recorded.
using a Mantel test (as described below). In the
Additionally, we thought it desirable to include a
above REML analyses, insect counts were square
diversity index in addition to floral species
root transformed prior to analysis, to lessen the
richness to provide additional information on the
effects of extreme counts and increase normality of
evenness (or dominance) of the flowering plants
error terms. Insect taxonomic richness and
present at each site. Rather than abundance of
diversity and all three of the floral response
floral units, we have used the presence of each
variables were not transformed.
plant species in each of the 12 quadrats to reflect
their frequency in the overall assemblage. We then Examination of the relationships between field
used a version of the Shannon-Wiener diversity margin insect abundance and diversity with floral
index calculated as, H = -Σfi.ln(fi), where fi is the abundance and diversity were assessed by
frequency of the ith species in terms of the Spearman’s rank correlation using the summary
proportion of sampling locations (from 12) where data from the 33 site visits.
it was recorded.
To examine the composition of the field margin
DATA ANALYSIS insect and floral assemblages present in each crop
Statistical analyses were performed using in each period, non-metric multidimensional
Genstat v19 software (VSN International Ltd UK) scaling (NMDS) was performed based on Bray-
and Community Analysis Package v4 (Pisces Curtis similarity matrices. For the analysis of floral
Conservation Ltd., UK). data, the frequency of each species, from 12
positions around the field boundary, was used as
During the crop flowering period, to compare a measure of relative abundance. For the insects,
the insects present in the crop centre with those the square root of the mean counts for each taxon
found in the field margins, account had to be taken at each site in each time period were used in the
of the non-independence of comparisons made analysis. Separation of samples based on crop and
within each site, and on each sampling visit. sampling period was assessed using analysis of
Therefore, a residual maximum likelihood (REML) similarity (ANOSIM; Clarke 1993; Henderson &
mixed model was fitted with crop type (APP or Seaby 2008), which produces an indication of
OSR) and location (crop centre or field boundary) statistical significance by comparing the relative
defined as fixed factors and site and sampling visit within- and between-group similarity with that
as random factors. To compare the insect obtained by 1000 random permutations of the raw
assemblages in the centre and field margins of the data.
apple crops over the three sampling periods, a
REML repeated-measures model was fitted with A Mantel test, based on the similarity matrices
location (crop centre or field margin) and sample used for the NMDS, was used to examine the
period treated as fixed factors and site and site- association between the shifts in the plant and field
visit as random factors. margin insect assemblages over time and between
crop types. This test used Spearman’s rank
For the analysis of the field margin insect and correlation to give a base indication of the strength
floral data (abundance, species richness and of the relationship and obtained a P-value by
diversity) over time in both crops, a REML calculating the proportion of 1000 random
repeated-measures model was fitted with crop permutations of the similarity matrices which
type (APP or OSR) and sample period fitted as produced a higher correlation coefficient. TheJuly 2021 Taxon-specific temporal shift in pollinating insects 95
whole process was performed 20 times and a mean
P-value obtained.
RESULTS
(A)
A total of 3,048 insect was recorded during the
Crop type Location Interaction
216 ten-minute surveys (36 hours of observation)
n.d.f. 1 1 1
carried out during the whole study, consisting of
1,052 Apis mellifera, 618 Bombus spp., 167
Apis mellifera 0.609 0.098 0.217
butterflies, 1,013 hover flies and 198 solitary bees.
Bombus 0.588 0.029 0.014
In the 88 ten-minute surveys (total 14.67 hours Butterflies 0.756 0.032 0.158
of observations) carried out during the main crop Solitary bees 0.055 0.390 0.470
flowering period, a total of 1,543 pollinating insects
Syrphids 0.380 0.027 0.731
were observed, consisting of 900 Apis mellifera, 264
Total 0.709 0.462 0.033
Bombus spp., 150 solitary bees, 174 syrphids and 55
butterflies. There were no overall statistically
Richness 0.348 0.063 0.859
significant differences between the apple and OSR
crops in terms of insect diversity or the abundance Diversity 0.156 0.203 0.733
of any of the five insect groups, although there was
(B)
moderate evidence (P = 0.055) that solitary bees
were more abundant in apples than OSR (Tab. 1A; Period Location Interaction
Fig. 2). n.d.f. 2 1 2
Apis mellifera and solitary bees showed no
Apis mellifera 0.041 0.639 0.003
significant differences in abundance between the
crop centre and the field margins (Tab. 1A; Fig. 2), Bombus 0.548 0.206 0.017
whereas butterflies and syrphids were more Butterflies 0.003 0.012 0.102
abundant in the field margins than in the crop Solitary bees 0.015 0.213 0.409
centre, especially in OSR. Bombus were more Syrphids 0.047 < 0.001 0.316
abundant in the crop centre than in the field Total 0.201 0.326 0.002
margins, although this effect was only apparent in
the apple orchards (Fig. 2, Appendix II). The most Richness 0.149 < 0.001 0.206
abundant butterfly species recorded were Diversity 0.024 < 0.001 0.247
Anthocaris cardamine and Pieris spp. (Appendix II).
Five species of Bombus were recorded: B. hortorum, (C)
B. pascuorum, B. pratorum, B. lapidarius and
Crop type Period Interaction
individuals belonging to the B. terrestris/lucorum
n.d.f. 1 2 2
aggregation (Appendix II).
Apis mellifera 0.766 0.082 0.512
Bombus 0.106 0.430 0.466
Table 1. Results of REML analysis (P-values) examining
the response of insect abundance and pollinator diversity Butterflies 0.245 < 0.001 0.591
to: (A) crop type (APP v OSR) and location (crop centre v Solitary bees 0.445 0.016 0.124
field margin) during the main crop flowering period (B)
Syrphids 0.118 0.004 0.524
location (crop centre v field margin) and study period
considering only the insects recorded in the apple sites Total 0.180 0.181 0.936
and (C) crop type (APP v OSR) and study period
considering the insects in both crops but only in the field Richness 0.577 0.160 0.718
margins. Insect abundance data were square root
Diversity 0.669 0.092 0.845
transformed before analysis. n.d.f. – numerator degrees
of freedom.96 Bottero et al. J Poll Ecol 28(8)
25 Apis Boundary 6 Bombus Boundary
In Crop In Crop
20 5
Count (10 min-1)
Count (10 min-1)
4
15
3
10
2
5 1
0 0
Apples OSR Apples OSR
2.0 Butterflies Boundary 5 Solitary bees Boundary
In Crop In Crop
4
Count (10 min-1)
Count (10 min-1)
1.5
3
1.0
2
0.5
1
0.0 0
Apples OSR Apples OSR
8 Syrphidae Boundary 40 Total Boundary
In Crop In Crop
Count (10 min-1)
Count (10 min-1)
6 30
4 20
2 10
0 0
Apples OSR Apples OSR
5 Boundary 1.2 Boundary
In Crop In Crop
4 1.0
Diversity Index
Richness
0.8
3
0.6
2
0.4
1 0.2
0 0.0
Apples OSR Apples OSR
Figure 2. Abundance and diversity (mean ± SE) of pollinating insects in the centre of the main crop and in the field margins
during flowering of OSR (n = 6) and apples (n = 5).terrestris/lucorum agg. making up around 60% of
INSECTS IN THE CENTRE AND FIELD MARGINS OF APPLE
ORCHARDS DURING AND AFTER MAIN CROP FLOWERING the Bombus records (Appendix II).
In the 120 ten-minutes surveys (total 20 hours No significant differences occurred between the
of observations) performed in the apple orchards, apple and OSR crops in terms of abundance of any
a total of 1,488 pollinating insects were recorded, insect group and the diversity measures, and there
consisting of 595 Apis mellifera, 302 Bombus spp., were no significant statistical interactions between
134 solitary bees, 394 syrphids and 63 butterflies. crop type and survey period (Tab. 1C; Fig. 4).
Eleven species of butterflies and six species of FLOWERING PLANTS IN THE FIELD MARGINS DURING AND AFTER
bumble bees were observed during the surveys, THE MAIN CROP FLOWERING PERIOD
the most abundant being Pieris spp. and B.
Across the 33 site visits, 82 species of plants
terrestris/lucorum agg. respectively (Appendix II).
were observed in flower in the field margins; 73
Overall, there was steady decline in insect species on the ground and 25 species in the
numbers over the three observation periods, with ‘vertical’ hedge quadrats. Many plant species were
810 insects observed in Period 1 (during apple relatively uncommon over the whole study period,
flowering), 437 in Period 2 and 241 in Period 3 and 41 of the 82 species recorded were only
(Tab. 1B; Fig. 3). observed in one of the 33 surveys. Common
species (> 30% of site visits) included Rubus
Apis mellifera, Bombus spp. and solitary bees
fruticosa, Ranunculus repens, Crataegus monogyna
were most abundant during the main crop
and Vicia sepium (Appendix III). The two most
flowering period. Additionally, Apis mellifera and
common flowering woody species flower in
Bombus spp. were most abundant in the centre of
sequence (C. monogyna in May-June, and R.
the crop during this first period (Tab. 1B; Fig. 3).
fruticosus June-August), whereas the two most
Bombus were evenly distributed between the centre
common herbaceous species (Ranunculus repens
and field margins in Periods 2 & 3, whereas Apis
and Vicia sepium) were in flower in all sampling
mellifera, although very much reduced in numbers,
periods.
were more common in the field margins than the
centre of the orchard. There were no statistically significant
differences between the apple and the OSR sites in
Solitary bees showed no overall differences in
terms of the field margin floral abundance and
abundance between the field centre and margins,
diversity measures (Tab. 2; Fig. 5), although
and were very uncommon later in the season (Tab.
abundance and diversity of field margin flowers
1B; Fig. 3). Butterflies and syrphids were both most
did differ significantly among the three periods,
abundant in the field margins compared with the
the patterns being slightly different in the two
centre of the crop, but whereas butterflies showed
crops, but in general these values were lowest in
a dip in abundance in Period 2, there was a peak in
Period 3 (Tab. 2; Fig. 5).
hover fly observations in the same period (Tab. 1B;
Appendix II; Fig. 3; see also Fig. 4). NMDS ANALYSIS OF INSECTS AND FLOWERING PLANTS IN THE
FIELD MARGIN
INSECTS IN THE FIELD MARGINS OF BOTH CROPS DURING AND
AFTER THE MAIN CROP FLOWERING PERIOD For the assemblages of pollinating insects, the
NMDS analysis did not distinguish the samples
In the 132 ten-minute surveys (total 22 hours of
from the different crops in any study period
observations) carried out during the three study
(ANOSIM, P > 0.20) but did separate the
periods in the field margins, a total of 2,015
assemblages recorded in the three different
pollinating insects were recorded, consisting of 522
sampling periods into more-or-less distinct
Apis mellifera, 367 Bombus spp., 136 solitary bees,
clusters (ANOSIM P < 0.002; Fig. 6). The Period 1
848 syrphids and 142 butterflies. Sixteen species of
data were separated from that obtained in Periods
butterfly, which represents just under half of the 33
2 and 3 along NMDS Axis 1, whereas the Period 3
species currently listed as resident in Ireland, and
samples were separated from the Period 1 and 2
six species of Bombus recorded along the field
samples along NMDS Axis 2 (Fig. 6). Relative to
margins over the three periods, with Bombus
Period 1, the Period 2 samples were associated
with a high abundance of syrphids, whereas
9798 Bottero et al. J Poll Ecol 28(8)
25 Apis 6 Bombus
Couunt (10 min-1)
Count (10 min -1)
20
4
15
10
2
5
0 0
Period 1 Period 2 Period 3 Period 1 Period 2 Period 3
2 6 Solitary bees
Butterflies
Count (10 min-1)
Count (10min-1)
4
1
2
0 0
Period 1 Period 2 Period 3 Period 1 Period 2 Period 3
12 Syrphidae 40 Total
10
Count (10 min-1)
Count (10 min-1)
30
8
6 20
4
10
2
0 0
Period 1 Period 2 Period 3 Period 1 Period 2 Period 3
5 1.2
Pollinator Richness
Pollinator Diversity
4
0.8
3
2
0.4
1
0 0.0
Period 1 Period 2 Period 3 Period 1 Period 2 Period 3
Figure 3. Abundance (mean ± SE) and diversity of pollinating insects in the centre of the crop (white columns) and field
margins (grey columns) of apple orchards (n = 5) during (Period 1), 1-month after (Period 2) and 3-months after flowering
(Period 3) of the main crop.July 2021 Taxon-specific temporal shift in pollinating insects 99
20 Apis 6 Bombus
Couunt (10 min-1)
Count (10 min -1)
16 5
4
12
3
8
2
4 1
0 0
Apples OSR Apples OSR
Period 1 Period 2 Period 3 Period 1 Period 2 Period 3
4 6 Solitary bees
Butterflies
Count (10 min-1)
5
Count (10min-1)
3
4
2 3
2
1
1
0 0
Apples OSR Apples OSR
Period 1 Period 2 Period 3 Period 1 Period 2 Period 3
25 Syrphidae 30 Total
Count (10 min-1)
Count (10 min-1)
20
20
15
10
10
5
0 0
Apples OSR Apples OSR
Period 1 Period 2 Period 3 Period 1 Period 2 Period 3
5 1.4
Pollinator Richness
Pollinator Diversity
1.2
4
1.0
3 0.8
2 0.6
0.4
1
0.2
0 0.0
Apples OSR Apples OSR
Period 1 Period 2 Period 3 Period 1 Period 2 Period 3
Figure 4. Abundance (mean ± SE) of pollinating insects in field margins during the flowering period (Period 1), 1-month after
flowering (Period 2) and 3-months after flowering (Period 3) in OSR (n = 6) and apples (n = 5).100 Bottero et al. J Poll Ecol 28(8)
Period 3 was associated with low numbers of (A) 3
solitary bees and high numbers of butterflies (see
also Fig. 4).
Abundance
2
The ANOSIM procedure indicated significant
differences among the floral assemblages obtained
in the different periods (P < 0.005) and,
accordingly, the NMDS analysis indicated that the
1
field margin flora observed in Period 1 was
separated from those obtained in Periods 2 and 3
along NMDS Axis 1, and that Periods 2 and 3 were 0
separated along Axis 2 (Fig. 6). The only groups of Apples OSR
samples not identified as significantly different Period 1 Period 2 Period 3
were the OSR and apples clusters in Period 2 (P =
0.139), and the apple and OSR clusters in Period 3
(P = 0.115). From the NMDS plot, this result is (B) 12
visualized as a separation of the floral assemblages
in OSR and apple crops in Period 1, but a
10
Floral richness
convergence of the field margin floras in the two 8
crops in the latter periods (Fig. 6). The Period 1
samples were associated with relatively high 6
abundances of Crataegus monogyna and Taraxacum 4
officinale (L.) Weber ex F.H. Wigg whereas the
Period 2 and 3 surveys performed later in the year 2
were associated with Rubus fruticosus and 0
Geranium robertianum L. (Appendix III).
Apples OSR
Period 1 Period 2 Period 3
Table 2. Results of REML repeated measures analysis
(P-values) examining the effects of crop type (apples/
OSR) and period (flowering period/ 1-month after (C)
flowering period / 3-month after flowering period) on
abundance and diversity of flowering plants in the field 2
Floral diversity
boundary. Site was included in the REML model as a
random factor. n.d.f. – numerator degrees of freedom;
d.d.f – denominator degrees of freedom.
Crop type Period Interaction 1
n.d.f. 1 2 2
d.d.f. 9 18 18
Median 0.137 0.002 0.272
abundance
0
Total 0.610 0.004 0.373 Apples OSR
species Period 1 Period 2 Period 3
richness
Diversity 0.414 < 0.001 0.068 Figure 5. Abundance and diversity (mean ± SE) of
entomophilous flowering plants in field boundaries during
the flowering period (Period 1), 1-month after flowering
(Period 2) and 3-months after flowering (Period 3) in OSR
(n = 6) and apples (n = 5), where (a) median abundance
score, (b) total species of species in flower, and (c) species
diversity of flowering species.July 2021 Taxon-specific temporal shift in pollinating insects 101
2D stress = 0.178 NMDS 2 Pollinators
NMDS 1
OSR 1 APP 1 OSR 2 APP 2 OSR 3 APP 3
2D stress = 0.152 NMDS 2 Flowers
NMDS 1
FIGURE 6. NMDS plots based on
abundance of five groups of
pollinating insects occurring in
field margins and relative
frequency of field boundary
flowering plants in apple orchards
(APP) and OSR during the main
crop flowering (Period), 1-month
after flowering (Period 2) and 3-
months after flowering (Period 3).
OSR 1 APP 1 OSR 2 APP 2 OSR 3 APP 3
showed no significant correlations with any plant
RELATIONSHIPS BETWEEN INSECTS AND FLORAL ASSEMBLAGES
measure, whereas the abundance of Bombus spp. (P
Only weak to moderate correlations (rS < |0.4|) < 0.05) and syrphids (P < 0.1) were moderately
were found between the abundance and diversity correlated with floral diversity (H). The abundance
of insects and flowering plants (Fig. 7; Tab. 3). The of butterflies was negatively correlated with floral
abundance of Apis mellifera and solitary bees species richness (S) (Fig. 7; Tab. 3). The number of102 Bottero et al. J Poll Ecol 28(8)
insect groups present (S) and insect diversity (H) turn, only some groups, such as butterflies and
were not correlated with any measure of flower syrphids, showed a distinct preference for field
abundance or diversity (Tab. 3). margins. During the flowering period for both
apples and OSR, adult butterflies and syrphids are
A Mantel test based on rank correlations of the
not entirely driven by requirements for pollen and
similarity matrices used for the NMDS indicated a
nectar, and the wild plant species present in the
weak, although statistically significant, positive
field margins offer resources for both adults and
relationship between the patterns seen in the insect
their offspring, for example host plants for
and floral assemblages seen in the field margins of
lepidopteran larvae and prey and for
the different crops over time (rS = 0.133, P < 0.025).
aphidiphagous syrphids (Potts et al. 2009; Stanley
DISCUSSION & Stout 2013). The occurrence of honey bees and
solitary bees in both the centre and margins of the
In the context of our study set in the grass- OSR crop suggest these different habitats offer
based Irish agricultural landscape, these results alternative and/ or complementary resources, and
demonstrate that pollinating insects are relatively it is known that many wild flowers share
abundant in field margins even when these pollinating insect species with OSR (Zurbuchen et
margins enclose an in-flower mass-flowering crop, al. 2010; Jauker et al. 2012; Stanley & Stout 2014;
but also highlight that this pattern is highly taxon Coudrain et al. 2016).
specific. In particular, honey and bumble bees
were more abundant in the crop during its Although it has been shown that Bombus
flowering period, but hover flies and butterflies colonies do not perform well in a landscape
were more prevalent in the boundaries. This could dominated by apple orchards (Proesmans et al.
be because social bees can fly relatively long 2019), our results indicated that Bombus showed a
distances to visit mass-flowering resources preference to forage on apple blossoms compared
(Osborne et al. 2007), and because of the other with adjacent field margins during Period 1 (April-
resources offered by boundaries for other insects May). This pattern may have been accentuated by
(e.g. mating and oviposition sites, and larval the presence of managed B. terrestris colonies on
microhabitats) (Power & Stout 2011). The site, and thus larger number of individuals, during
assemblage of field margin pollinating insects the apple flowering period, but was also observed
shifted in time relative to the crop flowering in non-commercial species (20 individuals in the
period, a pattern also shown by the assemblage of centre of the crops and 12 in the field margin). The
field margin flowering plants, although there were syrphids and butterflies showed a general
no general relationships between insect abundance preference for the field margins over the main crop
and diversity with the quantity and diversity of in all three study periods, and, because A. mellifera
flowers available. and solitary bees were recorded primarily in the
field margins after flowering had ceased, insect
In an Irish landscape dominated by improved diversity and richness were, as a consequence,
grassland, field margins and hedgerows might be highest in the field margins.
expected to provide refuge, food and larval
resources for various groups of pollinating insects When assessing the field margin insect
(Power & Stout 2011; Volpato et al. 2020). Indeed, assemblages in both crops over the three periods,
Stanley & Stout (2013) reported that all pollinating we found taxon specific differences in abundance
insect groups were more abundant in field margins among study periods but no significant differences
compared to the crop centre for a range of crops. between the two crops. Apis mellifera did not show
However, when mass-flowering crops such as OSR any temporal shift, at least in the field margins,
are in bloom, this pattern can change. For example, which was unexpected as some beekeepers moved
Walther-Hellwig & Frankl (2000) found there were colonies to new sites once flowering ceased. The
more Bombus in OSR than in the hedgerows or field abundances of solitary bees, hover flies and
boundaries. During the main crop flowering butterflies all differed among the three study
period, we found no evidence that any insect periods, but all three groups exhibited different
group was more abundant in the centre of the OSR patterns. These phenological shifts in abundance
crop compared with the field margins, but that, in and/-or activity of adult hover flies and butterfliesJuly 2021 Taxon-specific temporal shift in pollinating insects 103
40 Apis 40 Apis
Abundance
Abundance
30 30
20 20
10 10
0 0
0 5 10 15 0 1 2 3
Plant S Plant Abundance
10 10
Bombus Bombus
8 8
Abundance
6 Abundance 6
4 4
2 2
0 0
0 5 10 15 0 1 2 3
Plant S Plant Abundance
10 10
Solitary bees Solitary bees
8 8
Abundance
Abundance
6 6
4 4
2 2
0 0
0 5 10 15 0 1 2 3
Plant S Plant Abundance
40
40 Syrphidae Syrphidae
30
Abundance
Abundance
30
20
20
10 10
0 0
0 5 10 15 0 1 2 3
Plant S Plant Abundance
10 10 FIGURE 7. Scatterplots
Butterflies Butterflies illustrating relationships
8 8
between abundance of
Abundance
Abundance
6 6 pollinating insects (mean
counts per 10 min) with
4 4 species richness and
2 2 abundance (median
abundance score) of field
0 0 boundary flowering plants
0 5 10 15 0 1 2 3 over three study periods.
Plant S Plant Abundance104 Bottero et al. J Poll Ecol 28(8)
Table 3. Spearman’s rank correlation coefficients (rS) showing strength and direction of relationships between attributes of
pollinating insect assemblage and diversity and abundance of flowering plants in field boundaries during 3 site visits. [Critical
values of rS with n = 33, P < 0.05 |0.356|** and P < 0.1 |0.301|*].
Floral variables
Median abundance score Flower diversity H Flower richness S
Apis mellifera abundance 0.153 0.151 0.176
Bombus abundance 0.197 0.356** 0.228
Solitary bee abundance 0.292 0.184 0.197
Syrphid abundance 0.196 0.337* 0.328*
Insect variables
Butterfly abundance -0.134 -0.327* -0.394**
Total abundance 0.290 0.365** 0.301*
Insect S 0.167 0.248 0.179
Insect H 0.057 -0.002 -0.027
for the insects, although some separation of the
have been reported previously (Ball & Morris,
floral assemblages occurred between OSR and
2015; Bond & Gittings 2008; Cole et al. 2017): many
apples in Period 1, probably because OSR flowered
species of butterfly in Ireland are known to exhibit
earlier and so sampling Period 1 occurred several
such seasonal ‘bimodal’ peaks in abundance,
weeks earlier than in apples (Appendix I). The
resulting from an early population of adults
results of the Mantel test also indicated that these
breaking hibernation, followed by a later
temporal shifts in the assemblages of
generation arising from their offspring (Bond &
entomophilous flowers were associated with
Gittings 2008).
parallel temporal shifts in the composition of the
The changes in relative abundance of the five insect assemblages, suggesting that the
insect groups among study periods resulted in a composition and structure of insect-plant
temporal shift in the composition of the field interaction networks within each site would also
margin insect assemblage. There were no shift with time (Rotenberry 1990; Timberlake et al.
differences in the composition of the field margin 2019).
insect assemblages found on the two crops,
There are many examples of positive
possibly because, even when a mass-flowering
relationships occurring between field margin plant
event occurs, field margins represent a consistent
diversity/ abundance with the diversity/
feature occurring through the relatively
abundance of pollinating insects, for example:
homogeneous Irish agricultural landscape, and
honey bees (Sanchez et al. 2019), wild bees (Power
because we only identified insects to functional
and Stout 2011; Kovács-Hostyánszki et al. 2019),
groups. Seasonal shifts in insect abundance have
Bombus (Potts et al. 2009; Purvis et al. 2020),
been reported in several previous studies, and
butterflies (Potts et al. 2009; Wix et al. 2019) and
their interactions with naturally-occurring
syrphids (Sutherland et al. 2001; Cole et al. 2017).
flowering plants will likely change once the
In our study, the different pollinator groups
numerically-dominant (crop) flowers are no longer
exhibited different temporal patterns in
present (e.g. Stanley & Stout 2014; Tiedeken &
abundance, so we felt it was unlikely that we
Stout 2015; Kovács-Hostyánszki et al. 2019).
would see any consistent relationships between
The abundance of floral units and diversity of insect abundance and the abundance and diversity
entomophilous flowers in the field margins also of floral resources in the field margins: fittingly,
varied significantly among study periods, the correlations we observed were generally weak.
although, as with the insects, there were no This finding may represent a true situation when
differences between the OSR and apple sites. In pollinator metrics are correlated with floral
terms of composition of the floral assemblage, a components over time, although the lack of
similar temporal shift was observed as was seen statistically-significant relationships may haveJuly 2011 Sit-and-wait pollination 105
also reflected numerous methodological aspects of margin biodiversity should consider seasonal
our study: the coarse measures of abundance we changes in insect and plant abundance and be
used for floral units, the pooling of insects into conscious that indicators or indices of farmland
higher taxonomic groups, some spurious high biodiversity or conservation success based on
counts of insects, and the prevalence of zero counts pollinating insects may not always be correlated
for some taxa in some periods. We did identify with similar indices based on flowering plants.
positive correlations between floral diversity and
Bombus abundance and the total abundance of ACKNOWLEDGEMENTS
pollinating insects, which is in general agreement This project received funding from the European
with the studies given above. The lack of Horizon 2020 research and innovation program under
relationship between the numbers of syrphids and grant agreement no.773921. We acknowledge input from
floral abundance and diversity is similar to that Simon Potts, Oliver Schweiger, Alex Klein, Maj Rundlöf,
reported by Power & Stout (2011), and so is at least Matthias Albrecht and Mark Brown in developing
consistent in the context of Irish field margin surveying and site-selection protocols, and thank
insects set in pasture-based agriculture. Christophe Dominik for data on composition of
landscape surrounding sampling sites. We thank Amy
We acknowledge that our results were obtained Turner, Elena Zioga, Sarah Gabel, Muireann Cotter,
from only a single growing season, and that the Margareta Kluth and Teresa Rigoletti for help with field
sample size, in terms of study sites, offered low work, and Paul Dowding for his valuable assistance
statistical power for the detection of weak effects. with plant identification. A special acknowledgement is
expressed to the farmers who made us welcome and
Additionally, spatial or temporal patterns that
allowed us access to their crops.
may occur for individual species may have been
lost by pooling our insect records into higher APPENDICES
taxonomic groups, and we have not considered
variation in field boundary type within and Additional supporting information may be found in the
online version of this article:
between study sites. If practicable, future studies
would likely benefit from achieving species-level Appendix I. Summary of study sites information
identifications to gain more detailed insight into Appendix II. Species list of butterflies and bumble bees
the autecology of individual pollinator species,
Appendix III. Species list of field margin flora
and also by examining the robustness of any
habitat or temporal responses by assessing their REFERENCES
repeatability over multiple growing seasons.
Baldock KCR, Goddard MA, Hicks DM, et al (2015)
Nonetheless, the data we obtained enabled us Where is the UK’s pollinator biodiversity? The
to address the original aims of the study, and importance of urban areas for flower-visiting insects.
confirm that hedgerows and field margins, even The Royal Society. Proceedings of the Royal Society B
when they border a flowering crop, represent an Biological Sciences 282: 20142849.
important habitat for major pollinating insect Ball S & Morris R (2015) Britain's Hoverflies: A Field
groups. Guide, Revised and Updated Second Edition
(WILDGuides), Princeton, New Jersey.
Our findings therefore add additional impetus
Bond K, Gittings T (2008) Database of Irish Lepidoptera.
to the adoption of agri-environment schemes 1. Macrohabitats, microsites and traits of Noctuidae
where the protection and improvement of field and butterflies. Irish Wildlife Manuals, No. 35.
margins is used as a means of retaining and/ or National Parks and Wildlife Service, Department of the
enhancing farmland biodiversity. Although the Environment, Heritage and Local Government,
composition of the field margin pollinating insect Dublin, Ireland.
assemblage shifted in time, parallel to changes in Campbell AJ, Wilby A, Sutton P, Wäckers FL (2017) Do
the floral assemblage, in our system, insect sown flower strips boost wild pollinator abundance
abundance and diversity were not strongly related and pollination services in a spring-flowering crop? A
to floral abundance and diversity, at least at the case study from UK cider apple orchards. Agriculture,
Ecosystems and Environment 239:20–29.
physical scale of our study and using our
abundance and diversity metrics. Thus, any Carolan JC, Murray TE, Fitzpatrick Ú, Crossley J,
Schmidt H, Cederberg B, et al. (2012) Colour Patterns
assessment or scoring of sites based on field106 Darling & Barret J Poll Ecol 5(11)
Do Not Diagnose Species: Quantitative Evaluation of a Heller S, Joshi NK, Leslie T, et al (2019) Diversified floral
DNA Barcoded Cryptic Bumblebee Complex. PLoS resource plantings support bee communities after
ONE 7(1): e29251. [online] URL: apple bloom in commercial orchards. Scientific Reports
https://doi.org/10.1371/journal.pone.0029251 9:17232.
Clarke KR (1993) Non-parametric multivariate analyses Henderson P & Seaby R (2008). A Practical Handbook
of changes in community structure. Australian Journal for Multivariate Methods. January 2008. Pisces
of Ecology 18:117–143. Conservation Ltd, Great Britain.
Cole LJ, Brocklehurst S, Robertson D, et al (2017) IPBES (2016). The assessment report of the
Exploring the interactions between resource Intergovernmental Science-Policy Platform on
availability and the utilisation of semi-natural habitats Biodiversity and Ecosystem Services on pollinators,
by insect pollinators in an intensive agricultural pollination and food production. Potts SG, Imperatriz-
landscape. Agriculture, Ecosystems and Environment Fonseca VL, and Ngo HT (eds) Bonn, Germany.
246:157–167. Jauker F, Peter F, Wolters V, Diekötter T (2012) Early
Coudrain V, Rittiner S, Herzog F, et al (2016) Landscape reproductive benefits of mass-flowering crops to the
distribution of food and nesting sites affect larval diet solitary bee Osmia rufa outbalance post-flowering
and nest size, but not abundance of Osmia bicornis. disadvantages. Basic and Applied Ecology 13:268–276.
Insect Science 23:746–753. Kovács-Hostyánszki A, Batáry P, Báldi A (2011) Local
Curtis K, Bowie MH, Hodge S (2019) Can native and landscape effects on bee communities of
plantings encourage native and beneficial Hungarian winter cereal fields. Agricultural and Forest
invertebrates on Canterbury dairy farms? New Entomology 13:59–66.
Zealand Entomologist 42:67–78. Kovács-Hostyánszki A, Földesi R, Báldi A, et al (2019)
Day, MC (1991) Towards the conservation of aculeate The vulnerability of plant-pollinator communities to
Hymenoptera in Europe: an outline of the case for honeybee decline: A comparative network analysis in
recognition of the high value of Hymenoptera Aculeata different habitat types. Ecological Indicators 97:35–50.
as indicators of biotype integrity and diversity, with Larkin J, Sheridan H, Finn JA, et al (2019) Semi-natural
relevant examples and proposals for conservation habitats and Ecological Focus Areas on cereal, beef and
actions. Nature and Environment Series no. 45. Council dairy farms in Ireland. Land use policy 88:104096.
of Europe, Strasbourg.
Le Féon V, Schermann-Legionnet A, Delettre YR, et al
Dicks L V, Corbet SA, Pywell RF (2002) (2010) Intensification of agriculture, landscape
Compartmentalization in plant–insect flower visitor composition and wild bee communities: A large scale
webs. Journal of Animal Ecology 71:32–43. study in four European countries. Agriculture,
FAO Food and Agriculture Organisation (2018) Ecosystems and Environment 137:143–150.
fao.org/faostat 2018 data.[online] Marshall EJP, Moonen AC (2002) Field margins in
URL:http://www.fao.org/ northern Europe: their functions and interactions with
Fossitt J (2000) A Guide to Habitats in Ireland. The agriculture. Agriculture, Ecosystems and Environment
Heritage Council, Kilkenny, Ireland. 89:5–21.
Gathmann A, Tscharntke T (2002) Foraging ranges of O'Toole C. (1994). Who cares for the solitary bees? In: A.
solitary bees. Journal of Animal Ecology 71:757–764. Matheson (ed) Forage for bee in an agricultural
Ghazoul J (2005) Buzziness as usual? Questioning the landscape. International Bee Research Association,
global pollination crisis. Trends in Ecology and Cardiff, UK: pp 47-56.
Evolution 20 7:367–373. Ollerton J, Winfree R, & Tarrant S (2011) How many
Goulson D, Lye GC, Darvill B (2008) Decline and flowering plants are pollinated by animals? Oikos
conservation of bumble bees. The Annual Review of 120(3), 321–326.
Entomology 53:191–208. Osborne JL, Martin AP, Carreck NL, et al (2007)
Haaland C, Naisbit RE, Bersier L-F (2011) Sown Bumblebee flight distances in relation to the forage
wildflower strips for insect conservation: a review. landscape. Journal of Animal Ecology 77: 406–415.
Insect Conservation and Diversity 4:60–80. Papanikolaou AD, Kühn I, Frenzel M, Schweiger O
Hass AL, Kormann UG, Tscharntke T, et al (2018) (2017) Semi-natural habitats mitigate the effects of
Landscape configurational heterogeneity by small- temperature rise on wild bees. Journal of Applied
scale agriculture, not crop diversity, maintains Ecology 54:527–536.
pollinators and plant reproduction in western Europe. Perrot T, Gaba S, Roncoroni M, et al (2018) Bees increase
The Royal Society. Proceedings of the Royal Society B oilseed rape yield under real field conditions.
Biological Sciences 285: 20172242. Agriculture, Ecosystems and Environment 266:39–48.July 2011 Sit-and-wait pollination 107
Plantureux S, Peeters A, McCracken DI (2005) plants: implications for wild plant pollination. Plant
Biodiversity in intensive grasslands: effect of Ecology 215:315–325.
management, improvement and challenges. Stanley DA, Stout JC (2013) Quantifying the impacts of
Agronomy Research 3:153–164. bioenergy crops on pollinating insect abundance and
Potts SG, Woodcock BA, Roberts SPM, et al (2009) diversity: a field-scale evaluation reveals taxon-specific
Enhancing pollinator biodiversity in intensive responses. Journal of Applied Ecology 50:335–344.
grasslands. Journal of Applied Ecology 46:369–379. Sutherland JP, Sullivan MS, Poppy GM (2001)
Power EF, Stout JC (2011) Organic dairy farming: Distribution and abundance of aphidophagous
impacts on insect–flower interaction networks and hoverflies (Diptera: Syrphidae) in wildflower patches
pollination. Journal of Applied Ecology 48:561–569. and field margin habitats. Agricultural and Forest
Proesmans W, Smagghe G, Meeus I, et al (2019) The Entomology 3:57–64.
effect of mass-flowering orchards and semi-natural Tiedeken EJ, Stout JC (2015) Insect-flower interaction
habitat on bumblebee colony performance. Landscape network structure is resilient to a temporary pulse of
Ecology 34:1033–1044. floral resources from invasive Rhododendron ponticum.
Purvis EEN, Meehan ML, Lindo Z (2020) Agricultural PLoS One 10:1–19. [online] URL:
field margins provide food and nesting resources to https://doi.org/10.1371/journal.pone.0119733
bumble bees (Bombus spp., Hymenoptera: Apidae) in Timberlake TP, Vaughan IP, Memmott J (2019)
Southwestern Ontario, Canada. Insect Conservation Phenology of farmland floral resources reveals
and Diversity 13:219–228. seasonal gaps in nectar availability for bumblebees.
Rotenberry JT (1990) Variable floral phenology: Journal of Applied Ecology 56:1585–1596.
temporal resource heterogeneity and its implication for The Heritage Council (2010). Proposals for Ireland's
flower visitors. Holartic Ecology 13:1–10. landscapes. The Heritage Council, Reeners R, Dublin,
Sanchez JA, Carrasco A, La Spina M, et al (2019) How pp. 80.
bees respond differently to field margins of shrubby Volpato A, Ahmed KSD, Williams CD, et al (2020) Using
and herbaceous plants in intensive agricultural crops Malaise traps to assess aculeate Hymenoptera
of the Mediterranean area. Insects 11, 26:1–20. associated with farmland linear habitats across a range
Scheper J, Holzschuh A, Kuussaari M, et al (2013) of farming intensities. Insect Conservation and
Environmental factors driving the effectiveness of Diversity 13:229–238.
European agri-environmental measures in mitigating Walther-Hellwig K, Frankl R (2000) Foraging distances
pollinator loss – a meta-analysis. Ecology Letters of Bombus muscorum, Bombus lapidarius, and Bombus
16:912–920. terrestris (Hymenoptera, Apidae). Journal of Insect
Sheridan H, McMahon BJ, Carnus T, et al (2011) Pastoral Behavior 13:239–246.
farmland habitat diversity in south-east Ireland. Winfree R, Aguilar R, Vázquez DP, et al (2009) A meta-
Agriculture, Ecosystems and Environment 144:130– analysis of bees’ responses to anthropogenic
135. disturbance. Ecology 90:2068–2076.
Stanley DA, Gunning D, Stout JC (2013) Pollinators and Wix N, Reich M, Schaarschmidt F (2019) Butterfly
pollination of oilseed rape crops (Brassica napus L.) in richness and abundance in flower strips and field
Ireland: Ecological and economic incentives for margins: the role of local habitat quality and landscape
pollinator conservation. Journal of Insect Conservation context. Heliyon 5:e01636.
17:1181–1189 Wratten SD (1988) The role of field boundaries as
Stanley DA, Knight ME, Stout JC (2013) Ecological reservoirs of beneficial insects. In: Park JR (Ed.),
variation in response to mass-flowering oilseed rape Environmental Management in Agriculture: European
and surrounding landscape composition by members Perspectives. Belhaven Press, London, pp. 144–150.
of a cryptic bumblebee complex. PLoS One 8(6): Zurbuchen A, Cheesman S, Klaiber J, et al (2010) Long
e65516. [online] URL: foraging distances impose high costs on offspring
http://doi:10.1371/journal.pone.0065516 production in solitary bees. Journal of Animal Ecology
Stanley DA, Stout JC (2014) Pollinator sharing between 79:674–681.
mass-flowering oilseed rape and co-flowering wild
This work is licensed under a Creative Commons Attribution 3.0 License.You can also read


