Investor Presentation - REITworld: 2019 Annual Conference November 2019 - Park Hotels & Resorts

Page created by Virginia Rogers
 
CONTINUE READING
Investor Presentation - REITworld: 2019 Annual Conference November 2019 - Park Hotels & Resorts
Investor Presentation
                          REITworld: 2019 Annual Conference
                          November 2019

Waldorf Astoria Orlando            Le Méridien
                                   Hilton      San Francisco
                                          Chicago              Hilton Hawaiian Village Waikiki Beach Resort
Investor Presentation - REITworld: 2019 Annual Conference November 2019 - Park Hotels & Resorts
Mission
              To be the preeminent lodging REIT,
          focused on consistently delivering superior,
        risk-adjusted returns for stockholders through
     active asset management and a thoughtful external
         growth strategy, while maintaining a strong
                  and flexible balance sheet

2|
Investor Presentation - REITworld: 2019 Annual Conference November 2019 - Park Hotels & Resorts
Pillars of our Corporate Strategy

              Aggressive Asset Management
              ▪   Continually improve property level operating performance
              ▪   Consistently implement revenue management initiatives to optimize market pricing
                  and segment mix

             Prudent Capital Allocation
         ▪     Allocate capital effectively by leveraging scale, liquidity and M&A expertise to create
               value throughout all phases of the lodging cycle
         ▪     Employ an active capital recycling program—expanding our presence in target
               markets with a focus on brand and operator diversification, while reducing exposure
               to slower growth assets/markets
         ▪     Target value enhancement projects with strong unlevered ROI yields

         Strong and Flexible Balance Sheet
     ▪       Preserve a strong and flexible balance sheet, with a targeted leverage ratio of 3x to 5x
     ▪       Maintain liquidity across lodging cycle and access to multiple types of financing
     ▪       Aspire to achieve investment grade rating
3|

                                                                                                 Hilton Waikoloa Village
Investor Presentation - REITworld: 2019 Annual Conference November 2019 - Park Hotels & Resorts
Park’s Investment Thesis: Quality + Growth at a Discount

                                       ✓ Pro forma comp RevPAR on a TTM basis was $184
      High Quality
       Portfolio
                                       ✓ 2.4% forecasted weighted average supply exposure through
                                         2021 (50bps below peers)

                                       ✓ 2019E RevPAR growth 1.0% to 2.0% (20bps above peers)
          Sector
         Leading                       ✓ 2019 Group pace for combined Park & CHSP portfolio → 7%
      Fundamentals                     ✓ Margin growth has outpaced peers over the last two years:                                                        Hilton Bonnet Creek
                                         (~70bps in ’18; ~30bps in ’19)

                                        ✓ Capital recycling to further reduce leverage to low 4x
          Financial                     ✓ Fixed charge coverage ratio a healthy 4.4x
                                        ✓ $1.2B of liquidity available
                                        ✓ Well covered, above average dividend yield of 8.1%(1)

          ROI
      Opportunities
                                        ✓ $100M+ of attractive, value-add ROI projects in the pipeline                                                    Waldorf Astoria Orlando Golf Club
                                          with expected returns in excess of 15% to 20%

                                       ✓ Park trades at 11.0x ’20 EBITDA estimates, or a 1.6x multiple
       Discounted                        turn discount versus peers—the widest relative discount over
        Valuation                        the last 18 months; Park trades at a ~25% discount to Street
                                         NAV estimates

                                       ✓       Returned over $2.1B of capital since 2017; disposed of $750M
      Track Record                                                                                                                                        Hilton Checkers Los Angeles
                                               of non-core hotels over the last 18 months; outperformed
                                               peers by 100bps since Park’s spin-off
      Note: Peers include all publicly-traded, full-service hotel REITs with a market cap over $1 billion
 4|
      (1) Assumes the mid-point of our fourth quarter 2019 dividend range of between $0.50 - $0.60 per share; based on Park’s stock price as of 11/7/19
Investor Presentation - REITworld: 2019 Annual Conference November 2019 - Park Hotels & Resorts
Near Term Priorities For Park

       Execute on our Strategic Plan and create relative value for shareholders

     INTEGRATE              ◼   Complete a seamless integration of the Chesapeake acquisition
1    CHESAPEAKE
                            ◼   Realize the underwritten EBITDA synergies in the Chesapeake hotels; $8M in ’20
                            ◼   Remix the mix; Group up; ancillary revenue and cost savings opportunities

                            ◼   Continuing to sell approximately $550 million of non-core assets
     RECYCLE NON CORE              ◼ ~$300 million is currently under contract at gross multiples north of 16x
2
     HOTELS                 ◼   Actively marketing one legacy Park hotel and two non-core Chesapeake hotels with
                                gross proceeds likely to exceed $250 million

                            ◼   De-leveraging the balance sheet to 4x, with significant progress to be made over the
     DE-LEVER THE
3    BALANCE SHEET
                                next one or two quarters
                            ◼   Park’s pro-forma Net Debt to Adj. EBITDA is 4.4x; fixed charge coverage ratio of 4.4x

                            ◼   Evaluating and executing on stock buyback plan
4    STOCK BUYBACKS         ◼   Board previously authorized up to $300 million

     PROTECT THE
5                           ◼   Protecting the dividend, which currently stands at a very attractive 8%+ yield
     DIVIDEND

5|
Investor Presentation - REITworld: 2019 Annual Conference November 2019 - Park Hotels & Resorts
Park at a Glance
                                                                                                               (1)

            Hotels                                    Enterprise                             Adjusted EBITDA                                   Discount to                Dividend
                                                        Value                                   Multiple(1)                                      NAV(2)                   Yield(3)

             66                                   $9.6B                                        11.0 x                                            25%                      8.1%

    Hilton Waikoloa Village                                                 Parc 55 San Francisco - a Hilton Hotel                                 Hyatt Regency Boston

    Caribe Hilton                                                            Hilton New York Midtown                                               Hilton Chicago

      (1)   Based on 2020 consensus estimates
126 | (2) S&P Global Market Intelligence
      (3)   Assumes the mid-point of our fourth quarter 2019 dividend range of between $0.50 - $0.60 per share; based on Park’s stock price as of 11/7/19
Investor Presentation - REITworld: 2019 Annual Conference November 2019 - Park Hotels & Resorts
Iconic Portfolio: Urban and Resort Destinations

Hilton Hawaiian Village Waikiki Beach Resort                        Hilton San Francisco Union Square       Royal Palm South Beach Miami

Hilton Denver City Center             Le Meridian San Francisco

                                                                    Waldorf Astoria Orlando

JW Marriott SF Union Square          Hilton New Orleans Riverside

Hilton Chicago                       W Chicago – City Center        Casa Marina, a Waldorf Astoria Resort   New York Hilton Midtown

    7|
Investor Presentation - REITworld: 2019 Annual Conference November 2019 - Park Hotels & Resorts
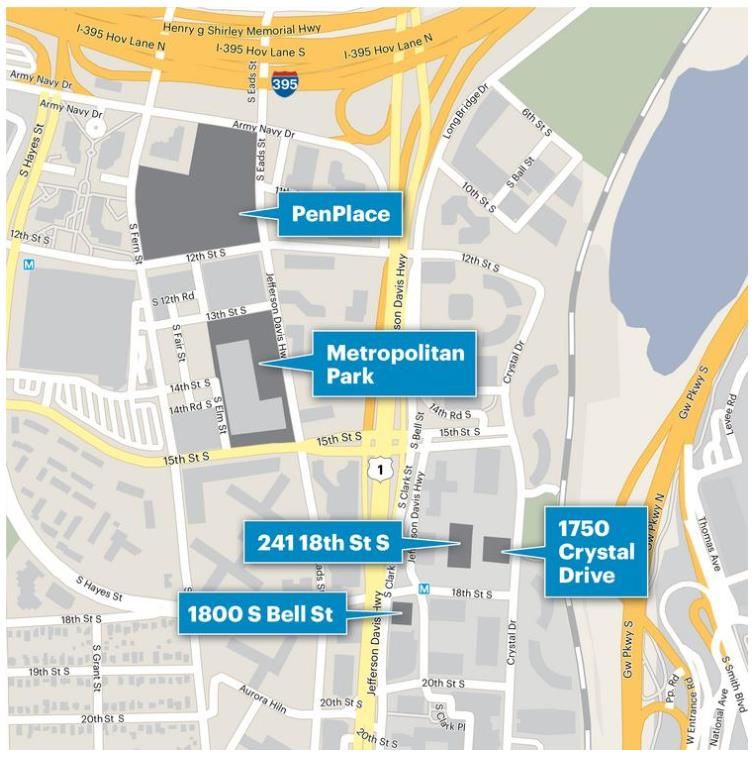
3Q19 Performance and 2019 Outlook
3Q19 Operating Results(1)

           1.9%                                    4.9%                                   20bps                                         20.7%      9.3%
           Comp                                   Comp                                Comp Hotel                                        Group      Increase
          RevPAR                                  Total                               Adj EBITDA                                       Revenues    in ‘Other
                                                 RevPAR                                 Margin                                                    Revenues’
2019 Outlook(2)
                                                           Metric                                                                   Guidance
                                  Comp RevPAR Growth:                                                                       +1.0% to +2.0%
                                  Comp EBITDA Margins:                                                                     -50bps to -20bps
                                  Adjusted EBITDA:                                                                          $768M to $788M

    (1)   Results for Park’s legacy portfolio only
8 | (2)   Guidance as of 11/6/19. Guidance includes results from Chesapeake’s assets for 4Q19 only. Not being updated or reconfirmed via this
          presentation
Investor Presentation - REITworld: 2019 Annual Conference November 2019 - Park Hotels & Resorts
Park Portfolio: Well Insulated from Supply
                                                                                              Supply Growth Exposure for Lodging REITs(1)
                                                                                    4.5%
          With outsized exposure to Oahu and                                                    3.9%        REIT Supply Growth Exposure to STR Top 25 Markets
          San Francisco, Park anticipates
                                                                                    4.0%

          2.4% average annual supply
                                                                                    3.5%
                                                                                                              2.9%           2.8%          2.8%          2.8%                    Peer Avg. 2.9%
                                                                                    3.0%                                                                           2.7%
          growth through 2021, or 50bps                                                                                                                                          2.4%       2.3%
                                                                                    2.5%
          lower than its peer group
                                                                                    2.0%

                                                                                    1.5%
                                                                                                RHP           SHO            DRH           PEB            XHR      HST           PK         BHR

Favorable Supply Picture for Park through 2021(1)
18.0%
          National Supply Growth Average: 2.0%
16.0%

14.0%

12.0%

10.0%

 8.0%
          6.0%       5.7%
 6.0%                          5.0%       4.7%
                                                     4.1%       4.0%
 4.0%                                                                      3.5%      3.3%       3.2%       3.0%       2.8%          2.5%    2.3%
                                                                                                                                                         1.9%   1.8%      1.7%     1.6%
 2.0%                                                                                                                                                                                       1.3%

 0.0%

                                      Supply Growth                     Pro forma PK 2018 EBITDA Contribution (%)                                  National Supply Growth
   Note: Charts presented above based on CBRE and Park estimates
   (1) Supply Growth data from CBRE’s Sep - Nov 2019 Hotel Horizons forecasts for Upper Priced hotels; represents average of 2020 and 2021 supply
9|     forecasts. Peer exposure calculated by weighted average market exposure by room count. Park’s Adjusted EBITDA represents 2018 data and includes
       pro rata share of unconsolidated JVs; pro forma for Park’s current portfolio, which includes the acquired Chesapeake portfolio
Investor Presentation - REITworld: 2019 Annual Conference November 2019 - Park Hotels & Resorts
Strategic Rationale for the Chesapeake Acquisition
                     Unique opportunity to acquire a high-quality, well-maintained portfolio
                          that is strategically consistent with Park’s existing platform

                                    ◼   Outsized organic growth profile positions the combined company for enhanced NAV growth
       UPSIDE OPPORTUNITY           ◼   Opportunity to aggressively asset manage the portfolio to drive higher margins
                                    ◼   Source attractive / accretive ROI opportunities, including meeting space expansions and additional keys

                                    ◼   CHSP: High RevPAR (2nd highest among peers) and high margin portfolio in outstanding condition
            QUALITY                 ◼   12 of CHSP’s 18 assets are represented in Park’s top 25 assets by 2018 RevPAR
                                    ◼   Well-maintained portfolio; CHSP reinvested ~$35k per key over the past 5 years

                                    ◼   Increased exposure to San Francisco, and penetration into key submarkets (Miami Beach, Downtown
          GEOGRAPHIC                    LA, Boston, San Diego & Denver)
           DIVERSITY                ◼   Reduces Park’s exposure to Hawaii from 24% to 20% of 2018 Hotel EBITDA

                                    ◼   Broadens Park’s brand mix, providing exposure to Marriott and Hyatt
       BRAND & OPERATOR
                                    ◼   Diversifies Park’s operator mix, adding exposure to 8 new operators, including Marriott, Hyatt and
           DIVERSITY                    other third party operators

                                    ◼   Combined portfolio includes 66 hotels in 17 states and D.C.
              SIZE                  ◼   Combined enterprise value of $9.6B, solidifying Park’s position as the 2nd largest lodging REIT
                                    ◼   Enhanced liquidity and potential cost of capital advantages

                                    ◼   Accretive to AFFO/share in ‘20 and beyond; expected to add 80 basis points to RevPAR growth in ‘20
            POSITIVE                ◼   RevPAR accretive
        FINANCIAL IMPACT            ◼   Post asset sales, Park maintains a well-capitalized and flexible balance sheet to support future growth

10 |
CHSP “Fill First” Strategy: Close RevPAR Gap w/Peers
                           Remixing the mix of demand in Chesapeake’s portfolio: Potential of $10M of upside in rooms revenue alone

                              86%

                              85%
                                                                                                          CHSP (1)                                           Narrowing the
                              84%
                                                                                                                                                          occupancy and ADR
                                                                                                             SHO
                                                                                                                  ~275bps Occupancy Gap                   gap in half (reducing
                              83%
                                                                                                                       ~$18 ADR Gap
                                                                                                                                                         exposure to low-rated
'18 Comparable Occupancy

                              82%                            PK                                                                                 PEB        transient business)
                                                                                                                                                          provides opportunity
                              81%
                                                                                                                                                         to improve RevPAR by
                              80%                                                        HST                                                             ~$4.50 (230bps+) and
                                                                                                                                                             increase rooms
                              79%                                                                                                DRH
                                                                                                                                                                 revenue
                              78%
                                 $205           $210           $215          $220           $225           $230           $235    $240   $245     $250
                                                                                         '18 Comparable ADR
                               (1) CHSP portfolio results exclude its two New York City hotels which sold in September 2019

▪                             Chesapeake pursued a “fill first” strategy with a focus on driving occupancy with lower-rated, discounted business

▪                             Accordingly, average occupancy was 85% in 2018 (highest in the sector), or 350bps higher than the full-service peers

▪                             Looking at its closest peer (Pebblebrook), comparable occupancy in Chesapeake’s portfolio was 275bps higher, while
                              comparable ADR was over $18 lower

▪ Strategy: Opportunity to drive rooms revenue higher by ‘remixing the mix’ – reducing exposure to lower
  rated transient business (occupancy), while driving ADRs higher: Revenue Upside = $8M to $10M over the
  next 2+ years
                       11 |
Asset Management 2.0: Rolling Out Initiatives Across
               Chesapeake’s Portfolio Expected to Yield Material Upside
                             2020 Underwriting: Potential ~$13M of Upside Embedded in the Chesapeake Portfolio
             $12.0
                                $10M
             $10.0                                                                                                   Oper.
                                  F&B Rev.                                                                           Exp.
                                                                                                            F&B
                                  Group Up                                                                 Profit.
              $8.0
EBITDA (M)

                                 Other Rev.
              $6.0                                                                                   Group Up

              $4.0                                                 $3M                               Other Rev.
                                                                                                                             Transient Mix

                                Transient Mix
                                                                    F&B Exp.
              $2.0                                              Mgmt Fees/Op Exp.
                                                                                                           Payroll Exp.
                                                                   Payroll Exp.
              $0.0
                                  Revenues                          Expenses

                               Projected Revenue Upside                                      Projected Expense Savings
                      Transient: “remix the mix”; reduce exposure to low-           Payroll: Cluster management positions with nearby
                      rated/discounted business; premium room types;                hotels; headcount reductions
                      Upsells (see Slide 23)
                                                                                    Operating Expenses: Cluster management positions
                      Other Revenue: Parking; Resort Fees; Retail leases            with nearby hotels; headcount reductions
                      Grouping Up: 150bps upside                                    Management Fees: Re-negotiate base and
                      Food & Beverage Revenue: Increase menu pricing;               incentive fee structures
                      catering revenue upside                                       Food & Beverage Expenses: Reduce beverage costs;
                                                                                    optimize hours of operation

             1612 |
Case Studies: Examples of Potential Asset Management
Opportunities in Chesapeake Portfolio
JW Marriott SF: +$2.0M                    Hyatt Regency Boston: +$1.7M                    Royal Palm South Beach: +$1.3M

           344             $13.6M                    502               $21.5M                         393               $17.4M
           Rooms          2018 EBITDA                Rooms           2018 EBITDA                      Rooms           2018 EBITDA

           $310             28.0%                    $232               40.6%                        $204                42.9%
     2018 RevPAR          2018 Margin            2018 RevPAR          2018 Margin                 2018 RevPAR          2018 Margin

▪      Transient: Increase ADR by 5% in   ▪   Transient: Increase transient ADR by 4%       ▪   Transient: Increase ADR by 3%, while
       a very strong market
                                                                                                reducing exposure to wholesale business
                                          ▪   Other Revenue: Increase ancillary income;
▪      Operating Expenses: Reduce             retail leasing opportunity                    ▪   Other Revenue: Increase ancillary
       sales and room operating
                                                                                                income; upsell opportunities
       expenses                           ▪   Operating Expenses: Reduce
                                              miscellaneous operating expenses; reduce      ▪   F&B Profit: Increase menu pricing;
▪      Group Up: Improve group                overall food costs                                optimize hours of operation
       production and group ADR
                                          ▪   Group Up: Opportunity to replace low          ▪   Operating Expense: Close spa for future
▪      F&B Expense: Reduce beverage           rated transient with additional group             ROI opportunity
       costs by 100bps

    13 |
Operational Excellence: Legacy PK Results
        Park’s asset management initiatives have contributed to meaningful results:

         Improved comparable                                        Improved comparable Hotel
       RevPAR 4.3%, or $8, from                                     Adjusted EBITDA margin 40
         the end of 2017 to TTM                                     bps to 29.1%, or 60 bps
            September 2019
                                                                     on an absolute basis,
                                                                    from the end of 2017 to TTM
                                                                          September 2019

         Increased Ancillary                                         Increased Group mix by
         Revenues 17.3%, or                                         220 bps to 31.7% from
        $31M, from the end of                                         the end of 2017 to TTM
       2017 to TTM September                                             September 2019
                2019

14 |
Closing the Margin Gap: 95bps+ in Park’s Legacy Portfolio
    Comp. Hotel Adj. EBITDA Margins(1): 2018 + 2019E Change

                                                                                                                95bps of Relative
                                                              80 bps
                                                                                                                 Improvement
                                                                          0 bps
                     Y/Y Change in Hotel Adj. EBITDA Margin

                                                              60 bps

                                                              40 bps

                                                                          60 bps
                                                              20 bps
                                                                                                                                                     -8 bps
                                                                 bps

                                                              -20 bps                                                                             -27 bps
                                                              -40 bps
                                                                           Park(2)                                                                 Peers(3)

                                                                                            2018A          2019YTD

•          Since 2018, Park’s aggressive asset management strategy has helped to narrow the margin gap with its peers by over
           110 basis points, yielding an estimated $30 million of incremental EBITDA over the last two years.

             •      2018: Park’s margins improved 60bps vs. a 21bps drop for its peers

             •      2019: Park’s margins are flat YTD (through 3Q19) vs. -27bps for its peers

•          Park expects to roll out a similar asset management ‘program’ across the recently acquired Chesapeake portfolio:
           Remixing the mix; grouping up; ancillary income; and expense controls
            (1)   See Appendix for our definitions and for reconciliations to comparable U.S. GAAP measures. Our definition of Hotel Adjusted EBITDA margin may not be comparable to similarly titled measures of our peers.
                  Based on most recently available / restated financial statements from their respective quarterly earnings releases
    15 |    (2)   Park’s hotels EBITDA performance for 2019 YTD, excludes Chesapeake
            (3)   Peers include HST, SHO, DRH, PEB, XHR and RHP
Park Then and Now: New & Improved, Higher Quality and
Better Metrics
               Since the spin-off, Park’s portfolio has been redefined into a higher-quality, more
                                           profitable portfolio of assets

                                                                                                              Hotel Adjusted                              Hotel Adj.     Hotel Adj
                                        Rooms                                  RevPAR
                                                                                                                 EBITDA                                  EBITDA/key    EBITDA Margin

 Today:                                 35K                                 $184(1)                            $908M(1)                                $30.1K(1)        29.6%(1)

    2016:(2)                               35K                                 $161                                   $750M                                 $24.7K        27.7%

                                                                                                                                                                         +190
Change:                                 NM                                   +14%                                  +19%                                     +22%
                                                                                                                                                                          bps
         (1)    Pro forma comparable portfolio (including Chesapeake’s 18-hotel portfolio acquired by Park in September 2019); presented on a trailing twelve-
1216 |          month basis as of 9/30/19
         (2)    Reflects Park on a carve-out basis prior to spin-off from Hilton Worldwide; includes pro forma adjustments related to the spin-off for incremental
                fees based on the terms of the post spin-off management agreements and estimated non-income taxes on certain REIT leases
CHSP: Newly Renovated Portfolio

                                                           Hyatt Centric Fisherman’s Wharf

Royal Palm South Beach Miami, a Tribute Portfolio Resort                                              Hyatt Regency Boston

                                                           JW Marriott San Francisco Union Square

                                                           Hyatt Regency Mission Bay Spa and Marina   W Chicago City Center
W New Orleans

                                                           Hotel Indigo San Diego-Gaslamp Quarter

Le Méridien San Francisco                                                                             Hotel Adagio, Autograph Collection

    17 |
                                                           Hilton Denver City Center
Diversification: Park Operating Portfolio

                                                                                                                                                                                                                    PF 2018 Hotel EBITDA(1)

                                                                                                                                                                                    West Coast/HI                           50%

                                                                                                                                                                                    Florida                                 17%

                                                                                                                                                                                    Northeast                               15%

                                                                                                                                                                                    Other                                   18%

                                                                                                                                                                                                                Legend
                                                                                                                                                                                                  Circle Size Based on Hotel EBITDA

                                                                                                                                                                                                                              $200M+
                                                                                                                                                                                                                              $100M+
                                                                                                                                                                                                                              $50M+
                                                                                                                                                                                                                              $25M+
                                                                                                                                                                                                                              $10M+
                                                                                                                                                                                                                              $5–10M
Diversification: Brand, Operator and Asset Type
                           Acquisition advances Park’s brand strategy, providing exposure to Marriott and Hyatt

     Geographic Diversification                                                        Diversified Operator Pool                                                        Expanded Brand Exposure
                     Suburban
                                                                                                  HEI Aimbridge Self-Operated                                                                Hyatt Other
                        8%                                                                  Other 2%     2%           2%                                                                      4%    1%
                                                                                      Hyatt  4%                                                                                   Marriott
    Airport                                                                            3%                                                                                          11%
     15%
                                                                                   Marriott
                                                                                     6%

                              New PK                                                                            New PK                                                                       New PK

         Resort                                                     Urban
          26%                                                        51%                                                                                                                                            Hilton
                                                                                                                                               Hilton                                                                84%
                                                                                                                                                81%

                             Legacy PK                                                                         Legacy PK                                                                     Legacy PK
          Suburban                                                                                Self-
             8%                                                                                 Operated
     Airport                                                                                       2%
      18%
                                                                  Urban
                                                                   45%

            Resort                                                                                                                         Hilton                                                          Hilton
             29%                                                                                                                            98%                                                            100%

            Note: Based on the total number of guestrooms (consolidated + Unconsolidated JVs at share) of the Pro forma combined company
1619 |      Note: Other Brands include IHG and Ace. Other Operators include TPG Hospitality, Crestline Hotels & Resorts, IHG and Ace Hotel Group
            (1) Pro forma Park owns 51 Hilton branded hotels, 10 Marriott branded hotels, 3 Hyatt branded hotels, 1 IHG branded hotel and 1 Ace branded hotel. In November 2019, Park
                  entered into an agreement to sell the Ace branded and managed hotel, with the closing of such transaction being subject to customary closing conditions
Size & Scale: Nearly 3x the Size of the Average Lodging REIT(1)

                                    Park solidified its position as the 2nd largest publicly traded Lodging REIT

                 ENTERPRISE VALUE: PRO FORMA PK vs. HOTEL REITS                                                                                                $16.7B

                           Full Service

                           Mixed & Limited Service

                                                                                                                                                       $9.6B

                                                                                                                                               $7.2B
                                                                                                                                       $6.2B
                                                                                                                               $5.2B
                                                                                                               $4.9B   $4.9B

                                                                                      $3.5B            $3.6B
                                                                      $3.2B
                                      $2.3B           $2.3B
       $1.4B          $1.6B

        BHR            CLDT             INN              HT             DRH             XHR             SHO     AHT     RLJ    APLE     PEB     RHP      PK     HST

       Source: Public company filings as of 2Q19 and FactSet. Market data as of 11/7/19
20 |   (1) Average Lodging REIT Total Enterprise Value equates to $4.1 billion, which excludes HST and PK
Park’s Active Capital Recycling: Then and Now
                                                                                                                                                   Hotel Adj
                                       Hotels                                Rooms
                                                                                                                 (1)
                                                                                                                   EBITDA     RevPAR               EBITDA
                                                                                                                                                    Margin

   Hotels
 Acquired(1)                             18                                 5.9K                             $181M            $193                32.3%
       Hotels
       Sold(2)                            18                                 5.0K                                  $64M        $109                    25.1%

                                                                                      2018:
                                                                                      •     13 hotels sold for $519M, including 10 international assets
                                                                                      •     Improved 2018 Pro forma Comparable Portfolio RevPAR by ~$6

                                                                                      2019 YTD:
                                                                                      •     5 hotels sold for $235M, including 1 international asset
                                                                                      •     Improved 2019 YTD Pro forma Comparable Portfolio RevPAR by ~$5
                                                                                      •     18 hotels added to portfolio as part of $2.5B Chesapeake
                                                                                            acquisition
                                                                                      •     Improved YTD 2019 Pro forma Comparable Portfolio RevPAR by ~$4
    Hilton Berlin: sold in 2018 for ~20x 2017 EBITDA multiple

1221 | (1) Reflects Chesapeake’s 2018 operating results
       (2)   Reflects Park’s pro-rata share of ownership; operating results reflects performance year prior to dispositions
Potential to unlock embedded value. Target 15-20% IRR
Completed/In-Process Projects
Hotel                                         Investment                                           Scope                                          Timing

                                                             Converted and repositioned from a DoubleTree, driving significant ADR premiums;     Completed
Hilton Santa Barbara Beachfront Resort         $14M                                  Results
                                                             $5M of incremental EBITDA                                                            Q2 2018

                                                             Renovate and reposition the Waldorf Astoria to a Curio to better position hotel
Curio Reach Resort                             $10M                                                                                              Q4 2019
                                                             relative to its sister property as well as to the asset

                                                             Addition of ~70k sf meeting space and repositioning / upbranding of the Hilton to
Waldorf Astoria/Hilton Bonnet Creek            $85M                                                                                                2021
                                                             Signia Hilton

Future Potential Projects
                                                                                                                     $10M Curio Reach Reno
Hotel                                                   Scope

DoubleTree Washington        Capitalize on hotel’s location adjacent to Amazon’s HQ2
DC – Crystal City            campus with renovation / rebranding
                             Take advantage of the strong tech employment base in San
DoubleTree Hotel San         Jose, and upbrand hotel to a Hilton to further drive the group
Jose                         mix given the 47,000sf, renovated platform; major Google
                             expansion nearby
                             Master planning of the campus (branding; retail; amenities)
Hilton Hawaiian Village
                             including development of ½-acre Ala Moana parcel
Hilton New Orleans           Development and/or sale of 7-acre ‘Whale’ lot and other
Riverside                    parcel as well as 2-acre surface lot parking area
                             Evaluate portfolio of 18 hotels for redevelopment /
Chesapeake Portfolio
                             repositioning opportunities

   22 |
Completed ROI Project: Hilton Santa Barbara Beachfront Resort

       Conversion from a DoubleTree to a Hilton helps capitalize on prime location and amenities
⚫ 360-room beachfront resort on 24 acres in Santa Barbara, CA
⚫ Prime location in Santa Ynez wine country with in-house winery
⚫ Upbranding to a Hilton helped attract higher-rated group business and better
   yielded transient business
⚫ $14M renovation cost(1) ($38,000/key) completed in April 2018
⚫ Yielding impressive results: 2019 RevPAR growth projected at 18.6%;
   runs one of the highest EBITDA margins in the portfolio
Scope
         ⚫ Guestrooms: case goods; soft goods
         ⚫ Guest bathrooms: conversion of 160 bathtubs to walk-in showers; case goods, soft
             goods
         ⚫ Public space: lobby; meeting space (mainly soft goods); and repositioning of F&B to
             include new Grab ‘N Go
Old lobby:                                                                                                  Renovated lobby:

23 |   (1) Park owns a 50% interest in the Hilton Santa Barbara Beachfront Resort; as such its pro-rata investment in the renovation was $7M
Future ROI Project: Bonnet Creek Conversion

 Opportunity: Additional Meeting Space and Brand Conversion
⚫ Group meeting business is a key demand source for the 1,009-room
  Hilton and 502-room Waldorf Astoria Bonnet Creek, yet both
  properties offer less meeting space per guestroom than their key
  competitors
⚫ Current plans call for ~70,000 sq. ft. of additional meeting space
  across 2 new meeting space platforms including:
       ⚫ ~35,000 sq. ft. ballroom adjacent to existing Hilton
         meeting space complex
       ⚫ ~9,000 sq. ft. ballroom adjacent to the Waldorf
⚫ Approximately $85M investment in 2019-2021 expected to generate
  approximately $13.5M of additional EBITDA/year once stabilized,
  yielding a projected 5-yr unlevered IRR of 15% to 20%
⚫ Upbrand the Hilton Bonnet Creek to Signia Hilton brand projected
  for 2021

                                                                       Proposed Hilton Ballroom
                                                                          and meeting space

                                                                                  Proposed Waldorf Ballroom

24 |
Amazon Expected to Concentrate Around Park’s DoubleTree
           DoubleTree Crystal City located directly across the street from 4.1M SF Amazon cluster
                                                                  •   As part of its HQ2 expansion into Crystal City
                                                                      (Arlington, VA), Amazon has entitlements in place
                                                                      for up to 2.1 million square feet of development
                                        627-room DoubleTree           at PenPlace, directly adjacent to our Doubletree
                                                                      Crystal City hotel.
                                                                  •   Park is currently evaluating strategic options for
                                                                      the 627-room hotel, including:
                                                                         •   Renovating and repositioning asset to
                                                                             cater to Amazon clientele (reconfigure mix
                                                                             of rooms, redesign ancillary facilities,
                                                                             reposition F&B offerings, etc.)
                                                                         •   Upbranding within the Hilton family of
                                                                             brands

  The Amazon Effect:                                                  $180
                                                                      $160
                                                                                         Annual RevPAR(1)
                                                                      $140
  •        Seattle CBD Tract RevPAR recorded 7.6% CAGR from           $120
           2010 – 2017, coinciding with development of Amazon’s       $100
                                                                       $80
           headquarters campus
  •        The Arlington, VA Tract RevPAR CAGR during same
           time period was just 0.8%                                                     Seattle CBD   Arlington

25 | (1)   Tract data provided by STR
Proactive Deleveraging Plan

                                                     Park Plans To Reduce Leverage By Selling $550M+ of Assets Over the Next ~6 Months

                                             The Chesapeake acquisition increased Park’s Net Debt to Adjusted EBITDA(1) ratio to 4.4x from 3.8x as of 2Q19
                                             Phase II Sales: Approximately $550M+ of non-core hotel sales over the next ~6 months with net proceeds used to pay
                                             down debt; Pro forma Net Debt to Adjusted EBITDA would fall to just 4.2x, or 0.2x below peer group average
                                             Since spinning off from Hilton, Park has preserved a strong and flexible balance sheet within its targeted leverage ratio
                                             of 3x to 5x

                                                                                                              Pro Forma Park Leverage vs. Peers

                                             10.0x

                                              9.0x
                                                                                                                                              Post $550M of Non-Core
         Net Debt + Preferred / TTM EBITDA

                                              8.0x                                                                                                  Asset Sales
                                              7.0x

                                              6.0x

                                              5.0x                                Peer Average ex-PK: 4.4x
                                                                                                                                                                                       9.1x
                                              4.0x

                                              3.0x                                                                                                                              5.7x
                                                                                                                                                                         5.2x
                                              2.0x                                                                                 4.2x              4.4x         4.4x
                                                                                                           3.5x
                                              1.0x                                 2.3x
                                                            1.4x
                                              0.0x
                                                           SHO                     HST                     XHR             PK Pro-Forma(1)           DRH           PK    RHP    PEB    BHR

2326 |                           (1) PK Pro-Forma assumes the sale of six, non-core hotels for total gross proceeds of approximately $550 million
                                 Source: FactSet and SNL Market Intelligence
Post Transaction Balance Sheet & Credit Metrics
                  Post Transaction Capital Structure(1)                                                                        Post Transaction Position Highlights

                                                                                            Secured Debt
                                                                                                                                •       50 unencumbered hotels, or 70% of Total Rooms
                                                                                            Unsecured Debt
                                                                                            U–JV Debt
                                                                                                                                •       Post-acquisition WACD at 3.9%, down ~ 20bps from
                                                                                            Equity                                      4.1% at beginning of year
                                       Total Capitalization                                                                     •       Undrawn $1 billion revolving credit facility
                                             $10.3 B
                                                                                                                                •       63% Fixed Debt vs. 37% Floating Debt(2)

                                                                                                                                •       63% Secured Debt vs. 37% Unsecured Debt(2)

                                                                                                                                •       Pro-forma fixed charge coverage ratio of 4.4x

                                                                      Post-Transaction Debt Maturity Schedule(3)
                           $ 1,8 0 0
                           $ 1,6 0 0                                                                                                weighted avg. maturity: 4.9 years
                           $ 1,4 0 0
                           $ 1,20 0                                                       $ 1,0 0 0
                           $ 1,0 0 0
                             $800                                                                                                                                                                       $ 1,58 2
                             $600
                             $400                                                          $ 750                                       $ 8 32                $ 8 50
                              $200                                                                                $91
                                                                       $ 12
                                 $-                                                                                                                                                 $-
                                                                                                                         (4)
                                                20 19                20 20                 20 21                 20 22                 20 23                 20 24                 20 25                20 26 +

                                                                           Secur ed Pr oper ty M or tgages                Unsecur ed T erm Loans               Revol ver

       (1)   Debt balances and equity capitalization (based on market pricing of equity) reflected as of 9/30/19; includes $321 million of cash & cash equivalents
       (2)   Includes Park’s 2023 convertible notes, capital leases, pro-rata share of unconsolidated joint venture debt and $225 million interest rate swap which terminates in April 2022 and fixes one-month Libor at 1.86%
       (3)   Excludes pro-rata share of Park’s unconsolidated joint venture debt, unamortized deferred financing costs, fair value adjustments to reflect carrying value of Chesapeake mortgage loans and scheduled amortization
       (4)   Reflects prepayment of Hilton Denver City Center mortgage on the “At Par” date of 8/1/2022 stated in the loan agreement, which is before the stated maturity in 8/1/2042

27 |
Attractive, Well Covered Dividend
       Park’s Quarterly Dividends and Respective Yield(1)                                                                                              Peer REITs: Current Dividend Yield(2)

                       $0.80                                                                                     9.0%                                                   9.0%
                                                                                                                                                                               8.3%
                       $0.70                                                                                     8.0%
                                                                                                                                                                        8.0%
                                                                                                                 7.0%

                                                                                                                                            Annualized Dividend Yield
                       $0.60
Quarterly Dividend

                                                                                $0.27                                                                                                 6.8%

                                                                                                                        Dividend Yield
                                                                                                                 6.0%                                                   7.0%   7.5%
                       $0.50                          $0.12                                              $0.10
                                                                                                                 5.0%                                                                        5.8%
                       $0.40                                                                                                                                            6.0%
                                                                                                                 4.0%                                                                               5.1%   5.0%
                       $0.30                                                                                                                                            5.0%                                      4.9%      4.8%
                                                                                        $0.45 Per Share          3.0%                                                                                                                  4.2%
                       $0.20                     $0.43 Per Share                                                 2.0%                                                   4.0%
                       $0.10                                                                                     1.0%
                                                                                                                                                                        3.0%
                       $0.00                                                                                     0.0%
                                                                                                                                                                        2.0%
                                                                                                                                                                               PK     BHR    PEB    XHR    SHO    DRH       HST        RHP

     Source: FactSet                                                                                                                     Source: FactSet

        Dividend and Payout Ratio Analysis
          ⚫ Park paid a third quarter 2019 cash dividend of $0.45/share on October 15th to stockholders of record as of September 30, 2019.

          ⚫ Expect to distribute between $0.50 - $0.60 for our fourth quarter dividend, which includes our normal top off fourth quarter
            payment ($0.05 - $0.15) and within our stated range of 65% to 75% of Adjusted FFO/share
          ⚫ Including the impact of the fourth quarter ‘step-up’ dividend, Park’s dividend yield is currently 8.3%, or 290 basis points higher
            than its full-service REIT peers.

                     Park has paid a total of $8.72/share in cash + stock dividends in less than three years, totaling $2.1B

                            (1)   4Q 2017 dividend includes a $0.12 per share ‘top-off’, which translated into an AFFO payout ratio of 67.5%. 4Q 2018 dividend includes a $0.27 per share ‘top-off’ amount and a $0.30 per share component
                                  related to additional gains from 2018 asset sales, which translated into an AFFO payout ratio of 67.2%. Yield excludes both the $0.45 per share special dividend announced on 5/18/18 and the $0.30 per share
                                  component included in the 4Q 2018 dividend. 4Q 2019 dividend includes an estimated $0.10 per share ‘top-off’, which translates into an AFFO payout ratio of 67.5%, or the mid-point of our guidance.
                            (2)   Based on 11/1/19 closing prices; For PK, the 7.6% yield assumes a quarterly dividend run-rate of $0.45/share, or $1.80 on an annualized basis, while the 8.0% yield includes the 4Q 2019 incremental top-off
                                  dividend of $0.65/share at the midpoint of our guidance range, or $1.99/share on an annualized basis
                     28 |
ESG: Corporate Responsibility
       Public Disclosure of Materials
                                                                                                            FY 2018 Performance Highlights(1):
•     Park issued its first Annual Corporate
      Responsibility Report in Jan ‘19; the                                                                        Hotel Portfolio:
      second report was published Sep ‘19
                                                                                                                                 9.79                               18                      100%
•     Park’s “Responsibility” webpage launched                                                                            Greenhouse Gas                        TripAdvisor            Portfolio ISO
      Jan ’19 with ESG-related data and case studies                                                                          Emission                         Green Leaders         14001, 9001 and
                                                                                                                          Intensity (kg/sf)                        Hotels             50001 Certified
•     Added GRI Index to 2019
      Annual Corporate
      Responsibility Report for                                                                                               ~$1.0M                              26%                      10.4M
      enhanced ESG reporting                                                                                                Investment in                                                Total Annualized
      and disclosure                                                                                                       Energy Efficiency
                                                                                                                                                                   Waste
                                                                                                                                                                                         Water Reduction
                                                                                                                                                               Diversion Rate
                                                                                                                               Projects                                                     in Gallons

    Accomplishments & Recognitions                                                                                 Corporate HQ:
•     Favorable ISS
      Disclosure Scores                                                                                                        $270k                              90%                       400+
      indicate higher quality
      disclosure and                                                                                                         Charitable                          Associate                  Volunteer
                                                                                                                            Contributions                       Satisfaction                  hours
      transparency practices(2):
           •     Environmental: 3/10
           •     Social: 2/10
           •     Governance: 1/10
•     2019 GRESB Public
      Disclosure Score: A                                                                                                                                      Hilton Waikoloa Village

     (1)   Represents Park’s portfolio as of 12/31/18, which consisted of 54 hotels with over 32,000 rooms
29 | (2)   ISS disclosure scores based on a scale of 1 to 10, with 1 representing higher quality disclosure and transparency practices. Scores as of 11/1/19
     (3)   GRESB Public Disclosure Score relative to lodging REIT peer group; score as of 9/4/19
Park Team

                                                                    Chairman, President
                                                                          & CEO
                                                                       Tom Baltimore

Executive Management
       EVP, CFO &                                         EVP, GC                                                                   EVP, Asset
                                      EVP, D&C                                         EVP, HR             EVP, CIO
        Treasurer                                                                                                                  Management
                                      Carl Mayfield      Tom Morey                     Jill Olander        Matt Sparks
       Sean Dell’Orto                                                                                                              Rob Tanenbaum

Senior Management

                        SVP, FP&A                     SVP, CAO                             SVP, Strategy                 SVP, Tax
                        Diem Larsen                   Darren Robb                           Ian Weissman                 Scott Winer

Park Management                                                            Board of Directors
➢ 25 years average experience among senior                                 ➢ Best-in-class board including former CEOs and
  leadership                                                                 CFOs of Fortune 500 Companies
➢ Total of ~90 employees at Park Headquarters                              ➢ Significant REIT experience across industries

30 |
Appendix

                  Hilton Chicago

31 |
Guidance

  2019 Guidance and Assumptions

                                    (unaudited, dollars in millions, except per share amounts and Comparable RevPAR)

                                                                                                                                                               2019 Outlook
                                                                                                                                                         as of November 6, 2019
                                    Metric                                                                                                               Low              High
                                    Comparable RevPAR Growth(1)                                                                                            1.0%            2.0%
                                    Comparable RevPAR(1)                                                                                               $    181      $      183

                                    Net income                                                                                                         $       264     $     284
                                    Net income attributable to stockholders                                                                            $       254     $     274
                                    Diluted earnings per share                                                                                         $      1.19     $    1.29

                                    Adjusted EBITDA                                                                                                    $       768      $    788
                                    Comparable Hotel Adjusted EBITDA margin change (1)                                                                         (50) bps      (20) bps
                                    Adjusted FFO per share - Diluted(2)                                                                                $      2.80      $   2.90
                                    ___________________
                                    (1)
                                            Includes operating results for the 18 Chesapeake hotels for the fourth quarter only.
                                    (2)
                                            Per share amounts are calculated based on unrounded numbers.

               •        Net income, EBITDA and FFO includes projected Chesapeake results from the date of acquisition through the remainder of 2019;
               •        General and administrative expenses are projected to be $43 million, excluding $65 million of acquisition costs, $16 million of non-cash share-based
                        compensation expense, $4 million of disposition costs and $1 million of severance expense;
               •        Fully diluted weighted average shares are expected to be 212.7 million;
               •        Comparable RevPAR for the fourth quarter of 2019 is expected to be flat compared to the fourth quarter of 2018;
               •        Includes $8 million of Adjusted EBITDA from the Caribe Hilton representing a partial year of operations, for which Park expects to be covered by
                        business interruption insurance resulting from the hotel being closed for a portion of 2019 following the damage caused by Hurricane Maria; and
               •        Does not take into account potential future acquisitions and dispositions, including those currently under contract, which could result in a material
                        change to Park’s outlook.

32 | NOTE: Guidance as of 11/6/19. Guidance includes results from Chesapeake’s assets for 4Q19 only. Not being updated or reconfirmed via this presentation
Guidance (continued)

  EBITDA and Adjusted EBITDA
                                                                                                                                                                                                                                                                                                                                                                                                                                                                                                                                       Year Ending
                                                                                                                                                       (unaudited, in millions)                                                                                                                                                                                                                                                                                                                                                  Decem ber 31, 2019
                                                                                                                                                                                                                                                                                                                                                                                                                                                                                                                           Low Case                   High Case
                                                                                                                                                       Net income                                                                                                                                                                                                                                                                                                                                                     $                264        $                  284
                                                                                                                                                         Depreciation and amortization expense                                                                                                                                                                                                                                                                                                                                         263                           263
                                                                                                                                                         Interest income                                                                                                                                                                                                                                                                                                                                                                (6)                           (6)
                                                                                                                                                         Interest expense                                                                                                                                                                                                                                                                                                                                                              141                           141
                                                                                                                                                         Income tax expense                                                                                                                                                                                                                                                                                                                                                             13                            13
                                                                                                                                                         Interest expense, income tax and depreciation and amortization included in
                                                                                                                                                         equity                                                                                                                                                                                                                                                                                                                                                                         23                            23
                                                                                                                                                            in earnings from investments in affiliates
                                                                                                                                                       EBITDA                                                                                                                                                                                                                                                                                                                                                                          698                           718
                                                                                                                                                         Gain on sale of assets, net                                                                                                                                                                                                                                                                                                                                                   (20)                          (20)
                                                                                                                                                         Acquisition costs                                                                                                                                                                                                                                                                                                                                                              65                            65
                                                                                                                                                         Severance expense                                                                                                                                                                                                                                                                                                                                                               2                             2
                                                                                                                                                         Share-based compensation expense                                                                                                                                                                                                                                                                                                                                               16                            16
                                                                                                                                                         Casualty loss and impairment loss, net                                                                                                                                                                                                                                                                                                                                          8                             8
                                                                                                                                                         Other items                                                                                                                                                                                                                                                                                                                                                                    (1)                           (1)
                                                                                                                                                       Adjusted EBITDA                                                                                                                                                                                                                                                                                                                                                $                768        $                  788

       NAREIT FFO and Adjusted FFO
                                                                                                                                                                                                                                                                                                                                                                                                                                                                                                                                     Year Ending
                                                                                                                                                                                                        (unaudited, in millions except per share data)                                                                                                                                                                                                                                                                         Decem ber 31, 2019
                                                                                                                                                                                                                                                                                                                                                                                                                                                                                                                          Low Case                High Case
                                                                                                                                                                                                        Net income attributable to stockholders                                                                                                                                                                                                                                                                   $                  254      $               274
                                                                                                                                                                                                          Depreciation and amortization expense                                                                                                                                                                                                                                                                                      263                      263
                                                                                                                                                                                                          Depreciation and amortization expense attributable to
                                                                                                                                                                                                              noncontrolling interests                                                                                                                                                                                                                                                                                                (4)                      (4)
                                                                                                                                                                                                          Gain on sale of assets, net                                                                                                                                                                                                                                                                                                (20)                     (20)
                                                                                                                                                                                                          Equity investment adjustments:
                                                                                                                                                                                                              Equity in earnings from investments in affiliates
                  Guidance (continued) EBITDA and Adjusted EBITDA Year Ending (unaudited, in millions) December 31, 2019 Low Case High Case Net income $ 294 $ 323 Depreciation and amortization expense 278 278 Interest income (8) (8) Interest expense 130 130 Income tax expense 13 14 Interest expense, income tax and depreciation and amortization included in equity in earnings from investments in affiliates 23 23 EBITDA 727 757 Share-based compensation expense 15 15 Adjusted EBITDA $ 745 $ 775
                                                                                                                                                                                                                                                                                                                                                                                                                                                                                                                                     (20)                     (21)
                                                                                                                                                                                                              Pro rata FFO of equity investments                                                                                                                                                                                                                                                                                      33                       34
                                                                                                                                                                                                        Nareit FFO attributable to stockholders                                                                                                                                                                                                                                                                                      506                      526
                                                                                                                                                                                                          Acquisition costs                                                                                                                                                                                                                                                                                                           65                       65
                                                                                                                                                                                                          Severance expense                                                                                                                                                                                                                                                                                                            2                        2
                                                                                                                                                                                                          Share-based compensation expense                                                                                                                                                                                                                                                                                            16                       16
                                                                                                                                                                                                          Casualty loss, net                                                                                                                                                                                                                                                                                                           7                        7
                                                                                                                                                                                                        Adjusted FFO attributable to stockholders                                                                                                                                                                                                                                                                 $                  596      $               616
                                                                                                                                                                                                        Adjusted FFO per share - Diluted (1)                                                                                                                                                                                                                                                                      $              2.80         $           2.90
                                                                                                                                                                                                        Weighted average diluted shares outstanding                                                                                                                                                                                                                                                                             212.7                    212.7
        (1)
33 |          Per share amounts are calculated based on unrounded numbers.
Non-GAAP Financial Measures

   Historical Pro-forma Comparable Hotel Metrics

         The financial information below is for the 57 comparable hotels owned as of September 30, 2019 (1).

                                                                                                                    Three Months Ended                                    TTM (2)         Full Year
             (unaudited)                                                               December 31,             March 31,              June 30,       September 30,   September 30,     December 31,
                                                                                            2018                  2019                   2019             2019            2019              2018
             Pro-forma Comparable RevPAR                                                       $176.41               $178.48               $195.03          $187.70          $184.41         $182.10
             Pro-forma Comparable Occupancy                                                     80.1%                 79.2%                 87.0%            84.9%            82.8%           82.7%
             Pro-forma Comparable ADR                                                          $220.25               $225.39               $224.30          $221.17          $222.76         $220.28

             Pro-forma Comparable Hotel Revenues (in millions)                                   $747                   $746                  $816             $759            $3,068         $3,001
             Pro-forma Comparable Hotel Adjusted EBITDA (in millions)                            $215                   $213                  $261             $219              $908           $892
             Pro-forma Comparable Hotel Adjusted EBITDA margin                                  28.8%                  28.6%                 32.0%            28.8%            29.6%          29.7%

                                                                                                                    Three Months Ended                                    TTM (2)         Full Year
             (unaudited)                                                               December 31,             March 31,              June 30,       September 30,   September 30,     December 31,
                                                                                            2017                  2018                   2018             2018            2018              2017
             Pro-forma Comparable RevPAR                                                       $171.09               $171.73               $194.45          $185.71          $180.76         $176.86
             Pro-forma Comparable Occupancy                                                     79.6%                 79.3%                 86.4%            84.9%            82.5%           82.0%
             Pro-forma Comparable ADR                                                          $215.00               $216.61               $225.00          $218.90          $219.00         $215.56

             Pro-forma Comparable Hotel Revenues (in millions)                                   $722                   $713                  $810             $731            $2,976         $2,928
             Pro-forma Comparable Hotel Adjusted EBITDA (in millions)                            $206                   $198                  $267             $212              $883           $856
             Pro-forma Comparable Hotel Adjusted EBITDA margin                                  28.5%                  27.8%                 32.9%            29.0%            29.7%          29.2%

       (1)                   Includes results from the 18 hotels acquired from Chesapeake as if the acquisition had taken place on January 1, 2018.
       (2)                   Trailing Twelve Months (“TTM”).

34 |
Non-GAAP Financial Measures (continued)

  Historical Pro-forma Comparable Hotel Adjusted EBITDA – 2019 TTM
  The financial information below is for the 57 comparable hotels owned as of September 30, 2019.

                                                                                                               Three Months Ended                                              TTM                   Full Year
         (unaudited, dollars in millions)                                           Decem ber 31,         March 31,              June 30,              Septem ber 30,     Septem ber 30,         Decem ber 31,
                                                                                        2018                2019                  2019                     2019                2019                    2018
         Net income                                                             $               55    $                97    $               84    $                 9    $           245        $            477
            Depreciation and amortization expense                                               69                     62                    61                     61                253                     277
            Interest income                                                                     (2)                    (1)                   (2)                    (2)                (7)                     (6)
            Interest expense                                                                    33                     32                    33                     33                131                     127
            Income tax expense                                                                  10                      7                     5                     —                  22                      23
            Interest expense, income tax and depreciation and
               amortization included in equity in earnings from
               investments in affiliates                                                         6                      5                     7                     7                  25                       26
         EBITDA                                                                                171                    202                   188                   108                 669                      924
            Loss (gain) on sales of assets, net                                                  2                    (31)                   12                    (1)                (18)                     (96)
            Loss on sale of investments in affiliates (1)                                       —                      —                     —                     —                   —                      (107)
            (Gain) loss on foreign currency transactions                                        (1)                    —                     —                      2                   1                        3
            Transition expense                                                                  —                      —                     —                     —                   —                         3
            Dispostion costs                                                                     2                     —                      1                    —                    3                        2
            Acquisition costs                                                                   —                      —                      6                    59                  65                       —
            Severance expense                                                                   —                       1                     1                    —                    2                        2
            Share-based compensation expense                                                     4                      4                     4                     4                  16                       16
            Casualty gain and impairment loss, net                                              —                      —                     —                      8                   8                       (1)
            Other items                                                                          6                     —                     (5)                   —                    1                        8
         Adjusted EBITDA                                                                       184                    176                   207                   180                 747                      754
            Add: Adjusted EBITDA from hotels acquired(2)                                        41                     37                    53                    39                 170                      181
            Less: Adjusted EBITDA from hotels disposed of                                        8                      6                     5                    (1)                 18                       40
            Less: Adjusted EBITDA from investments in affiliates
              disposed                                                                          —                      —                     —                     —                   —                        2
         Pro-forma Adjusted EBITDA(2)                                                          217                    207                   255                   220                 899                     893
            Less: Adjusted EBITDA from investments in affiliates                                 9                     10                    12                     9                  40                      43
            Less: All other(3)                                                                 (13)                   (15)                  (14)                  (12)                (54)                    (52)
         Pro-forma Hotel Adjusted EBITDA(2)                                                    221                    212                   257                   223                 913                     902
            Less: Adjusted EBITDA from non-comparable hotels                                     6                     (1)                   (4)                    4                   5                      10
         Pro-forma Comparable Hotel Adjusted EBITDA(2)                          $              215    $               213    $              261    $              219     $           908        $            892

(1)                    Included in other gain (loss), net in the condensed consolidated statement of operations.
(2)                    Includes results from hotels acquired in the Chesapeake acquisition as if the merger had taken place on January 1, 2018.
(3)                    Includes other revenues and other expenses, non-income taxes on TRS leases included in other property-level expenses and corporate general and administrative expenses in the
                       condensed consolidated statement of operations.

  35 |
Non-GAAP Financial Measures (continued)

 Historical Pro-forma Comparable Hotel Adjusted EBITDA – 2018 TTM
The financial information below is for the 57 comparable hotels owned as of September 30, 2019.
                                                                                                                    Three Months Ended                                                TTM                Full Year
        (unaudited, dollars in millions)                                               Decem ber 31,         March 31,                June 30,               Septem ber 30,     Septem ber 30,       Decem ber 31,
                                                                                           2017                 2018                    2018                     2018                 2018                 2017
        Net income                                                                 $               61    $               149     $               218     $               55     $            483     $         2,631
           Depreciation and amortization expense                                                   71                     70                      69                     69                  279                 288
           Interest income                                                                         —                      (1)                     (1)                    (2)                  (4)                 (2)
           Interest expense                                                                        31                     31                      31                     32                  125                 124
           Income tax (benefit) expense                                                            (2)                    —                       13                     —                    11              (2,346)
           Interest expense, income tax and depreciation and
              amortization included in equity in earnings from
              investments in affiliates                                                             6                      7                        5                     8                    26                  24
        EBITDA                                                                                    167                    256                      335                   162                   920                 719
           Gain on sales of assets, net                                                            (1)                   (89)                      (7)                   (2)                  (99)                 (1)
           (Gain) loss on sale of investments in affiliates (1)                                    —                      —                      (108)                    1                  (107)                 —
           (Gain) loss on foreign currency transactions                                            —                      (1)                       4                     1                     4                   4
           Transition expense                                                                       4                      2                       —                      1                     7                   9
           Disposition costs                                                                        2                     —                        —                     —                      2                   2
           Severance expense                                                                        1                     —                         1                     1                     3                   1
           Share-based compensation expense                                                         4                      4                        4                     4                    16                  14
           Casualty loss (gain) and impairment loss, net                                           24                     —                        —                     (1)                   23                  26
           Other items                                                                            (21)                     2                       (1)                    1                   (19)                (17)
        Adjusted EBITDA                                                                           180                    174                      228                   168                   750                 757
           Add: Adjusted EBITDA from hotels acquired(2)                                            38                     36                       55                    49                   178                 171
           Less: Adjusted EBITDA from hotels disposed of                                           15                     12                       11                     8                    46                  67
           Less: Adjusted EBITDA from investments in affiliates
             disposed                                                                               7                     —                        2                     —                     9                    7
        Pro-forma Adjusted EBITDA(2)                                                              196                    198                     270                    209                  873                  854
           Less: Adjusted EBITDA from investments in affiliates                                     3                     12                      12                     10                   37                   38
           Less: All other(3)                                                                     (12)                   (12)                    (14)                   (13)                 (51)                 (46)
        Pro-forma Hotel Adjusted EBITDA(2)                                                        205                    198                     272                    212                  887                  862
           Less: Adjusted EBITDA from non-comparable hotels                                        (1)                    —                        5                     —                     4                    6
        Pro-forma Comparable Hotel Adjusted EBITDA(2)                              $              206    $               198     $               267     $              212     $            883     $            856

  (1)                         Included in other gain (loss), net in the condensed consolidated statement of operations.
  (2)                         Includes results from hotels acquired in the Chesapeake acquisition as if the merger had taken place on January 1, 2018.
  (3)                         Includes other revenues and other expenses, non-income taxes on TRS leases included in other property-level expenses and corporate general and administrative expenses in the
                              condensed consolidated statement of operations.

36 |
Non-GAAP Financial Measures (continued)

Historical Pro-forma Comparable Hotel Revenues – 2019/2018 TTM
The financial information below is for the 57 comparable hotels owned as of September 30, 2019.

                                                                                                                     Three Months Ended                                                        TTM                 Full Year
(unaudited, dollars in millions)                                                   Decem ber 31,                March 31,                  June 30,           Septem ber 30,           Septem ber 30,          Decem ber 31,
                                                                                        2018                      2019                      2019                       2019                    2019                  2018
Total Revenues                                                                 $                686     $                   659    $                  703     $               672      $              2,720    $        2,737
   Less: Other revenue                                                                           19                          18                        19                      22                        78                72
   Add: Revenues from hotels acquired(1)                                                        135                         130                       151                     125                       541               561
   Less: Revenues from hotels disposed of                                                        42                          22                        14                      —                         78               193
   Less: Revenues from non-comparable hotels (2)                                                 13                           3                         5                      16                        37                32
Pro-forma Comparable Hotel Revenues(1)                                         $                747     $                   746    $                  816     $               759      $              3,068    $        3,001

(1)                     Includes results from hotels acquired in the Chesapeake acquisition as if the merger had taken place on January 1, 2018.
(2)                     Includes revenues from Park's non-comparable hotels and rental revenues from office space and antenna rent leases located at its hotels.

                                                                                                                         Three Months Ended                                                       TTM              Full Year
(unaudited, dollars in millions)                                                     Decem ber 31,               March 31,                   June 30,                 Septem ber 30,       Septem ber 30,      Decem ber 31,
                                                                                         2017                      2018                        2018                       2018                    2018               2017
Total Revenues                                                                   $               686        $                668       $                731       $              652       $           2,737   $        2,791
   Less: Other revenue                                                                            17                          17                         17                       19                      70               64
   Add: Revenues from hotels acquired(1)                                                         130                         127                        152                      148                     557              545
   Less: Revenues from hotels disposed of                                                         75                          62                         48                       41                     226              299
   Less: Revenues from non-comparable hotels (2)                                                   2                           3                          8                        9                      22               45
Pro-forma Comparable Hotel Revenues(1)                                           $               722        $                713       $                810       $              731       $           2,976   $        2,928

(1)                    Includes results from hotels acquired in the Chesapeake acquisition as if the merger had taken place on January 1, 2018.
(2)                    Includes revenues from Park's non-comparable hotels and rental revenues from office space and antenna rent leases located at its hotels.

37 |
Non-GAAP Financial Measures (continued)

Pro-forma Net Debt and Pro-forma Net Debt to Pro-forma Adjusted EBITDA Ratio
         (unaudited, in millions)
                                                                                                            Septem ber 30, 2019               Decem ber 31, 2018
                (1)
         Debt                                                                                                 $                 4,100          $                4,098
         Add: unamortized deferred financing costs (2)                                                                             19                              22
            Long-term debt, including current maturities and excluding
              unamortized deferred financing costs                                                                              4,119                           4,120
         Add: Park's share of unconsolidated affiliates debt,
           excluding unamortized deferred financing costs                                                                         234                             233
         Less: cash and cash equivalents (3)                                                                                      321                             376
         Less: restricted cash(4)                                                                                                  43                              47
         Pro-forma Net debt                                                                                   $                 3,989          $                3,930
                                                           (5)
         Pro-forma TTM Adjusted EBITDA                                                                        $                    899         $                   893
         Pro-forma Net debt to Pro-forma Adjusted EBITDA ratio                                                                    4.4x                            4.4x

  (1)    Debt as of December 31, 2018 includes $312 million of assumed Chesapeake mortgage loans and $850 million term facility borrowings, less $12 million of related unamortized deferred
         financing costs.
  (2)    Unamortized deferred financing costs as of December 31, 2018 includes $3 million of unamortized deferred financing costs associated with the assumed Chesapeake mortgage loans and
         $9 million associated with the term facility entered into in September 2019.
  (3)    Cash and cash equivalents as of December 31, 2018 includes Chesapeake's cash and cash equivalents of $71 million less $105 million of merger-related costs.
  (4)    Restricted cash as of December 31, 2018 includes Chesapeake’s restricted cash of $32 million.
  (5)    See slide 36 for Pro-forma TTM Adjusted EBITDA at September 30, 2019. Pro-forma TTM Adjusted EBITDA includes EBITDA for periods prior to ownership for the hotels acquired in the
         Chesapeake acquisition and excludes results from the 13 hotels disposed of in 2018, 1 hotel returned to the ground lessor at the end of 2018 and 5 hotels disposed of in 2019.

38 |
Definitions

  EBITDA, Adjusted EBITDA, Hotel Adjusted EBITDA and Hotel Adjusted EBITDA Margin

  Earnings before interest expense, taxes and depreciation and amortization (“EBITDA”), presented herein, reflects net income excluding depreciation and amortization,
  interest income, interest expense, income taxes and interest expense, income tax and depreciation and amortization included in equity in earnings from investments in
  affiliates.

  Adjusted EBITDA, presented herein, is calculated as EBITDA, as previously defined, further adjusted to exclude:
  • Gains or losses on sales of assets for both consolidated and unconsolidated investments;
  • Gains or losses on foreign currency transactions;
  • Transition expense related to the Company’s establishment as an independent, publicly traded company;
  • Transaction costs associated with hotel acquisitions or dispositions expensed during the period;
  • Severance expense;
  • Share-based compensation expense;
  • Casualty and impairment losses; and
  • Other items that management believes are not representative of the Company’s current or future operating performance.

  Hotel Adjusted EBITDA measures hotel-level results before debt service, depreciation and corporate expenses of the Company’s consolidated hotels, including both
  comparable and non-comparable hotels but excluding hotels owned by unconsolidated affiliates, and is a key measure of the Company’s profitability. The Company
  presents Hotel Adjusted EBITDA to help the Company and its investors evaluate the ongoing operating performance of the Company’s consolidated hotels.

  Hotel Adjusted EBITDA margin is calculated as Hotel Adjusted EBITDA divided by total hotel revenue.

  EBITDA, Adjusted EBITDA, Hotel Adjusted EBITDA and Hotel Adjusted EBITDA margin are not recognized terms under United States (“U.S.”) GAAP and should not
  be considered as alternatives to net income (loss) or other measures of financial performance or liquidity derived in accordance with U.S. GAAP. In addition, the
  Company’s definitions of EBITDA, Adjusted EBITDA, Hotel Adjusted EBITDA and Hotel Adjusted EBITDA margin may not be comparable to similarly titled measures
  of other companies.

  The Company believes that EBITDA, Adjusted EBITDA, Hotel Adjusted EBITDA and Hotel Adjusted EBITDA margin provide useful information to investors about the
  Company and its financial condition and results of operations for the following reasons: (i) EBITDA, Adjusted EBITDA, Hotel Adjusted EBITDA and Hotel Adjusted
  EBITDA margin are among the measures used by the Company’s management team to make day-to-day operating decisions and to evaluate its operating
  performance between periods and between REITs by removing the effect of its capital structure (primarily interest expense) and asset base (primarily depreciation and
  amortization) from its operating results; and (ii) EBITDA, Adjusted EBITDA, Hotel Adjusted EBITDA and Hotel Adjusted EBITDA margin are frequently used by
  securities analysts, investors and other interested parties as a common performance measure to compare results or estimate valuations across companies in the
  industry.

  EBITDA, Adjusted EBITDA, Hotel Adjusted EBITDA and Hotel Adjusted EBITDA margin have limitations as analytical tools and should not be considered either in
  isolation or as a substitute for net income (loss) or other methods of analyzing results as reported under U.S. GAAP.
                          Definitions EBITDA, Adjusted EBITDA, Hotel Adjusted EBITDA and Hotel Adjusted EBITDA Margin Earnings before interest expense, taxes and depreciation and amortization (“ EBITDA”), presented herein, reflects net income excluding depreciation and amortization, interest income, interest expense, income taxes and interest expense, income tax and depreciation and amortization included in equity in earnings from investments in affiliates. Adjusted EBITDA, presented herein, is calculated as EBITDA, as previously defined, further adjusted to exclude: Gains or losses on sales of assets for both
                          consolidated and unconsolidated investments; Gains or losses on foreign currency transactions; Transition expense related to the Company’s establishment as an independent, publicly traded company; Transaction costs associated with hotel acquisition or disposition costs expensed during the period; Severance expense; Share-based compensation expense; Casualty and impairment losses; and Other items that management believes are not representative of the Company’s current or future operating performance. Hotel Adjusted EBITDA measures hotel-level results before debt service, depreciation and
                          corporate expenses of the Company’s consolidated hotels, including both comparable and non-comparable hotels but excluding hotels owned by unconsolidated affiliates, and is a key measure of the Company’s profitability. The Company presents Hotel Adjusted EBITDA to help the Company and its investors evaluate the ongoing operating performance of the Company’s consolidated hotels. Hotel Adjusted EBITDA margin is calculated as Hotel Adjusted EBITDA divided by total hotel revenue. EBITDA, Adjusted EBITDA, Hotel Adjusted EBITDA and Hotel Adjusted EBITDA margin are not
                          recognized terms under United States (“ U.S.”) GAAP and should not be considered as alternatives to net income (loss) or other measures of financial performance or liquidity derived in accordance with U.S. GAAP . In addition, the Company’s definitions of EBITDA, Adjusted EBITDA, Hotel Adjusted EBITDA and Hotel Adjusted EBITDA margin may not be comparable to similarly titled measures of other companies. The Company believes that EBITDA, Adjusted EBITDA, Hotel Adjusted EBITDA and Hotel Adjusted EBITDA margin provide useful information to investors about the Company and
                          its financial condition and results of operations for the following reasons: (i) EBITDA, Adjusted EBITDA, Hotel Adjusted EBITDA and Hotel Adjusted EBITDA margin are among the measures used by the Company’s management team to make day-to-day operating decisions and to evaluate its operating performance between periods and between REITs by removing the effect of its capital structure (primarily interest expense) and asset base (primarily depreciation and amo rtization) from its operating results; and (ii) EBITDA, Adjusted EBITDA, Hotel Adjusted EBITDA and Hotel Adjusted EBITDA
                          margin are frequently used by securities analysts, investors and other interested parties as a common performance measure to compare results or estimate valuations across companies in the industry. EBITDA, Adjusted EBITDA, Hotel Adjusted EBITDA and Hotel Adjusted EBITDA margin have limitations as analytical tools and should not be considered either in isolation or as a substitute for net income (loss) or other methods of analyzing results as reported under U.S. GAAP. P ARK HOTELS & RESORTS 39

39 |
Definitions (cont’d)

 Nareit FFO attributable to stockholders, Adjusted FFO attributable to stockholders, Nareit FFO per share – Diluted and Adjusted FFO per share - Diluted

 Nareit FFO attributable to stockholders and Nareit FFO per diluted share (defined as set forth below) are presented herein as non-GAAP measures of the Company’s
 performance. The Company calculates funds from operations (“FFO”) attributable to stockholders for a given operating period in accordance with standards
 established by the National Association of Real Estate Investment Trusts (“Nareit”), as net income (loss) attributable to stockholders (calculated in accordance with
 U.S. GAAP), excluding depreciation and amortization, gains or losses on sales of assets, impairment, and the cumulative effect of changes in accounting principles,
 plus adjustments for unconsolidated joint ventures. Adjustments for unconsolidated joint ventures are calculated to reflect the Company’s pro rata share of the FFO of
 those entities on the same basis. As noted by Nareit in its December 2018 “Nareit Funds from Operations White Paper – 2018 Restatement,” since real estate values
 historically have risen or fallen with market conditions, many industry investors have considered presentation of operating results for real estate companies that use
 historical cost accounting to be insufficient by themselves. For these reasons, Nareit adopted the FFO metric in order to promote an industry-wide measure of REIT
 operating performance. The Company believes Nareit FFO provides useful information to investors regarding its operating performance and can facilitate
 comparisons of operating performance between periods and between REITS. The Company’s presentation may not be comparable to FFO reported by other REITs
 that do not define the terms in accordance with the current Nareit definition, or that interpret the current Nareit definition differently. The Company calculates Nareit
 FFO per diluted share as Nareit FFO divided by the number of fully diluted shares outstanding during a given operating period.

 The Company also presents Adjusted FFO attributable to stockholders and Adjusted FFO per diluted share when evaluating its performance because management
 believes that the exclusion of certain additional items described below provides useful supplemental information to investors regarding the Company’s ongoing
 operating performance. Management historically has made the adjustments detailed below in evaluating its performance and in its annual budget process.
 Management believes that the presentation of Adjusted FFO provides useful supplemental information that is beneficial to an investor’s complete understanding of
 operating performance. The Company adjusts Nareit FFO attributable to stockholders for the following items, which may occur in any period, and refers to this
 measure as Adjusted FFO attributable to stockholders:

 •     Gains or losses on foreign currency transactions;
 •     Transition expense related to the Company’s establishment as an independent, publicly traded company;
 •     Transaction costs associated with hotel acquisitions or dispositions expensed during the period;
 •     Severance expense;
 •     Share-based compensation expense;
 •     Casualty gains or losses; and
 •     Other items that management believes are not representative of the Company’s current or future operating performance.

 Pro-forma

 Certain financial measures and other information have been adjusted to reflect the effects of hotels disposed of and assume hotels acquired were owned as of the
 beginning of each of the periods presented. When presenting such information, the amounts are identified as “Pro-forma.”

40 |
Definitions (cont’d)

 Net Debt

 Net debt, presented herein, is a non-GAAP financial measure that the Company uses to evaluate its financial leverage. Net debt is calculated as (i) long-
 term debt, including current maturities and excluding unamortized deferred financing costs; and (ii) the Company’s share of investments in affiliate debt,
 excluding unamortized deferred financing costs; reduced by (a) cash and cash equivalents; and (b) restricted cash and cash equivalents.

 The Company believes Pro-forma Net debt provides useful information about its indebtedness to investors as it is frequently used by securities analysts,
 investors and other interested parties to compare the indebtedness of companies. Net debt should not be considered as a substitute to debt presented in
 accordance with U.S. GAAP. Net debt may not be comparable to a similarly titled measure of other companies.

 Net Debt to Pro-forma Adjusted EBITDA Ratio

 Net debt to Pro-forma Adjusted EBITDA ratio, presented herein, is a non-GAAP financial measure and is included as it is frequently used by securities
 analysts, investors and other interested parties to compare the financial condition of companies. Pro-forma Net debt to Pro-forma Adjusted EBITDA ratio
 should not be considered as an alternative to measures of financial condition derived in accordance with U.S. GAAP and it may not be comparable to a
 similarly titled measure of other companies.

 Comparable Hotels

 The Company presents certain data for its consolidated hotels on a comparable hotel basis as supplemental information for investors. The Company
 presents comparable hotel results to help the Company and its investors evaluate the ongoing operating performance of its comparable hotels.

 Park Comparable Hotels

 The Company presents certain data for Park’s legacy portfolio on a comparable basis. The Company defines Park comparable hotels as those that: (i)
 were active and operating in since January 1st of the previous year, and (ii) have not sustained substantial property damage or business interruption, have
 not undergone large-scale capital projects and for which comparable results are not available. Of the 40 Park legacy hotels that are consolidated as of
 September 30, 2019, 39 hotels have been classified as Park comparable hotels, which excludes 18 hotels acquired from Chesapeake. Due to the effects of
 business interruption from Hurricane Maria at the Caribe Hilton in Puerto Rico during the first half of 2019, the results from this property were excluded from
 comparable hotels in 2019. Park’s comparable hotels also exclude the 12 consolidated hotels that were sold in January and February 2018, one
 consolidated hotel that was returned to the lessor after the expiration of the ground lease in December 2018 and five consolidated hotels that were sold in
 2019.

41 |
Definitions (cont’d)

Chesapeake Comparable Hotels

The Company presents certain data for Chesapeake’s comparable hotels on a pro-forma comparable hotel basis, which includes 18 hotels the Company
acquired from Chesapeake in September 2019.

Total Pro-Forma Comparable Hotels

The Company presents certain data for its consolidated hotels on a pro-forma comparable hotel basis, which includes Park and Chesapeake comparable
hotels. Of the 58 hotels that are consolidated as of September 30, 2019, 57 hotels have been classified as comparable hotels.

Occupancy

Occupancy represents the total number of room nights sold divided by the total number of room nights available at a hotel or group of hotels. Occupancy
measures the utilization of the Company’s hotels’ available capacity. Management uses occupancy to gauge demand at a specific hotel or group of hotels in
a given period. Occupancy levels also help management determine achievable Average Daily Rate (“ADR”) levels as demand for hotel rooms increases or
decreases.

Average Daily Rate

ADR represents rooms revenue divided by total number of room nights sold in a given period. ADR measures average room price attained by a hotel and
ADR trends provide useful information concerning the pricing environment and the nature of the customer base of a hotel or group of hotels. ADR is a
commonly used performance measure in the hotel industry, and management uses ADR to assess pricing levels that the Company is able to generate by
type of customer, as changes in rates have a more pronounced effect on overall revenues and incremental profitability than changes in occupancy, as
described above.

Revenue per Available Room

Revenue per Available Room (“RevPAR”) represents rooms revenue divided by total number of room nights available to guests for a given period.
Management considers RevPAR to be a meaningful indicator of the Company’s performance as it provides a metric correlated to two primary and key factors
of operations at a hotel or group of hotels: occupancy and ADR. RevPAR is also a useful indicator in measuring performance over comparable periods for
comparable hotels.

References to RevPAR and ADR are presented on a comparable basis and references to RevPAR and ADR are presented on a currency neutral basis (prior
periods are reflected using the current period exchange rates), unless otherwise noted.

42 |
You can also read