LONG TERM VALUE ADDED INVESTORS - PRIMESTONE - PRIMESTONE CAPITAL LLP
←
→
Page content transcription
If your browser does not render page correctly, please read the page content below

Long Term Value Added Investors

May 2019                                     PrimeStone

A unique opportunity to create a global industry leader
and generate extraordinary returns for all shareholders
Disclaimer
General Considerations
This presentation, the materials contained herein, and the views expressed herein (this “Presentation”) are for discussion and general informational purposes only. This
Presentation does not have regard to the specific investment objective, financial situation, suitability, or the particular need of any specific person who may receive this
presentation, and should not be taken as advice on the merits of any investment decision. In addition, this Presentation should not be deemed or construed to constitute an offer
to sell or a solicitation of any offer to buy any security described herein in any jurisdiction to any person, nor should it be deemed as investment advice or a recommendation to
purchase or sell any specific security.

THE MATERIALS IN THIS PRESENTATION SHALL NOT CONSTITUTE AN OFFER TO SELL OR THE SOLICITATION OF AN OFFER TO BUY ANY INTERESTS IN ANY FUND MANAGED BY
PRIMESTONE CAPITAL LLP OR ANY OF ITS AFFILIATES. SUCH AN OFFER TO SELL OR SOLICITATION OF AN OFFER TO BUY INTERESTS MAY ONLY BE MADE PURSUANT TO DEFINITIVE
SUBSCRIPTION DOCUMENTS BETWEEN A FUND AND AN INVESTOR.

The views expressed herein represent the current opinions as of the date hereof of PrimeStone Capital LLP and its affiliates (collectively, “PrimeStone”) and are based on publicly
available information regarding Tennant Company (“Tennant”) and Nilfisk A/S (“Nilfisk,” together with Tennant, the “Companies”). Certain financial information and data used
herein have been derived or obtained from, without independent verification, public filings, including filings made by the Companies with the Securities and Exchange Commission
(“SEC”) and other sources. PrimeStone shall not be responsible for or have any liability for any misinformation contained in any SEC or other regulatory filing, any third party
report, or this Presentation. All amounts, market value information, and estimates included in this Presentation have been obtained from outside sources that PrimeStone
believes to be reliable or represent the best judgment of PrimeStone as of the date of this Presentation. PrimeStone is an independent company, and its opinions and projections
within this Presentation are not those of the Companies and have not been authorized, sponsored, or otherwise approved by either of the Companies.

The information contained herein, reflects projections, market outlooks, assumptions, opinions and estimates made by PrimeStone as of the date hereof and therefor constitutes
forward‐looking statements which are subject to change without notice at any time. Such forward‐looking statements are based on certain assumptions and involve certain risks
and uncertainties, including risks and changes affecting industries generally and the Companies specifically. Given the inherent uncertainty of projections and forward‐looking
statements, you should be aware that actual results may differ materially from the projections and other forward‐looking statements contained herein due to reasons that may or
may not be foreseeable.

Therefore, PrimeStone does not represent that any opinion or projection will be realized, and PrimeStone offers no assurances as to the price of neither Tennant nor Nilfisk
securities in the future. While the information presented herein is believed to be reliable, no representation or warranty is made concerning the accuracy of any data presented,
the information or views contained herein, nor concerning any forward‐looking statements.

This Presentation may not be reproduced without prior written permission from PrimeStone. The information contained within the body of this Presentation is supplemented by
footnotes which identify PrimeStone’s sources, assumptions, estimates, and calculations. This information contained herein should be reviewed in conjunction with the footnotes.

PrimeStone has not sought or obtained consent from any third party to use any statements or information indicated herein as having been obtained or derived from statements
made or published by third parties, nor has it paid for any such statements. Any such statements or information should not be viewed as indicating the support of such third party
for the views expressed herein. PrimeStone does not endorse third‐party estimates or research which are used in this presentation solely for illustrative purposes.

All registered or unregistered service marks, trademarks and trade names referred to in this Presentation are the property of their respective owners, and PrimeStone’s use herein
does not imply an affiliation with, or endorsement by, the owners of these service marks, trademarks and trade names or the goods and services sold or offered by such owners.

                                                                                         2
PrimeStone Analysis Summary

PrimeStone analysis of Tennant, Nilfisk and the professional cleaning equipment industry is based
on public information and extensive due diligence completed

60+ interviews completed with a combination of
• Current senior management of Tennant and Nilfisk (organized by Investor Relations)
• Industry executives including former employees of Tennant and Nilfisk
• Competitors of both Tennant and Nilfisk
• Customers (both direct and indirect) of Tennant and Nilfisk
• Specialised industry consultants as well as generalist industrial consultants

Interactions were realised through
• Direct meetings / calls with senior management of Tennant and Nilfisk
• Expert networks
• Trade fair attendance
• 3rd party consultant

                                               3
Table Of Content

  Executive Summary

  Strategic Logic For Merging Tennant And Nilfisk

  Financial And Shareholder Value Implications Of A Merger

  Analysis Of Tennant’s Historical Track Record And Prospects

  Drivers Of Future Value Creation
      – Benefits Of Global Scale
      – Benefits Of Local Scale

  Wrap‐up Comments

  Appendix

                                     4
Table Of Content

  Executive Summary

  Strategic Logic For Merging Tennant And Nilfisk

  Financial And Shareholder Value Implications Of A Merger

  Analysis Of Tennant’s Historical Track Record And Prospects

  Drivers Of Future Value Creation
      – Benefits Of Global Scale
      – Benefits Of Local Scale

  Wrap‐up Comments

  Appendix

                                     5
Executive Summary

PrimeStone is a long‐term value added investor in mid‐cap companies. We invest in high quality businesses
that can create substantial shareholder value over time. We support their executives and boards by leveraging
      •   Our private equity type due diligence and process acquired over 20+ years investing more than $10bn of equity
      •   Our experience as chairmen or directors of more than 30 boards of public and private companies

We have been following the professional cleaning equipment industry, Tennant and Nilfisk for the last 3 years

PrimeStone Capital owns more than 5% of both Tennant and Nilfisk and believes a combination of the two will
generate extraordinary returns for shareholders by creating the market leader of the professional cleaning
equipment industry

We believe synergies will generate EPS accretion in excess of 85% for both companies on the basis of a merger
at current valuations

We believe that, together with some of management’s current initiatives, Tennant shares will be worth c.$144
in 4 years generating a Total Shareholder Return of c.23% per annum or close to 130% in total

We believe the value creation from the merger will be far in excess and far more certain than in any
standalone plan

                                                              6
Executive Summary
The professional cleaning equipment industry is attractive, characterized by the significant benefits provided
by both global and local scale, and still fragmented with the top 4 players accounting for 45% of the market
Tennant and Nilfisk are large players of comparable size with very complementary areas of strength
• Tennant is leader in the Americas, much smaller in EMEA and weak in APAC. It is stronger with Industrial customers. It
mostly serves its customers directly in Americas and through distributors elsewhere
• Nilfisk is a leader in EMEA, much smaller in Americas and weak in APAC. It is stronger with Commercial customers. It
mostly serves its customers directly in EMEA and through distributors elsewhere
• Both have acquired mid‐market brands (IPC and Viper) with complementary geographic coverages
Tennant and Nilfisk have historically exploited the benefits provided by local scale and outperformed each
other in their respective region of strength over 2005‐2016, illustrating the advantage provided by a strong
local direct sales force and an in‐house service offering
Tennant and Nilfisk share the same vision, values and strategy
Both face Kärcher, a much larger German family‐owned company with ample financial resources and
ambitious growth plans
We believe the combined entity formed by Tennant and Nilfisk will be a truly global industry leader with #1
positions in the Americas, EMEA and APAC. Its geographic exposure will mirror that of the overall
professional cleaning equipment market
7Executive Summary
We believe merging Tennant and Nilfisk will drive both global and local scale and lead to a step change in
operating profitability through
• Significant revenue opportunities
- Accelerate new product development
- Shift current equipment revenues generated through distributors to direct sales
- Capture current service and spare parts revenues currently generated by distributors
- Accelerate growth in Emerging Markets
- …which altogether outweigh the potential dis‐synergies
• Dramatic cost reductions at both global and local level, that can partially be reinvested in growth
- Costs of Goods Sold
- Sales, General & Administration
- Research & Development
Now is the right time
• A merger could not have happened sooner since Nilfisk was part of electric cable manufacturer NKT
- only an acquisition by NKT could have been envisioned…
- …but such a deal would have deprived Tennant’s shareholders from much of the value creation
• Nilfisk has now been demerged from NKT and is being re‐energized under a new leadership
• Tennant’s integration of IPC appears on track and will fit perfectly into Tennant+Nilfisk’s strategy
• Tennant’s current operational problems will be solved by the end of Q1 or Q2 2018 according to management, by
which time the merger should just be approved
We believe that Nilfisk’s management, Board and shareholders are likely to support the combination with
Tennant
8Table Of Content
Executive Summary
Strategic Logic For Merging Tennant And Nilfisk
Financial And Shareholder Value Implications Of A Merger
Analysis Of Tennant’s Historical Track Record And Prospects
Drivers Of Future Value Creation
– Benefits Of Global Scale
– Benefits Of Local Scale
Wrap‐up Comments
Appendix
9Company Profiles
• Pro‐forma FY16 Revenues: $1 billion1 • Pro‐forma FY16 Revenues: $1.2 billion3
• Pro‐forma FY16 EBITDA: $120 million1 • Pro‐forma FY16 adj. EBITDA: $129 million3
• Market‐Cap: $1.1 billion • Market‐Cap: $1.3 billion
• Net debt / EBITDA: c.2.8x2 • Net debt / EBITDA: c.2.8x3
• Global market share: c.12%4 • Global market share: c.13%4
• Employees: c.4,100 • Employees: c.5,600
• Products: floorcare equipment, vacuum cleaners, carpet • Products: floorcare equipment, vacuum cleaners, high
extractors and other specialty cleaning equipment pressure washers, other specialty cleaning equipment
• Clear leader in Americas • Leader in EMEA
• Weaker in EMEA and APAC • Weaker in Americas and APAC
• Historical strength in industrial cleaning equipment • Historical strength in commercial cleaning equipment
FY2016 Revenues1 FY2016 Revenues3
Others 7% APAC 9% APAC 11%
Equipment
60% Americas
62% Aftermarket Americas 31%
35%
Aftermarket
EMEA 30%
33%
Equipment
65%
EMEA 58%
Source: Company Reports, PrimeStone estimates
Note:
1 Tennant financials FY2016PF including IPC (converted at EUR/USD 1.1885) and Florock full year impact; adjusted for foreign currency changes as of November 2017; “Others” includes Tennant Coatings as well as IPC Tools & Supplies
2 Tennant Q3 2017 net debt / FY2016PF EBITDA including full year impact of IPC and Florock ; adjusted for foreign currency changes as of November 2017
3 Nilfisk financials FY2016; adjusted EBITDA including capitalized R&D expenses; net debt Q3 2017 LT&ST “interest bearing loans and borrowings” less “cash at hand and in bank”; adjusted for foreign currency changes as of November 2017; FX rate for currency
conversion: EUR/USD: 1.1885
4 Based on market definition according to Nilfisk CMD presentation September 2017
10The Professional Cleaning Equipment Industry Is Attractive
An Attractive Industry…
• Growth in line with GDP
• Equipment, service and parts accounting for less than 10% of total cleaning cost, itself a small part of the customers’
cost base
• Significant aftermarket revenues: c.30‐35% for Tennant and Nilfisk
• Fragmented customer base: more than 200,000 customers including 10,000 distributors at Nilfisk
- Top 10 customers below 10% of revenues
• Differentiation through product reliability rather than price
- Tennant has increased prices every year since 2007 but in 2010
• Fragmented supplier base
• Low tangible CapEx, typically 1.5‐2.5% of revenues
• High ROCE: 17‐21% post‐tax ROCE at Tennant
…With Opportunities For Accelerating Organic Growth
• Emerging markets growth through
- Economic growth and urbanization
- Increased penetration of high‐end cleaning equipment / automation
- Increasing cleaning standards
• Autonomous cleaning promising dramatic value creation opportunity for customers
• Other exciting game‐changing technologies eg. telematics
• Increasing customer focus on sustainability
…And A Strong Rationale For Consolidation
• Fragmented industry: top 4 players only account for c.45% of the market1
• Local scale effects
• Global scale effects
Source: Company Reports, PrimeStone estimates
Note: 1 Based on market definition according to Nilfisk CMD presentation September 2017, Tennant revenues FY2016PF incl. full year impact of IPC and Florock, Nilfisk revenues FY2016, Kaercher revenues FY2015, Hako revenues FY2016
11Significant Benefits Are Derived From Global And Local Scale
At Stake
Est. % Of Rev.
• Improved Bargaining Power With Suppliers 25‐30%
• Optimization Of Manufacturing Strategy And Footprint 15‐20%
Global Scale • Increased Spending In And Higher Efficiency Of R&D 3‐4%
• Amortization Of Central G&A Expenses 2‐3%
• Improved Access To Capital Markets ‐
• Improved Reach And Ability To Service Customers Directly Revenue Opportunity
Local Scale • Ability To Better Expand In Emerging Markets Revenue Opportunity
• Amortization Of Local Infrastructure, Salesforce And Customer Service 25‐30%
12Tennant And Nilfisk Are Highly Complementary Businesses
• Complementary geographic strengths and customer focus in the Americas
• Solid mid‐market positions in different regions with IPC and Viper
Market\Region Americas EMEA APAC
Industrial
Tennant
($613 m1) Nilfisk
Tennant
Premium ($129 m1)
($534 m3)
Tennant
($73 m1)
Nilfisk
($81 m3)
Commercial
Nilfisk
($252 m3)
Tennant/IPC Tennant/IPC Tennant/IPC
($24 m2) ($177 m2) ($20 m2)
Mid‐Market
Nilfisk/Viper Nilfisk/Viper Nilfisk/Viper
($75 m3) ($22 m3) ($14 m3)
Low‐End Tennant/Alfa
Area proportionate
to revenues
Source: Company Reports, PrimeStone estimates
Note:
1 Tennant revenues FY2016 PF including full year effect for Florock acquisition (excluding IPC)
2 IPC revenues EUR 186 million converted at EUR/USD 1.1885
3 Nilfisk revenues FY2016 (excluding Specialty segments), premium/mid‐market split according to CMD presentation September 2017, FX rate for currency conversion: EUR/USD: 1.1885
13Local Scale Has Driven Significant Commercial Outperformance
• Both Tennant and Nilfisk have delivered very strong long term commercial results in their home regions,
highlighting the value of their
– Local market shares
– In‐house service offerings
– Entrenched salesforce
• Building a competitive in‐house service offering and spare parts infrastructure requires strong local
market share and improves the value proposition to customers for new equipment sales
1
Americas Organic Growth Comparison1 1
EMEA Organic Growth Comparison1
170% 150%
Tennant CAGR 4.2% Tennant CAGR (0.4%)
141%
160%
Nilfisk CAGR 2.1% 153%
157%
140% Nilfisk CAGR 3.2%
134%
133%
150%
144%
130%
140% 123%
121%
129% 120% 118% 117%
130% 117%
125% 116% 116%
122% 121% 121% 112%
118% 118% 110%
120% 110% 108% 108%
113% 112% 113%
111%
108% 105% 102%103%
102% 101%
110% 106% 107% 106% 100%
103% 100% 98%
100% 99% 96% 96%
100% 94%
91%
90%
90%
80% 80%
2005 2006 2007 2008 2009 2010 2011 2012 2013 2014 2015 2016 2005 2006 2007 2008 2009 2010 2011 2012 2013 2014 2015 2016
Tennant Nilfisk Tennant Nilfisk
Source: Company Reports
Note:
1 Compounded organic growth as reported by the company
14Tennant And Nilfisk Share The Same Vision, Values and Strategy
“We will lead our global industry in sustainable
cleaning innovation that empowers our “We enable sustainable cleaning worldwide to
Vision customers to create a cleaner, safer and improve quality of life”
healthier world”
“We wish to drive industry innovation by
Focus On “We are passionate about developing innovative fundamentally changing the way we clean. In
Customers and sustainable solutions that help our customers 2016, we introduced The Horizon Program, our
And clean more spaces more effectively, addressing long term innovation strategy, which focuses on
indoor and outdoor cleaning challenges.” developing intelligent cleaning offerings to make
Innovation our customers’ businesses smarter.”
Spending 3‐4% of revenues in R&D Spending 3‐4% of revenues in R&D
Expanding outside of historic market: EMEA Expanding outside of historic market:
and Emerging Markets Americas and Emerging Markets
Strategy Growing in mid‐market with IPC Growing in mid‐market with Viper
Financial discipline and ambition for 12% Financial discipline and ambition for 13‐15%
Operating Profit margin EBITDA (c.10‐12% Operating Profit margin)
Source: Company Reports, PrimeStone estimates
15Tennant + Nilfisk Will Become The Leader In Every Region And Globally
Americas EMEA APAC
Kärcher
Kärcher
Tennant #1 Pro.
Pro.
#1
Nilfisk
Nilfisk Other Tennant
Hako
Other Nilfisk
Kärcher
Pro.
Other
Hako
Tennant
Hako #1
Global
Kärcher
Pro.
Nilfisk
Other
#1
Tennant
Hako
Source: Company Reports, PrimeStone estimates Numatic Taski
Note: Market estimates based on market definition according to Nilfisk CMD presentation dated September 2017, Tennant revenues FY2016PF incl. full year impact of IPC and Florock, Nilfisk revenues FY2016 (excl. Specialty Consumer), Kaercher revenues FY2015, Hako
revenues FY2016, Numatic revenues FY2014
16Post‐Merger, Geographical Exposure Will Match The Market Opportunity
• The combined group will be balanced between the two largest cleaning equipment markets: Americas
and Europe
• The enlarged company‘s exposure will almost mirror the global cleaning equipment market (split c.43%
Americas, 41% EMEA and 16% APAC)
1 2 Tennant + Nilfisk
“NewCo” 1‐2
Revenues 2016PF1 Revenues 20162 Revenues 2016PF
APAC APAC
APAC 9% 11% 10%
Americas
31%
Americas
EMEA 45%
29%
Americas
62% EMEA
45%
EMEA
58%
Source: Company Reports, PrimeStone estimates
Note:
1 Tennant revenues FY2016PF including IPC revenues (EUR 186 million converted at EUR/USD 1.1885) and Florock full year impact
2 Nilfisk revenues FY2016, FX rate for currency conversion: EUR/USD: 1.1885
17NewCo Will Benefit From Highly Complementary Routes To Market1
• Tennant and Nilfisk today have different routes to market in the two main regions, suggesting room for
substantial revenue synergies
2 3 Tennant + Nilfisk
“NewCo” 1‐3
Indirect
27% Direct, 25%
Americas
Indirect,
45%
Direct, 55%
Direct
Indirect,
73%
75%
Indirect,
38% Indirect,
EMEA
Direct, 45% 43%
Indirect,
55% Direct, 57%
Direct, 62%
Source: Company Reports, Management interviews, PrimeStone estimates
Note:
1 Direct: Sales through Tennant/Nilfisk sales force; Indirect: Sales through distributors
2 Tennant revenues FY2016PF including IPC revenues (EUR 186 million converted at EUR/USD 1.1885) and Florock full year impact
3 Nilfisk revenues FY2016 excluding Specialty Consumer segments, split confirmed by investor relations, FX rate for currency conversion: EUR/USD: 1.1885
18Table of Content
Executive Summary
Strategic Logic For Merging Tennant And Nilfisk
Financial And Shareholder Value Implications Of A Merger
Analysis Of Tennant’s Historical Track Record And Prospects
Drivers Of Future Value Creation
– Benefits Of Global Scale
– Benefits Of Local Scale
Wrap‐up Comments
Appendix
19Key Transaction Assumptions
• Tennant to merge with Nilfisk in an all‐stock transaction at current share price
– Reflecting their similar businesses, market positions, leverage levels, and valuations
• Exchange ratio of 0.77 Tennant share per Nilfisk share resulting in an ownership of 46% of
Transaction the Tennant shareholders in the merged entity
Overview • Combined cost synergies of $140 million, net of assumed revenue dis‐synergies
– No revenue synergies assumed at this stage
• Group debt refinancing at similar cost
– Despite opportunity for better rating
• Tennant standalone plan reflects
– 3.0% organic revenue growth (vs. 3.1% average over the last 10 years)
– Profitability improvement from current cost savings plan as well as IPC synergies
– Various operating margin scenarios considered between 9% (slightly above the historical peak
margins) and up to 12% (management’s mid‐term margin target1)
Operating • Nilfisk standalone plan reflects
Assumptions – 3.0% organic revenue growth, at the low‐end of company guidance (3‐5%)
– Profitability improvement from Accelerate+ cost savings plan
– Various operating margin scenarios considered between 9% (slightly above the historical peak
margins) and up to 12% (implied high end of management’s EBITDA margin target range of 13‐15%2)
• Synergies to be realized by 2021
– One‐off cost of synergies implementation of 1x gross synergy target
Source: Company Reports, PrimeStone estimates
Note:
1 Company presentation dated August 2014 (InvestMNt conference), PrimeStone assumptions
2 Nilfisk CMD presentation September 2017
20Pro‐forma Combined Capitalization Table
Tennant Nilfisk Tennant + Nilfisk
3 4
Multiple of 2016 Multiple of 2016 Multiple of 2016
$m EBITDA EBITA P/E $m EBITDA EBITA P/E $m EBITDA EBITA P/E
1
Net Debt 333 2.8x 3.5x 359 2.8x 3.9x 692 2.8x 3.7x
2
Share Price ($) 63.0 48.7
Shares Outstanding (m) 17.9 27.1
Market Capitalization 1,125 9.4x 11.8x 21.5x 1,321 10.2x 14.5x 23.2x 2,446 9.8x 13.1x 22.4x
Enterprise Value 1,457 12.2x 15.3x 1,681 13.0x 18.4x 3,138 12.6x 16.8x
Ratio Based on Current Valuations %
Nilfisk Shares (m) 27.1
Exchange Ratio 0.77x
# Tennant Shares Issued to Nilfisk Shareholders (m) 21.0 54%
+ Tennant Shares (m) 17.9 46%
Note that we have assumed an issuance of Tennant shares
for illustrative purposes only and without prejudging the
most efficient deal mechanism and structure
Source: Company Reports, PrimeStone estimates
Note:
1 Net debt Q3 2017 for Tennant and Nilfisk, FX rate for currency conversion: EUR/USD: 1.1885
2 Nilfisk share price DKK 305.00, FX rate for currency conversion DKK/USD: 0.15971
3 Tennant EBITDA/EBITA/Net Income FY2016PF including IPC and Florock full year impact; adjusted for foreign currency changes as of November 2017
4 Nilfisk adjusted EBITDA/EBITA/Net Income FY2016 including capitalized R&D expenses; adjusted for foreign currency changes as of November 2017 ; FX rate for currency conversion: EUR/USD: 1.1885
21Key Synergy Assumptions
• Synergies are assumed towards the lower end of savings benchmarks in bottom‐up approach
Typical Savings PrimeStone
When Doubling Assumption
Cost Category Rationale Comment
(% of Combined (% of Combined
Spending)1 Spending)
• 2% typical savings when buying lots of commodity products • Low/Middle of range given mix of plastic, steel
Raw Materials 2‐6% • Up to 8% for numerous components or engineered parts 3% and engineered parts
Manufacturing • 5% for labour intensive / assembly process (larger plants, • Low end retained given assembly nature
5‐20+% fixed costs absorption) 7% • Significant benefit to be derived from
/ Other COGS • Up to 20%+ for very automated production processes manufacturing consolidation
• 10% for national accounts / large clients • Limited savings in National accounts
• 20‐25% for door to door salesforce through higher route • Moderate optimisation in existing salesforce
Salesforce 10‐25% density / duplicate coverage to accelerate growth
• Savings partially mitigated in the case of two separate • Investments to cover migration from indirect
brands to direct
• Typically 20% through improved utilization of service force / • Optimisation of service coverage by existing in‐
route density house staff
Service Costs 20% 12.5% • Investments to cover migration from indirect
to direct
• 15%+ savings through local infrastructure savings • Significant local infrastructure overlap
Local G&A 15‐35%
• Typically 25% through larger scale • Headquarters savings
Headquarters 20%+
• Up to 35‐40% in the case of high product overlap • Very significant potential but limited savings
R&D 30%+ 10% assumed, in order to accelerate growth and
continue to drive innovation
Source: Interviews with consulting firms – PrimeStone experience and estimates
Note:
1 Savings realized on the total cost base in case of a doubling of size
22We Believe Cost Synergies From The Merger Will Create Dramatic Value
Tennant1 Nilfisk2 T +N Synergies T+N Difference/
$m FY16-PF FY16 FY16 $m (%) With Synergies Accretion (%)
Revenues 1,048 1,222 2,270 (45) (2.0)% 2,225
Revenue dis-synergies impact (26) (26)
3
Raw Materials Est. 326 357 682 (20) 3.0% 662
Other COGS 267 351 617 (43) 7.0% 574
Total COGS 592 707 1,299 (90) 1,210
Gross Profit 456 515 971 44 1,015 927
Gross Margin 43.5% 42.2% 42.8% 45.6%
SG&A & Other Costs 325 379 703 (88) 12.5% 615
% Revenues 31.0% 31.0% 31.0% 27.7%
R&D Costs 36 46 82 (8) 10.0% 73
% Revenues 3.4% 3.7% 3.6% 3.3%
EBITA 95 91 186 140 327 75.3%
Margin 9.1% 7.5% 8.2% 14.7%
Interest & Other (21) (13) (34) n.q. (34)
Taxes 21 21 43 82
T ax Rate 29.0% 27.0% 28.0% 28.0%
Net Income 52 57 109 210 92.4%
Number of Shares 18 27 39
EPS ($) 2.94 2.10
+85% 5.42
Source: Company Reports, PrimeStone estimates
Note:
1 Tennant financials FY2016PF including IPC (converted at EUR/USD 1.1885) and Florock full year impact; adjusted for foreign currency changes as of November 2017
2 Nilfisk financials FY2016; EBITA including capitalized R&D expenses; adjusted for foreign currency changes as of November 2017 ; FX rate for currency conversion: EUR/USD: 1.1885
3 Tennant raw material & component spending in line with company information and competitors (50‐60% of COGS); Nilfisk raw material & component spending according to company information (EUR~300 million)
23The Level of Expected Synergies Is Consistent With Tennant’s Past Targets
Management Target vs. PrimeStone Assumptions
Tennant
$m 2014 Target for FY2017 PrimeStone Merger Case
Revenues 1,000 2,225
Organic Growth (%) 5-9% 3.0%
Gross Margin (%) 42-43% 45.6%
S&A Expense (%) 27-28% 27.7%
R&D (%) 3-4% 3.3%
EBITA Margin (%) 12.0% 14.7%
Source: Company presentation dated August 2014 (InvestMNt conference), PrimeStone assumptions
24The Level of Expected Synergies Is Also Consistent With Benchmarks
Announced Synergies For Diversified
Industrial Transactions 2010‐2016
30.0%
25.0%
Cost Synergies (% Of Target Revenues)
20.0%
15.0%
1
Average 10%
10.0%
5.0%
0.0%
800 900 1,000 1,100 1,200 1,300 1,400 1,500 1,600 1,700
Revenues ($m)
Source: Credit Suisse ‐ PrimeStone Analysis
Notes:
1 Average of Tennant and Nilfisk assuming $ 140 million of synergies; Tennant revenues FY2016PF including IPC revenues and Florock full year impact; Nilfisk revenues FY2016, currency changes
as of November 2017; FX rate for currency conversion: EUR/USD: 1.1885
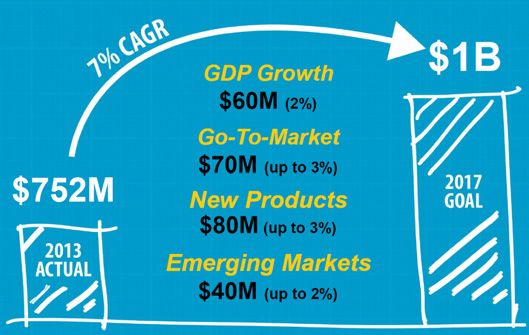
252021 Implied Share Price
• We believe the value creation will be far in excess and far more certain than in any standalone plan
Estimated 2021 Share Price ($) And Resulting TSR
Standalone Scenarios Combination with Nilfisk
At 9‐10‐12% Operating Margins1
$164
$160
$144
$140
$134
$120
$107
$100
$88
$80
$78
$63
$60
Past TSR p.a.
$40
Current Share 9.0% Margin 10.0% Margin 12.0% Margin 9.0% + Synergies 10.0% + Synergies 12.0% + Synergies 1‐yr: (17)%
Price 3‐yr: (2)%
TSR 5‐yr: 13%
p.a. 5% 9% 14% 21% 23% 27%
10‐yr: 5%
Source: Company Reports, Bloomberg, PrimeStone estimates
Note: PrimeStone share price estimated based on 20x P/E multiple, which is below current levels. Share price estimates assume no dividend paid over the period
1 9‐10‐12% operating margins applied to both Tennant and Nilfisk as described on slide “Key Transaction Assumptions”
26Table Of Content
Executive Summary
Strategic Logic For Merging Tennant And Nilfisk
Financial And Shareholder Value Implications Of A Merger
Analysis Of Tennant’s Historical Track Record And Prospects
Drivers Of Future Value Creation
– Benefits Of Global Scale
– Benefits Of Local Scale
Wrap‐up Comments
Appendix
27Operating Margin Progress Has Stalled After The Post Crisis Recovery
Tennant Adjusted Operating Margin vs. Target (%)1
14.0%
Company Target 12%
12.0%
10.0%
8.0% 8.7% 8.8%
8.3% 8.5% 8.4% 8.5%
7.3%
6.0%
5.7% 5.9%
4.0%
3.3%
2.0%
0.0%
2007 2008 2009 2010 2011 2012 2013 2014 2015 2016
Operating Margin Margin Target
Source: Company Reports, PrimeStone estimates
Note: 1 Non‐GAAP Adjusted Operating Margin according to Tennant reporting
28Growth Targets Have Not Materialized Despite Investment in S&A
• Management set growth targets and increased S&A spending to achieve those but this investment
generated limited payback
• Organic growth has been well below targets
Exciting Organic Growth Targets And.. …But Limited Pay Back
2010 2014
12.0%
10.3%
10.0%
Target Range 5‐9%
8.0%
…Commensurate S&A Spending… 6.0%
270
4.0%
260 2.8% 4.3%
251
249 248
250
242 2.0% 1.3%
1.1%
240
234
($m)
233
0.0%
230 0.0%
221
2012 2013 2014 2015 2016 2017 YTD
220
210
200
2010 2011 2012 2013 2014 2015 2016
Source: Company reports
29S&A Target Miss Accounts For Most Of The Profitability Gap
• Selling and administrative expenses account for the large majority of the underperformance vs. company targets
• Since 2013 they have increased almost in line with revenues and remained c.300bps above target
Detailed Margin Targets S&A Expenses As % of Revenues
34.0%
33.1%
2010 Target for FY2013 2014 Target for FY2017
33.0%
$m 2010 Target Achieved Target Achieved1
32.0%
32.0% 31.7%
Revenues 668 818 752 1,000 809 31.0%
31.0% 30.5% 30.6% 30.7%
Gross Margin (%) 42.7% 42-43% 43.3% 42-43% 43.5%
30.0%
S&A Expense (%) 33.1% 27-28% 31.0% 27-28% 30.7% 29.0%
R&D (%) 3.9% 3-4% 4.1% 3-4% 4.3% 28.0% Company Target 27.5%
Non-GAAP Adjustments 0.2% 0.4% - 27.0%
EBITA Margin (%) 5.9% 12.0% 8.7% 12.0% 8.5% 26.0%
25.0%
24.0%
2010 2011 2012 2013 2014 2015 2016
S&A % Revenues
Source: Company Reports, PrimeStone estimates
Note: 1 FY2016 results presented for profitability comparison. 2017 operating margin is very unlikely to exceed FY2016 level according to PrimeStone estimates based on company reporting through Q3 2017.
FY2017 revenue guidance of $960‐990m includes a significant contribution from the IPC acquisition
30What Are The Possible Root Causes Of Underperformance ?
Possible Root Causes Possible Remedies Comments
Ineffectiveness of
Drastic cost reduction effort Limited impact from current plan
S&A spending
Lack of scale outside
North America
(EMEA and APAC)
IPC a good first step but far
Gain dramatic scale through M&A
from sufficient
Structural industry
feature
31Management Targets Set in 2010 Seemed Reasonable
Operating Profit
Operating Profit Margin
Margin vs.vs. Revenues
Revenues
20.0%
18.0%
2013 targets were
reasonable
16.0%
Operating Profit Margin
14.0%
2013 Target (2010)
12.0%
10.0%
2007
8.0%
Evidence of scale
2006 effect 2005‐07:
Growth: 20%
6.0% 2005 Margin: +198bps
2008
4.0%
500 1,000 2,000
Revenues ($m)
Source: Company Reports ‐ PrimeStone Analysis
Notes:
1 Trendlines exclude the great financial recession and immediate rebound
32Management Targets Set in 2014 Seemed Reasonable As Well
Operating Profit
Operating Profit Margin
Margin vs.vs. Revenues
Revenues
20.0%
18.0%
2013 and 2017 targets
were reasonable
16.0%
Operating Profit Margin
14.0%
2013 Target (2010)
12.0%
2017 Target (2014)
10.0%
2013
2007 2012
8.0%
2005‐07:
2006 2011 Growth: 20%
Margin: +198bps
6.0% 2005 2010 2008
4.0%
500 1,000 2,000
Revenues ($m)
Source: Company Reports ‐ PrimeStone Analysis
Notes:
1 Trendlines exclude the great financial recession and immediate rebound
33Post‐2010, Targets Were Missed As Growth‐S&A Relationship Broke
Operating Profit
Operating Profit Margin
Margin vs.vs. Revenues
Revenues
20.0%
18.0%
2013 and 2017 targets
were reasonable
16.0% Lack of drop‐through
suggests S&A
inefficiency
Operating Profit Margin
14.0%
2013 Target (2010)
12.0%
2017 Target (2014)
Performance Gap
10.0% 2007‐16:
2014
2013 2015 Growth: 22%
2007‐16 trendline
Margin: +21bps
2007 2012 2016
8.0%
2005‐07:
2006 2011 Growth: 20%
Margin: +198bps
6.0% 2005 2010 2008
4.0%
500 1,000 2,000
Revenues ($m)
Source: Company Reports ‐ PrimeStone Analysis
Notes:
1 Trendlines exclude the great financial recession and immediate rebound
34Even The Full Cost Synergies From IPC Do Not Help Close The Gap
Operating Profit
Operating ProfitMargin Revenues1
vs.Revenues
Margin vs.
20.0%
18.0%
2013 and 2017 targets
were reasonable
16.0% Lack of drop‐through
suggests S&A
inefficiency
Operating Profit Margin
14.0%
2013 Target (2010) 2017 Target (2014)
12.0%
Performance Gap: 325bps
10.0% 2
2007‐17:
2013 2015 2014 2007‐16 trendline Growth: 60%
2007 2016 2017 inc. IPC + synergies Margin: +46bps
8.0% 2012
2017 exc IPC 2017 inc. IPC
2006 2011
6.0% 2005 2010 2008
4.0%
500 1,000 2,000
Revenues ($m)
Source: Company Reports ‐ PrimeStone Analysis
Notes:
1 Trendlines exclude the great financial recession and immediate rebound
2 2017 incl. IPC and $10 million of synergies
35Management Cannot Rely On The Economy Accelerating Much Further
• US Real GDP Growth in the last 5 years averaged 2.1%, close to its 20‐year average of 2.3%
• The IMF and the World Bank do not forecast major improvement in the near future
US GDP Growth (%, YoY)
5.0%
20Y Average: 2.25%
4.0%
3.0%
5Y Average: 2.12%
2.0%
1.0%
10Y Average: 1.42%
0.0%
2007‐01‐01
2007‐05‐01
2007‐09‐01
2008‐01‐01
2008‐05‐01
2008‐09‐01
2009‐01‐01
2009‐05‐01
2009‐09‐01
2010‐01‐01
2010‐05‐01
2010‐09‐01
2011‐01‐01
2011‐05‐01
2011‐09‐01
2012‐01‐01
2012‐05‐01
2012‐09‐01
2013‐01‐01
2013‐05‐01
2013‐09‐01
2014‐01‐01
2014‐05‐01
2014‐09‐01
2015‐01‐01
2015‐05‐01
2015‐09‐01
2016‐01‐01
2016‐05‐01
2016‐09‐01
2017‐01‐01
2017‐05‐01
2017‐09‐01
2018‐01‐01
2018‐05‐01
2018‐09‐01
2019‐01‐01
2019‐05‐01
2019‐09‐01
2020‐01‐01
2020‐05‐01
2020‐09‐01
2021‐01‐01
2021‐05‐01
2021‐09‐01
2022‐01‐01
2022‐05‐01
2022‐09‐01
‐1.0%
‐2.0%
‐3.0%
‐4.0%
‐5.0%
US Real GDP (YoY) 5Y Average 10Y Average 20Y Average IMF Forecast World Bank Forecast
If Tennant is to create substantial shareholder value, management needs to act boldly
Source: Bloomberg, IMF, World Bank
36We Believe The Proposed Merger Will Lead To A Step Change In Margin
Operating Profit
Operating ProfitMargin
Margin vs.vs. Revenues1
Revenues
20.0%
18.0%
16.0%
Tennant + Nilfisk
Operating Profit Margin
14.0%
2013 Target (2010)
12.0%
2017 Target (2014)
• Expected margin in line with
long‐term performance trend
10.0% ‐ only c270bps above past targets
for 2.1x revenues
2013 20152014 2017 inc. IPC + synergies
2007 2016
8.0% 2012
2017 exc IPC 2017 inc. IPC
2006 2011
6.0% 2005 2010 2008
4.0%
500 1,000 2,000
Revenues ($m)
Source: Company Reports ‐ PrimeStone Analysis
Notes:
1 Trendlines exclude the great financial recession and immediate rebound
37Table Of Content
Executive Summary
Strategic Logic For Merging Tennant And Nilfisk
Financial And Shareholder Value Implications Of A Merger
Analysis Of Tennant’s Historical Track Record And Prospects
Drivers Of Future Value Creation
– Benefits Of Global Scale
– Benefits Of Local Scale
Wrap‐up Comments
Appendix
38Benefits Of Global Scale
•1 Improved Bargaining Power With Suppliers
•2 Optimization Of The Manufacturing Strategy And Footprint
•3 Increased Spending In And Higher Efficiency Of R&D
•4 Amortization Of Central G&A Expenses
•5 Improved Access To Capital Markets
391 Improved Bargaining Power With Suppliers
Raw Material & Component Spending1‐4 Comments
800
• Procurement usually delivers significant
700 (18)
24% of total
synergies
600
cost savings – 30% of IPC synergies ($10 million run‐rate) are
500 announced 357
related to procurement and sourcing4
$m
400
(2) 680 662 662
300 74
200 • For Tennant and Nilfisk total spend on raw
326 324 324
100 252 252 materials and components would double to
0 c.$680 million p.a.
Tennant IPC 2016 Tennant IPC Nilfisk T+N PF T+N T+N incl.
2016 PF 2016 Synergies 2016 Synergies Synergies
• IPC raw material cost savings imply 0.74 %
Raw Material Cost Per Unit Index1‐4 savings per unit if total raw material spending is
Raw Material Change Price per Change
increased by 29%
Expense ($m) (%) Unit (per Unit)
Tennant 2016 252 100.00
Tennant + IPC 326 +29% • Applying the IPC ratio to the 170% increase in
IPC Raw Material Synergies
4
2.4 raw material spending in a combination with
Tennant + IPC incl. Synergies 323 99.26 (0.74)
Nilfisk would indicate a potential of $29 million
Nilfisk 357 in expense reduction
Tennant + Nilfisk 680 +170% 95.72 (4.28)
Potential T+N Synergies 29 PrimeStone only assumes a more conservative 3%
cost reduction equivalent to $20 million including
Source: Company Reports, PrimeStone estimates
IPC synergies
Notes:
1 Assuming 55% of Tennant’s COGS related to raw materials & components and applying the same ratio to IPC
2 IPC: EUR186 million revenues, gross margin estimated at 39.5% reconciled from Q3 2017 results
3 Nilfisk raw material & component spending estimated at EUR 300 million FY2016, FX rate for currency conversion: EUR/USD: 1.1885
4 Analysis based on IPC’s expected synergies of $10 million of which 30% are expected to come from procurement (according to Q3 2017 transcript and CFO call), 80% of which are assumed to be related to raw materials & components
402 Optimization Of The Manufacturing Strategy And Footprint
• Combined production footprint offers significant streamlining potential
• Total of 30 manufacturing sites (13 Tennant, 17 Nilfisk) ‐ numerous sub‐scale sites (at least 5 at Nilfisk)
• Underutilized production capacities in main sites (with an opportunity to increase the number of shifts)
• Opportunity to consolidate facilities when scale is important (e.g. vacuum cleaners)
• Opportunity to manufacture closer to customers when proximity is important (e.g. floorcare)
Americas: 20% / ~420 FTEs EMEA: ~50% / ~800 FTEs APAC: 30% / ~900 FTEs
Brooklyn Park, MN; Floorcare Hungary I&II: Full Range Suzhou, China: Full Range
Mukilteo, WA: Extractors Italy I&II: Floorcare&Vacs DongGuan China: Floorcare
Redlands, CA: HPW Denmark I&II: Floorcare&HPW Singapore: HPW [to be closed]
Fort Pierce, FL: HPW Germany: HPW
Mexico: Floorcare Turkey: HPW
South Africa: HPW
Americas: [>50%]
EMEA: >20% APAC: [1‐2 Total COGS Synergy Potential
• The total COGS synergy potential appears consistent with the scale benefits experienced by
selected peers
Plot of Historical COGS As % Of Revenues vs. Revenues ($m)
70.0%
65.0%
60.0%
Tennant + Nilfisk
55.0%
50.0%
45.0%
40.0%
400 800 1,600 3,200 6,400
Tennant Assa Abloy Graco Toro
Source: Company Reports, PrimeStone estimates
Note:
Each dot represents one financial year of reported revenues in USD (converted at average exchange rate) and COGS as a percent of revenues
423 Increased Spending In And Higher Efficiency Of R&D
R&D Spending1‐2 R&D Locations3
90
80 (8)
70
60 46
50
$m
40 82
73 73
30
20 36 36
10
0
Tennant PF 2016 Nilfisk 2016 T+N PF T+N Synergies T+N incl.
Synergies R&D Location Tennant
R&D Location Nilfisk
R&D Spending vs. Revenues Comments
7.5%
• Synergy potential would be significant due to the similar
7.0%
product developments being pursued
6.5% • Capital intensive research such as robotics or telematics
6.0% would benefit from the combined R&D power
5.5%
• Selective complementary research areas for both companies
could be leveraged (e.g. robotics, ionized water)
5.0%
• Doubling in size typically provides no benefit for commodity
4.5%
products to 20‐40% cost saving for R&D intensive businesses
4.0%
• Timeline of full realization depends on product roadmaps
Tennant+Nilfisk
3.5% and could take 3‐4 years
3.0%
500 1,000 2,000 PrimeStone assumes only 10% reduction or $8m,
Tennant + Nilfisk Graco Sartorius
reducing R&D to 3.3% of combined revenues, well within
Source: Company Reports, investor presentations, PrimeStone estimates
Note:
1 Tennant $m R&D expense including IPC, assuming
the current target range of both companies (3‐4%)
2 Nilfisk R&D expense including capitalized R&D, FX rate for currency conversion: EUR/USD: 1.1885
3 Nilfisk R&D locations according to CMD presentation September 2017; Tennant R&D locations according to PrimeStone research
435 Improved Access To Capital Markets
Average Daily Trading Value (6 Month, $m) Credit Profile Enhancement
45 41
“Tennant's B1 CFR reflects the company's relatively moderate revenue
Average Daily Trading Value (6 M, $m)
40
scale, business segment concentration and cyclical nature of its earnings
35 32
counterbalanced by the company's strong market position in the U.S.
30 27 and leading position abroad, debt/EBITDA […].
25
20 The acquisition of IPC is viewed as a credit positive as it enhances
15 12 Tennant's revenue scale, broadens its geographic reach and is
10
6 5 anticipated to contribute favorably to the company's margins and cash
5 3 flow profile”
‐
Jadijhe (Gigi) Adamo, Moody’s Corporate Finance Group (7 April 2017)
Number of Analyst Recommendations Comments
12 12 • The merger will lead to substantially increased liquidity
11 11
and potential inclusion into S&P MidCap 400 Index
Number of Analyst Recommendations
10
• Equity research coverage should improve materially
8
• The investor base will become more international
6 6
6 5 • The combined entity could enjoy credit‐enhancing
4
4 benefits through increased scale and geographical
diversification
2
- Lower cost of capital through better credit profile/rating
0
- Higher financial flexibility and improved covenant
structure
Source: Bloomberg, PrimeStone estimates
Notes:
PrimeStone assumes no benefit at this stage
1 Nilfisk average daily trading value in $million excluding the first 5 trading days (12‐18 October 2017)
2 Industrial ccompanies traded on US stock exchange and domiciled in the U.S.A. with a market capitalisation between $3‐5 billion (as of November 2017)
3 Ccompanies traded on a US stock exchange and domiciled in the U.S.A. with a market capitalisation between $3‐5 billion (as of November 2017)
44Table Of Content
Executive Summary
Strategic Logic For Merging Tennant And Nilfisk
Financial And Shareholder Value Implications Of A Merger
Analysis Of Tennant’s Historical Track Record And Prospects
Drivers Of Future Value Creation
– Benefits Of Global Scale
– Benefits Of Local Scale
Wrap‐up Comments
Appendix
45Benefits Of Local Scale
•1 Improved Reach And Ability To Service Customers Directly
‐ Local Scale, A Driver Of Significant Commercial Outperformance
‐ Density Of Local Sale Force and Service Network A Key Success Factor
‐ Expanded Network To Improve Reach And Service
•2 Ability To Expand Faster In Emerging Markets
•3 Amortization Of Local Infrastructure, Salesforce And Customer Service
461 Local Scale, A Driver Of Significant Commercial Outperformance
• Both Tennant and Nilfisk have delivered very strong long term commercial results in their home regions,
highlighting the value of their
– Local market shares
– In‐house service offerings
– Entrenched salesforce
• Building a competitive in‐house service offering and spare parts infrastructure requires strong local
market share and improves the value proposition to customers for new equipment sales
1
Americas Organic Growth Comparison1 1
EMEA Organic Growth Comparison1
170% 150%
Tennant CAGR 4.2% Tennant CAGR (0.4%)
141%
160%
Nilfisk CAGR 2.1% 153%
157%
140% Nilfisk CAGR 3.2%
134%
133%
150%
144%
130%
140% 123%
121%
129% 120% 118% 117%
130% 117%
125% 116% 116%
122% 121% 121% 112%
118% 118% 110%
120% 110% 108% 108%
113% 112% 113%
111%
108% 105% 102%103%
102% 101%
110% 106% 107% 106% 100%
103% 100% 98%
100% 99% 96% 96%
100% 94%
91%
90%
90%
80% 80%
2005 2006 2007 2008 2009 2010 2011 2012 2013 2014 2015 2016 2005 2006 2007 2008 2009 2010 2011 2012 2013 2014 2015 2016
Tennant Nilfisk Tennant Nilfisk
Source: Company Reports
Note:
1 Compounded organic growth as reported by the company
471 Density Of Local Sales Force And Service Network A Key Success Factor
“It is very difficult for Kaercher or Nilfisk to compete with Tennant in the US, they have to rely on their local
dealers for the service offering. Tennant is facing similar problems in Europe.”
Former Senior Kaercher Employee, >5 years of senior experience in the industry
“Nilfisk hired a lot of sales people in the US, but they are very reliant on distributors to fulfil the service
requirements of direct customers”
Former Senior Tennant Employee, >6 years of senior experience in the industry
“Tennant has never been very strong in Europe, they were losing sales in EMEA due to lack of footprint and
cultural differences”
Former Senior Nilfisk Employee, >15 years of senior experience in the industry
“Kaercher has acquired smaller distributors in the US and gained market share over the last years.”
Former Kaercher Employee, >4 years of experience in the industry
“Kaercher has been extremely aggressive to gain market share since 2011, poaching many sales & service
people globally from other competitors”
Former Senior Nilfisk Employee, >15 years of senior experience in the industry
“Future opportunities are more related to geographic expansion of direct sales & service rather than
product related“
Former Senior Tennant Employee, >10 years of senior experience in the industry
Source: Company Reports, PrimeStone interviews
481 Expanded Network To Improve Reach And Service
• Tennant will be able to leverage Nilfisk’s strong direct sales & service network in EMEA and vice versa
• Global direct service network will double to ~1.600 direct service employees4 in a combined entity with a
very strong coverage of the US and Europe
• Scale will enable to set‐up dedicated service organizations for Industrial and Commercial customers with
tailored service offerings
– Opportunity to improve service quality level and productivity (as per Tennant‘s initiative in Americas)
• Scale will also help increase the service attachment rate for in‐house service
– Opportunity to expand revenues with highly profitable spare parts
1 2
EMEA Tennant Nilfisk Combined
Revenues ($m) 306 557 862
3
Sales Force (FTEs) 140 n.a n.a.
3
Service Force (FTEs) 230 650 880
1 2
Americas Tennant Nilfisk Combined
1 2
Revenues ($m) 638 327 965 APAC Tennant Nilfisk Combined
3
Sales Force (FTEs) 310 n.a n.a. Revenues ($m) 92 96 188
3 3
Service Force (FTEs) 550 44 594 Sales Force (FTEs) 70 n.a n.a.
3
Source: Company Reports, PrimeStone estimates
Service Force (FTEs) 50 39 89
Notes:
1 Tenant revenue figures 2016 pro‐forma including IPC/Florock
2 Nilfisk revenue figures exclude Specialty Professional and Specialty Consumer segments
3 Tennant sales force and service force according to investor presentation, Nilfisk sales force and service force are PrimeStone estimates
4 Excluding potential redundancies
491 Overall, Revenue Opportunities In Americas & EMEA Offset Volumes At Risk
Estimated Revenue Estimated Operating
Comments
Impact ($m) Profit Impact ($m)
• 2016PF combined $838 million indirect revenues in EMEA and Americas1,2
• Assuming Tennant could increase direct sales in EMEA to 53% (mid‐point
between Nilfisk standalone and Tennant)
Shift From Indirect To
25‐35 10‐20 • Assuming Nilfisk could increase direct sales in Americas to 50% (mid‐point
Direct Sales between Tennant standalone and Nilfisk)
• On average 25% gross margin at distributor level applied on additional direct
revenues ($110‐120 million)
• 2016PF combined $965 million revenues in Americas with the potential to
increase Aftermarket attachment rates3
Expansion Of Service & Spare • 2016PF combined $862 million revenues in EMEA with the potential to
Part Sales In EMEA And Positive Positive increase Aftermarket attachment rates3
Americas • Leverage Tennant’s strong service network in the US and vice versa in Europe
• Substantially higher margin on service and spare parts business
• Dedicated salesforce for each market vertical to improve understanding of
Impact Of Specialized Salesforce Positive Positive customer needs
• Positive impact on customer conversion rates
• Increase in total R&D budget would keep competitors at distance in terms of
Impact Of Product innovations
Innovation Lead
Positive Positive • Premium pricing for innovative products
• Follow‐up on service & maintenance through telematics
• Nilfisk “national accounts” in the US roughly $54 million
• Assuming 40‐45% of Nilfisk US national accounts will be lost (~$22‐24 million) and
doubling the amount to account for potential overlaps in other regions
Customer Overlap ‐40‐50 ‐17‐22 • Negative operating profit impact based on 2016PF combined gross margin of 43%
applied to lost revenues
• High switching cost for customers with large fleets (highlighted in HBS Tennant
case study) would probably reduce potential negative revenue impact
• Positive impact expected to outweigh negative effects from customer overlap
Net Effect Positive Positive • Expected IPC revenue synergies of $3 million as a precedent
PrimeStone only takes into account the potential
negative revenue synergies and disregards any
Source: Company Reports, investor presentations, Harvard Business School Tennant Case Study August 2011, PrimeStone estimates
Note:
positive impact at this stage
1 Tennant 2016 PF (incl. IPC) and Nilfisk 2016 Americas revenues of which 75% indirect; FX rate for currency conversion: EUR/USD: 1.1885
2 Assuming 75% of Tennant 2016 EMEA revenues direct, in addition to IPC revenues of which 20% direct and Nilfisk 2016 EMEA revenues of which 55% direct; FX rate for currency conversion: EUR/USD: 1.1885
3 Tennant 2016 PF including IPC, Nilfisk excluding Specialty segments; FX rate for currency conversion: EUR/USD: 1.1885
502 Ability To Expand Faster In Emerging Markets
Country Coverage with Direct Subsidiary Comments
Country Coverage Tennant Nilfisk1,2 NewCo • Tennant and Nilfisk currently only have limited
APAC Revenues (FY2016, $m) 92 96 188 exposure to Emerging markets
China – Nilfisk’s top 5 emerging markets account for 6%
India of group revenues
Malaysia
Peru
Thailand
• We estimate that the majority of LatAm and
Vietnam
LatAm Revenues (FY2016, $m)
3
25‐35 40‐50 65‐85
APAC countries are currently served indirectly
Argentina by both companies
Brazil
Chile
Mexico • A selective direct sales & service approach in
Uruguay
Eastern Europe Revenues (FY2016, $m) n.a. n.a. n.a.
the most promising/sizeable countries could
Romania become feasible
Russia
Slovakia
Turkey • Higher scale and raised profile would help
Total Countries Covered (incl. Export) >80 >100 >100 attract and retain better talent in local markets,
a critical contributor to success
Source: Company Annual Reports 2016, PrimeStone estimates PrimeStone assumes no benefit at this stage
Notes:
1 Nilfisk revenue figures exclude Specialty Professional and Specialty Consumer segments
2 FX rate for currency conversion: EUR/USD: 1.1885
3 LatAm revenues PrimeStone estimate
513 Amortization Of Local Infrastructure, Salesforce And Customer Service
S&A Spending1‐2 Comments
800
700
• Increased sales force presence will improve
(88)
600 effectiveness, notably through specialization by
500 379 end‐markets where scale permits
$m
400
703
300 615 615
200
• Scale will improve sales force and customer
325 325
100 service utilization allowing for significant
0 savings
Tennant PF 2016 Nilfisk 2016 T+N PF T+N Synergies T+N incl.
Synergies
S&A As % of Revenues vs. Revenues ($m) • Local administrative costs will be rationalized
37.5% – Consolidation of overlaps
32.5%
• Overall, the local scale benefits achieved
Tennant+Nilfisk through synergies should be comparable to
27.5%
those realised historically by peers
22.5%
17.5% PrimeStone assumes a reduction of only 12.5% so
as to foster organic growth, resulting in S&A of
12.5%
400 1,600 6,400
27.7% of revenues, in line with Tennant’s mid‐term
Tennant Graco Stanley Black & Decker Toro target (27‐28%)
Source: Company Reports, investor presentations, PrimeStone estimates
Note:
1 Tennant FY2016PF including IPC (converted at EUR/USD 1.1885) and Florock full year impact; adjusted for foreign currency changes as of November 2017
2 Nilfisk financials FY2016; adjusted for foreign currency changes as of November 2017 ; FX rate for currency conversion: EUR/USD: 1.1885
52Table Of Content
Executive Summary
Strategic Logic For Merging Tennant And Nilfisk
Financial And Shareholder Value Implications Of A Merger
Analysis Of Tennant’s Historical Track Record And Prospects
Drivers Of Future Value Creation
– Benefits Of Global Scale
– Benefits Of Local Scale
Wrap‐up Comments
Appendix
532021 Implied Share Price
• We believe the value creation will be far in excess and far more certain than in any standalone plan
Estimated 2021 Share Price ($) And Resulting TSR
Standalone Scenarios Combination with Nilfisk
At 9‐10‐12% Operating Margins1
$164
$160
$144
$140
$134
$120
$107
$100
$88
$80
$78
$63
$60
Past TSR p.a.
$40
Current Share 9.0% Margin 10.0% Margin 12.0% Margin 9.0% + Synergies 10.0% + Synergies 12.0% + Synergies 1‐yr: (17)%
Price 3‐yr: (2)%
TSR 5‐yr: 13%
p.a. 5% 9% 14% 21% 23% 27%
10‐yr: 5%
Source: Company Reports, Bloomberg, PrimeStone estimates
Note: PrimeStone share price estimated based on 20x P/E multiple, which is below current levels. Share price estimates assume no dividend paid over the period
1 9‐10‐12% operating margins applied to both Tennant and Nilfisk as described on slide “Key Transaction Assumptions”
54You can also read