Performance update: Q1-FY2021 - ICICI Bank

Page created by Rafael Clarke
 
CONTINUE READING
Performance update: Q1-FY2021 - ICICI Bank
Performance update:
Q1-FY2021

July 21, 2020
Performance update: Q1-FY2021 - ICICI Bank
Agenda

• Company strategy and performance
• Opportunity
• Industry overview
Performance update: Q1-FY2021 - ICICI Bank
Risk management
           Resilient Balance Sheet                                Insurance risks

 • Linked & Par (82% of liabilities) largely        • Mortality:
   pass on the market performance to                   • Experience continues to be better
   customers                                              than assumptions
 • Non par guaranteed return book: 0.4%                • 69 claims from COVID-19 so far
   of liabilities; minimal ALM mismatch                • Additional reserve held for potential
                                                          COVID-19 claims
 • 94.3% of fixed income in sovereign or
                                                    • Persistency: Range-bound movements
   AAA; 0.9% of fixed income below AA
                                                      despite challenged environment
 • Zero NPA since inception                         • Expense: Closer monitoring with focus
                                                      on variabalisation

                            Solvency ratio of 205.1% at June 30, 2020

                                                                                                 3
Performance update: Q1-FY2021 - ICICI Bank
Agenda

• Company strategy and performance
• Opportunity
• Industry overview
Performance update: Q1-FY2021 - ICICI Bank
Key strategic elements

                               Protection

    Customer                                                Aspiration to
     centricity     Premium                                  double the
                              VNB Growth     Persistency
  continues to be    Growth                                FY2019 VNB in
    at the core                                              3 - 4 years

                              Productivity

                                                                            5
Strategic elements (1/4)
                    •   Deepen penetration in under-served customer segments
                    •   Enhance current distribution
   Premium
                    •   Create new distribution
    growth
                    •   Augment capability in Health and Protection
                    •   Increase focus on Pension and Annuity

        ` billion                                                   FY2020     Q1-FY2021
        APE1                                                          73.81         8.23
        YoY growth                                                    (5.4%)     (44.0%)
        New business premium2                                         123.48       14.99
        YoY growth                                                    20.4%      (32.6%)

                             1.   Annualized premium equivalent
                             2.   Received premium for retail and group
                                                                                           6
Strategic elements (2/4)
  Protection
                    Continue to grow both retail and group lines of business
    focus

        ` billion                            FY2020      Q1-FY2021
        Protection APE                         11.16            2.14
        YoY growth                            54.6%            0.0%
        Protection mix                        15.1%           26.0%

                                                                               7
Strategic elements (3/4)

  Persistency        Improve persistency across all cohorts

        Persistency1                               11M-FY2020                         2M-FY2021
        13th month                                             83.2%                           81.8%
        49th month                                             64.6%                           63.9%

                            1.   Retail excluding SP computed as per IRDAI circular dated January 23, 2014

                                                                                                             8
Strategic elements (4/4)
                  Continue to leverage technology for process re-
 Productivity     engineering and to drive productivity

  ` billion              Q1-FY2020                                  FY2020                        Q1-FY2021

  Cost/TWRP1                      17.0%                               15.9%                            14.8%

  Cost/TWRP
                                  11.3%                               10.4%                            8.8%
  (savings LOB)

                         1.   Total cost including commission/(Total premium- 90% of single premium)

                                                                                                               9
Value of New Business

  ` billion        Q1-FY2020                                    FY2020                         Q1-FY2021

 Value of New
                                 3.09                                16.05                                   2.01
 Business (VNB)1

 VNB margin                 21.0%                                  21.7%                                 24.4%

                    1.   For full year, based on actual cost; Q1: based on management forecast of full year cost

                                                                                                                    10
Way forward
Voice of our stakeholders
I want to have a life cover but   Will my life insurance policy        How do I know fund value of
                                                                                                     How do I file a life insurance
     am wary of meeting                 cover me against               my ULIP plan & pay renewal
                                                                                                                claim?
    someone face to face                  coronavirus?                   premium of my policy?

                                                              Customers

                                                                        Will my business earnings       With the current travel
 Customers are unwilling to       Will I be able to service my
                                                                         be affected due to the       restrictions how do I keep
 meet face to face, how can         customers during this
                                                                           prevailing lockdown          myself updated on the
  I still interact with them?         COVID-19 scenario?
                                                                               conditions?                     processes?

                                                             Distributors

   As a manager, how do I           How do I train my team               Due to restricted travel,   How do I track efficiency of
  ensure safety of my team           members on the new                  how do I communicate          my team members and
   members in the current          products and coronavirus             with my team and conduct      service my customers in
    COVID-19 scenario?                related advisories?                    joint field work?        the lockdown scenario?

                                                              Employees

                                                                                                                               12
The new normal: Physical handshake to virtual handshake

                   Our collaboration platform

                                                          13
Collaboration with customers for presales & onboarding
 Share screen for                                                           UPI/BBPS, Credit card,
 • Suitability analysis                                                     Debit card, Netbanking,
 • Quote generation                                                         eWallet options
 • Completing the                                                           available
   onboarding journey
                                                                            Share documents and
                                                                            chat with customer.
 Customer, financial                                                        Customers can also
 consultant and expert                                                      upload KYC
 added on same call                                                         documents/photo

   Online meetings (upto 250 users) | Video/Audio call | Joint sales call | Share content Chat |
          Invite external guests, experts | Access previous meeting notes | Record sessions
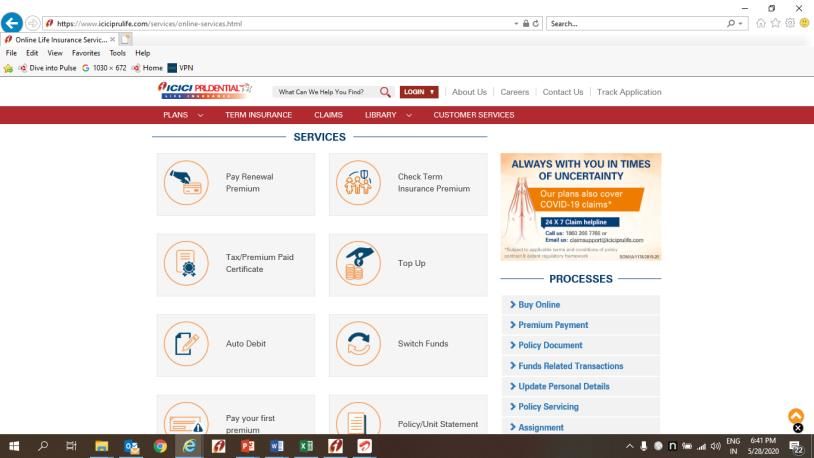
                                                                                                   14
Collaboration with customers for servicing requirements

 Pay renewal premium
                                                                   Switch funds

 Tax certificate
                                                                   Policy/unit statement
 Set auto debit mandate
                                                                   Service assistant
 WhatsApp for                                                      chatbot LiGo for
 requesting policy                                                 service resolution
 related statements

 • An easy access to a variety of self-service options
 • Service requirements met from the comfort of customers’ homes

                                                                                           15
Stakeholders’ concerns addressed
I want to have a life cover but   Will my life insurance policy   How do I know fund value of
                                                                                                How do I file a life insurance
     am wary of meeting                 cover me against          my ULIP plan & pay renewal
                                                                                                           claim?
    someone face to face                  coronavirus?              premium of my policy?

       Live video chat                  Product feature               Self-service options        Online claim intimation

                                                                   Will my business earnings       With the current travel
 Customers are unwilling to       Will I be able to service my
                                                                    be affected due to the       restrictions how do I keep
 meet face to face, how can         customers during this
                                                                      prevailing lockdown          myself updated on the
  I still interact with them?         COVID-19 scenario?
                                                                          conditions?                     processes?

   Collaboration platform           Online service options           Digital selling options        e-Learning modules

   As a manager, how do I           How do I train my team          Due to restricted travel,   How do I track efficiency of
  ensure safety of my team           members on the new             how do I communicate          my team members and
   members in the current          products and coronavirus        with my team and conduct      service my customers in
    COVID-19 scenario?                related advisories?               joint field work?        the lockdown scenario?

    Contactless meetings                Learning videos             Live video meets & chats     Real time service support

                                                                                                                          16
Protection opportunity
                Sum Assured as a % of GDP1,2                                               Addressable population# coverage3 (%)
   273%
             252%    251%

                                                                                                                                        10%

                              142%
                                        131%
                                                 113%

                                                               19%

 Singapore   Japan    USA    Malaysia   South   Thailand      India*
                                        Korea
 * For retail protection sum assured (company estimates)                           # Based on Income Tax Department data for individuals
                                                                                   (annual income > 2.5 lac) and company estimates

                                                   1.      As of FY2020 for India (GDP Source: National Statistics Office, protection sum assured source:
                                                           company estimates)
                                                   2.      As of FY2018 for US, Japan, South Korea. Others as of FY2017 (Source: McKinsey estimates)
                                                   3.      Addressable population coverage= Inforce number of lives for retail protection/ No. of returns with
                                                           income >2.5 lac                                                                                       17
Opportunity: Sum assured as a % of GDP
             Sum Assured (SA) as a % of GDP:
            Assuming SA growth @ 20% CAGR                                               Sum Assured as a % of GDP1,2
                                                75%                   273%
                                                                                 252%     251%

                                 45%                                                                             India: FY2035
                   30%
    19%

                                                                                                    145%      142%
                                                                                                                        131%
   FY2020         FY2025        FY2030         FY2035                                                                             113%

             Sum Assured (SA) as a % of GDP:                                                                                                    75%
            Assuming SA growth @ 25% CAGR
                                               145%                                                                                                   19%

                                70%

                  35%
   19%

                                                                  * For retail protection sum assured (company estimates)
  FY2020         FY2025        FY2030          FY2035

                                          1.    FY2020 GDP data for India (Source: National Statistics Office, protection sum assured source:
                                                company estimates)
                                          2.    As of FY2018 for US, Japan, South Korea. Others as of FY2017 (Source: McKinsey estimates)             18
Opportunity: Addressable population coverage (%)
With 15% CAGR in new policy count from FY2020 to FY2035         With 20% CAGR in new policy count from FY2020 to FY2035

                                              250.8                                                               250.8

                                 170.7                                                                   170.7

                    106.0                                                                    106.0

       57.5                                                               57.5
                                                                                                                   115.7
                                               69.9
                                                                                                         46.1
                                 34.1
        6           15.8                                                    6                 17.8

      FY2020       FY2025       FY2030       FY2035                      FY2020             FY2025      FY2030    FY2035
                  Insured    Uninsured                                                     Insured    Uninsured

                                           Assumed 10% lapse rate for inforce policies at each year                        19
Key strategic elements

                               Protection

    Customer                                                Aspiration to
     centricity     Premium                                  double the
                              VNB Growth     Persistency
  continues to be    Growth                                FY2019 VNB in
    at the core                                              3 - 4 years

                              Productivity

                                                                            20
4P: Premium
Products available across all categories

                      Non-linked                        Savings                        Linked

    Participating with             Savings with                     ULIP: Suite of funds        ULIP: with capital
          equity                    guarantee;                      for Equity and Debt            guarantee
                                     Annuity

                         Retail                        Protection                      Group

     Pure term with                Critical illness,                Pure term, Micro insurance, Credit insurance,
     accident cover               Disease specific                                 Critical illness

                                                                                                                 20
Product segments                                                        • Deepen penetration in under-served customer
                                                                          segments
                                                     Premium            • Enhance current distribution
                                                      growth            • Create new distribution
                                                                        • Augment capability in Health and Protection
                                                                        • Increase focus on Pension and Annuity

                           APE (` billion)                                                                  Mix
Segments                 FY2020         Q1-FY2021                Growth (%)                        FY2020         Q1-FY2021
Savings                    62.65                  6.09                 (51.5%)                     84.9%             74.0%
  Linked                   47.72                  3.59                 (65.7%)                     64.7%             43.6%
  Non-linked               12.46                  2.01                   14.2%                     16.9%             24.4%
  Group                     2.47                  0.49                   44.1%                      3.3%              6.0%
Protection1                11.16                  2.14                     0.0%                    15.1%             26.0%
Total APE                  73.81                  8.23                 (44.0%)                     100.0%           100.0%

          Linked segment significantly challenged; steady growth in other product segments
                                     1. Protection includes retail and group protection products
                                     Total may not add up due to rounding off
                                                                                                                              23
Diversified distribution
                                                   Strategy: Create depth and add width
                                                   • > 500 partnerships
           Strategy: Build profitability                                                                   Strategy: Digital focused upsell
                                                   • Protection and non-linked savings:
           • 15 bank partnerships                    ~80% in FY2020                                        campaigns
           • Protection and Annuity mix                                                                     • Analytics driven upsell channel
             increased from 4.3% in FY2019                                                                  • Diversified product mix with 12%
             to 10.0% in FY2020                                                                               protection and 22% non-linked
                                                                  Partnership
                                                                  Distribution                                savings

Strategy: Invest and grow
 • 23,200 agents recruited                                                                                              Strategy: Partner with non-
   during FY2020                                                                                                        traditional distributors

                                                                                                         Emerging eco
 • Diversified product mix:                                                                                             • Tie-up with small finance

                                                                                                           systems
                                    Agency

   Savings: linked 50%,                                                                                                   banks, wallets, payment
   savings: non-linked 40%                                                                                                banks, aggregators etc.
   and Protection 10%                                          Distribution                                             • Product customization

                                             Distribution tie-up with IDFC First Bank

                                                 Figures mentioned are for FY2020
                                                 * Direct distribution means sales through own website and employees on roll                          24
Distribution channels                                                    • Deepen penetration in under-served customer
                                                                           segments
                                                     Premium             • Enhance current distribution
                                                      growth             • Create new distribution
                                                                         • Augment capability in Health and Protection
                                                                         • Increase focus on Pension and Annuity

                              APE (` billion)                           Mix (%)                       Growth (%)
Channels                   FY2020      Q1-FY2021                 FY2020         Q1-FY2021          Linked     Non-linked
Bancassurance                37.48               3.26             50.8%             39.6%         (65.6%)          11.5%
Agency                       15.62               2.03             21.2%             24.7%         (67.0%)          18.8%
Direct                        9.31               1.01             12.6%             12.3%         (64.0%)            4.1%
Partnership distribution      5.46               0.71               7.4%             8.6%         (68.2%)         (19.2%)
Group                         5.94               1.23               8.1%            14.9%                 -              -
Total APE                    73.81               8.23            100.0%           100.0%          (62.2%)            4.2%

                           Diversified distribution mix; retail share 85%
                                     Total may not add up due to rounding off

                                                                                                                         25
4P: Protection
Protection growth                     Protection
                                       growth
                                                       Continue to grow both retail and group lines
                                                       of business

      APE (` billion)

                             11.16

                 7.22

                                                     2.14                 2.14

                FY2019       FY2020                Q1-FY2020           Q1-FY2021

          Steady performance despite challenges on medical examination

                                                                                                      27
4P: Persistency
Persistency
        Retail excluding single premium                               Retail including single premium

  Month           11M-FY2020      2M-FY2021                Month                11M-FY2020      2M-FY2021

  13th month            83.2%             81.8%            13th month                85.3%              84.1%

  25th month            75.1%             73.4%            25th month                77.4%              76.3%

  37th month            66.7%             65.4%            37th month                69.0%              67.8%

  49th month            64.6%             63.9%            49th month                66.4%              66.2%

  61st month            56.0%             56.8%            61st month                57.4%              58.2%

          Movements within a narrow range; significant increase for protection segment

                                 As per IRDAI circular dated January 23, 2014

                                                                                                                29
4P: Productivity
Productivity: Cost efficiency
                                                               Q1-FY2020                           FY2020                  Q1-FY2021
Expense ratio (excl. commission)1                                       11.9%                         10.3%                         10.5%
Commission ratio2                                                         5.1%                          5.7%                          4.2%
Cost/TWRP3                                                              17.0%                         15.9%                         14.8%
Cost/Average AUM4                                                         2.3%                          2.9%                          1.8%
 Cost/TWRP (Savings LOB)                                               11.3%                         10.4%                           8.8%
                        ` billion                                                      44.71

                                                                                        28.85
                       Commission
                       Non Commission                      9.20                                                    7.19
                                                            6.43                        15.86
                                                                                                                    5.12
                                                            2.77                                                    2.07

                                                       Q1-FY2020                     FY2020                    Q1-FY2021

             • 97% of new business applications initiated via digital platform
             • 93% of service requests through self service modules
                                    1.   Expense ratio: All insurance expenses (excl. commission)/(Total premium- 90% of single premium)
                                    2.   Commission ratio: Commission/(Total premium- 90% of single premium)
                                    3.   Cost/(Total premium- 90% of single premium)
                                    4.   Annualized cost/Average assets under management during the period                                  31
                                    Total may not add up due to rounding off
VNB growth levers update (4P’s)
` billion                                      Q1-FY2020                              FY2020                  Q1-FY2021
Value of New Business (VNB)1                                3.09                          16.05                             2.01
VNB margin                                              21.0%                           21.7%                           24.4%

` billion                                              FY2020                  Q1-FY2021                               Growth
Premium growth (APE)                                       73.81                             8.23                     (44.0%)
Protection growth (APE)                                    11.16                             2.14                           0.0%
Persistency (13th month)2                              83.2%3                            81.8%                               NA
Persistency (49th month)2                              64.6%3                            63.9%                               NA
Productivity (Cost/TWRP: Savings)4                       10.4%                             8.8%                              NA
                               1. For full year, based on actual cost; Q1: based on management forecast of full year cost
                               2. Retail excluding SP computed as per IRDA circular dated January 23, 2014
                               3. 11M-FY2020
                               4. Total Cost including commission / (Total premium – 90% of single premium)                        32
                               Components may not add up to the totals due to rounding off
Financial update
Financial metrics
` billion                           Q1-FY2020                          FY2020     Q1-FY2021

Profit after Tax                               2.85                       10.69        2.88

Solvency ratio                               217%                         194%      205.1%

AUM                                    1,640.241                    1,529.682      1,700.061

                    1. At June 30 of respective years
                    2. At March 31, 2020
                    Components may not add up to the totals due to rounding off                34
Embedded Value (EV)1
  ` billion
                                                                         230.30
               216.23

                                                                         78.43
               73.54

               142.69                                                    151.87

               Mar-19                                                    Mar-20
                Value of Inforce (VIF)           Adjusted net worth (ANW)

                        1.   As per Indian Embedded value (IEV) method

                                                                                  35
Analysis of movement in EV1
` billion                                                      FY2016           FY2017          FY2018          FY2019          FY2020
Opening EV                                                     137.212           139.39          161.84          187.88          216.23
     Unwind                                                       12.58           12.21            13.72           15.84           17.25
     Value of New Business (VNB)                                   4.12             6.66           12.86           13.28           16.05
     Operating assumption changes                                 1.042             1.00            7.64            4.20         (2.25)3
     Operating variance                                            4.48             3.08            2.58            4.69            1.83
            Persistency variance                                    2.01             0.99            1.53            2.66            0.85
            Mortality and morbidity variance                        0.79             0.98            0.78            1.97            0.42
            Expense variance                                        0.59             0.35            0.27            0.04            0.01
            Other variance                                          1.09             0.76            0.00            0.02            0.56
EVOP                                                              22.23           22.95            36.80           38.01           32.88
Return on embedded value (ROEV)                                  16.2%           16.5%            22.7%          20.2%           15.2%
     Economic assumption change and
                                                                  (5.64)            5.82            1.13          (1.22)         (14.76)
     investment variance
     Net capital injection                                      (14.41)           (6.32)         (11.88)          (8.43)          (4.05)
Closing EV                                                      139.39           161.84          187.88          216.23          230.30
                                               1. As per Indian Embedded Value (IEV) method
                                               2. Difference of FY2015 closing EV & FY2016 opening EV shown as operating assumption change
                                               3. Negative impact of ` 5.49 billion due to change in effective tax rate
                                                                                                                                             36
                                               Components may not add up to the totals due to rounding off
Sensitivity analysis
 Scenario                                     % change in VNB           % change in EV
                                              FY2019       FY2020       FY2019      FY2020
 Increase in 100 bps in the reference rates     (4.3)           (2.4)     (2.0)          (2.5)
 Decrease in 100 bps in the reference rates       4.4            2.2       2.0            2.6
 10% increase in the discontinuance rates       (8.5)           (5.0)     (1.3)          (1.1)
 10% decrease in the discontinuance rates         8.9            5.1       1.4            1.1
 10% increase in mortality/morbidity rates      (9.4)           (9.5)     (1.4)          (1.6)
 10% decrease in mortality/morbidity rates        9.4            9.6       1.4            1.7
 10% increase in acquisition expenses          (13.0)       (11.6)         Nil            Nil
 10% decrease in acquisition expenses            13.0           11.6       Nil            Nil
 10% increase in maintenance expenses           (3.6)           (3.0)     (0.9)          (0.8)
 10% decrease in maintenance expenses             3.6            3.0       0.9            0.9
 Tax rates increased to 25%                     (7.5)       (11.4)        (4.0)          (5.8)
 10% increase in equity values                    NA             0.7       NA             1.8
 10% decrease in equity values                    NA            (0.7)      NA            (1.8)

                                                                                                 37
Technology initiatives
Objectives
To be the most admired digitally enabled insurer
• Empower customers and distributors with simplified journeys and choice of
  platforms
• Decongest processes by leveraging ecosystems and emerging technologies
• Enable servicing anytime, anywhere
• Drive adoption through superior experience
• Establish industry leading benchmarks

   Strengthen the                                            Support new
                                 Be future ready
        core                                                growth engines

                                                                              39
Digital evolution path to maturity
     2011-2013                     2013-2015                                            2015-2018                       2018-2020
            1                            2                                                      3                              4
 Build digital foundation   Digitize onboarding and service                        Leverage ecosystem                   Market leadership
  Optimize processes         Build seamless presentation                   Collaborate with internal stakeholders      IT as an enabler for
      and systems                        layer                                  And partners for enhancing             Business innovation
                                                                                experience and productivity

                                • Process
   • Process re-                                                                  • Integrate internal,             • Seamless AI, ML,
                                  automation
     engineering                                                                    Partner systems                   NLP interventions
                                • Build seamless                                    and external                      in the journey
   • Technology
                                  presentation                                      ecosystems
     architecture                                                                                                   • Enhance
                                  layer
   • Service                                                                      • Provide frictionless              experience and
                                • Integration                                       journey                           productivity
     architecture
                                  architecture

      End to end digitalization of journeys                                Leverage ecosystems and tech advancements

                                                 AI : Artificial Intelligence| ML : Machine Learning
                                                 NLP : Natural Language Processing
                                                                                                                                              40
Pre sales

            Suitability                                Lead Management                                 Customer
             analysis                                       System                                      Profiler

      Product recommendation                            Enhanced with voice
                                                                                                   Know customer better
      based on customer’s life                           capability and geo
                                                                                                  through social platforms
      stage, goal, risk appetite                             tagging

         Nudge                         Cognitive                               Learners                          My
        engines                          BOTs                                    Box                            Coach

                                                                           On-the-go e-learning          AI platform for video
  Prompt for appropriate           24x7 query resolution                                                 based library creation
                                                                           modules and video
          action                      using chat bots                                                      for sales pitches
                                                                           based sales pitches

                                            AI : Artificial Intelligence

                                                                                                                             41
Onboarding and issuance

     Flexible/paperless                                                                      Instant document
                                                    PASA
        on-boarding                                                                          verification (OCR)

     Platform agnostic and                No medical or income                              Real time identification
       paperless journey                 document requirement                                 and verification of
    available for all channels          for smoother onboarding                                   documents

      Robotic enabled                         Tele/video                                         AI assisted
         issuance                            underwriting                                       underwriting

                                                                                           Empowers underwriters
     Robotic processing for             Improves efficiency and
                                                                                            with comprehensive
        faster issuance                  reduces issuance TAT
                                                                                                  insights

                                 PASA : Pre Approved Sum Assured | OCR : Optical Character Reader
                                 TAT : Turn Around Time | AI : Artificial Intelligence
                                                                                                                       42
Customer servicing and claims (1/2)

          Anytime..                           Premium                                              Intuitive/visual
         ..Anywhere                       premium payment                                                 IVR

      87% transactions self                                                                      Helps customers avoid
                                         74% renewal premium
     serviced, omni channel                                                                        IVR queues. Saves
                                       through electronic modes
           experience                                                                             50% navigation time

         Service bot                                                                                  AI based
                                               WhatsApp
            LiGo                                                                                 Claims Processing

    1.96 mn queries resolved           First life insurer to get                                  AI based pre-claim
    by Chatbot LiGo with 91%          business verified account                                   assessment & claim
            accuracy                    1.39 mn transactions                                          processing

                               IVR : Interactive Voice Response | AI : Artificial Intelligence
                               Data For FY2020
                                                                                                                         43
Customer servicing and claims (2/2)

           Annuity                                  Digilocker             Customer
           service                                 integration               app

    Simplifying journey for               View or download policy     Customer service native
    Annuity customers with                    document from               app with in-app
     digital life verification                DigiLocker app           nudges/notifications

     Bot orchestration                           WhatsApp
                                                                           Humanoid
           layer                                   bot

    Universal Bot with voice                  Available for all       AI based conversational
    capability to cater to all             customers with same       tool deployed for renewal
         touch-points                      functionalities as LiGo   premium reminder calling

                                 App : Application
                                 AI : Artificial Intelligence
                                                                                                 44
Marketing and lead generation

        Rank high on                 Segmented                     Hyper
       online searches                targeting                personalisation

    Machine learning used to   Reaching the customer by     Personalized messaging
     rank us higher when        mapping their interests      to engage customers
       customers search              and affinities           throughout journey

            Selfie                   Truecaller
                                                                 Co-browsing
            quote                   integration

                                                              Instant screen share
    AI backed quote based on
                                Facilitate auto form fill   available for assistance in
        facial recognition
                                                                     form fill

                                                                                          45
Partner integration

         Process                                        Flexible                                 Web
      simplification                                  integration                                portal

      Superior customer                       Modular integration as                     Self service module for
         experience                          per the choice of partners                      Group business

                                 Easy                                     Customer
                                  UI                                       service

                          Pre-coded pages for                          Enabling customer
                           quicker integration                      service on partner portals

                                        UI : User Interface
                                                                                                                   46
Analytics

          Actionable                                       Data                                       Smart
           insights                                      modelling                                   solutions

    Accelerate sales, enhance                      Customer interaction                      Pre approved life cover;
     customer experience &                         based segmentation,                         provide best offer to
         personalization                            propensity, nudges                              customer

                          Google Big Query,                                    Data lake
                          Hadoop, Python                                       solution

                           Using best technology                         Use of AI & ML to analyse
                          available to process the                       structured & unstructured
                                    data                                            data

                                          AI : Artificial Intelligence
                                          ML : Machine Learning                                                         47
ESG
         Environmental
         Environmental

Social
Social

          Governance
           Governance
Environmental initiatives
                                Preserving ‘Mother Earth’ for future generations

            Replace                                     Reduce                       Reuse & Recycle

• End to end digital solutions for     • 3/5 star rated ACs in all offices    • Sewage treatment plant and
  our business activities              • VRF AC systems (20% of usage)          wet waste conversion into
• 84% shareholders                     • LED technology: 54% of branch          manure at head office
  communicated digitally                 lighting, 47% of backlit signage     • No single use plastic
• Video conferencing facility at 94    • Managed print services &             • E-waste disposal through
  locations                              stationery tracking                    government certified vendors
• Live plants to improve air           • Food wastage awareness drive         • Reusable glasses & plates
  quality: ~31% office space           • Sensor based taps & urinals
                                       • Periodic office equipment
                                         maintenance

                                       VRF: Variable Refrigerant Flow
                                                                                                             49
Social initiatives
                               Building communities and giving back to society

    Business itself is social in nature: Serving long term financial and protection needs of the society

      Customer centricity                  Commitment to employees                                Community service

• Products across life stage needs;   • Gender neutrality, equal                       • 3.9 mn lives insured from rural
  multi- channel reach                  opportunity, POSH policy                         /social sector and PMJJBY5
• Digital enablers provide 24x7       • Supportive policies including                  • ICICI Academy for Skills: Trained
  service; 87% self-help usage          women centric, Whistleblower                     25,000 youth (145,400 till date)
• Consistent risk-adjusted returns    • Learning & growth programs at                  • Rural livelihood training:76,400
                                        all levels                                       youth (275,200 till date)
• Grievance redressal policy
                                      • 85% of SMT served >10 yrs                      • Much needed long term capital
• 13th month persistency: 85.3%
                                      • Responsible behavior: Privacy,                   for infrastructure and housing
• COVID-19: Un-interrupted              Anti-corruption
  service including claims                                                             • COVID-19: Provision of
                                      • ~100% WFH during COVID19                         ventilators and consumables
                                      POSH : Prevention of sexual harassment to women at workplace;
                                      SMT: Senior management team; WFH: Work from home
                                      PMJJBY: Pradhan Mantri Jeevan Jyoti Beema Yojana                                      50
Governance
  Transparency in functioning with separation of supervision from execution

 Awarded for Corporate Governance; scorecard by IFC, BSE limited and IiAS

01   Supervisory structure          02 Compliance, Risk & IA                              03          Ethical practices
 • Diverse Board composition         • Quarterly compliance                                 • Framework for managing
 • 50% IDs including Chairman          certificate to the Board                               Conflict of Interest
 • Board committees comprise         • Risk policy: Investment,                             • Guidelines for Acceptance of
   majority of IDs/ NEDs; and          Insurance & Operational risk                           Gifts, Entertainment and
   chaired by IDs                    • Risk-based IA framework                                Sponsored travels
 • Evaluation framework for          • WTDs’ compensation aligned                           • Policies on Anti-Money
   Directors, Chairman, Board          to KPI; includes malus &                               Laundering, Anti Bribery/
   and its Committees                  claw-back                                              Corruption, Privacy policy,
 • Policy on Board diversity &       • ISO 22301:2012 certification                           Whistleblowing
   criteria on appointment of          for the BCM                                          • Stewardship Code
   Directors; regulatory norms       • Investment policy for
   on “Fit and proper”                 governance & operations

                                   IDs: Independent Directors, NEDs: Non- executive Directors, WTD: Whole time Directors
                                   IA: Internal Audit; BCM: Business continuity management
                                                                                                                            51
                                   IFC: International Finance Corporation, IiAS: Institutional Investor Advisory Services
Agenda

• Company strategy and performance
• Opportunity
• Industry overview
Favorable demography
                        Large and growing population base1                                                                                          High share of working population1
  2019 Population (mn)                                                                                                                 Population of age 25-59 years (in mn)
                                                                                                       1366         1434
                                                                                                                                                                                                            727
                                                                                                                                                           578

                                                                       271             329
                                   127         146         211
    51                59

                                                                                                                        China
                                                           Brazil
                      S Africa

                                               Russia

                                                                                           USA
                                    Japan

                                                                        Indonesia

                                                                                                        India
    S Korea

                                                                                                                                                           2015                                             2030

                                            Driving GDP growth 2                                                                                                           Rising affluence2
              7.7% 7.9%                                 7.4%
                                                                8.0% 8.2%
                                                                                    7.2%
                                                                                                                                       GDP per capita CAGR
                                 5.2% 5.5%
                                               6.4%                                        6.1%                         6.0%            (FY2009-FY2019)
  4.8%
              4.2%                                                                  3.8% 3.6% 4.2%
                                                                                                                                                                                                                           10.9%
                                 3.1%                                                                                           5.4%
                                        2.5% 2.7% 2.8% 2.9% 2.6%                                 2.9%
                                                                                                                                                                                                                  7.3%
  1.9%                                                                                                                                                                                         6.0%
                                                                                                                                                                                       4.4%
                                                                                                                                                                              2.6%
  FY02        FY08    FY10       FY12   FY13   FY14     FY15    FY16   FY17         FY18    FY19 FY20E FY21E FY22E                      -0.3%     0.0%        0.1%
                     -1.7%

                                                                                                                                                   Japan

                                                                                                                                                                               U.S.A

                                                                                                                                                                                                                   India
                                                                                                                                         Russia

                                                                                                                                                                  Brazil

                                                                                                                                                                                       South

                                                                                                                                                                                                                            China
                                                                                                                                                                                                Indonesia
                                                                                                                                                                                       Korea
                                                                                                      -4.5%

                                                        India          World
                                                                                                                -4.9%

                                                                                                 1.     Source: UN population division
                                                                                                 2.     Source: WEO Update, June 2020
                                                                                                                                                                                                                                    53
Financialisation of savings: Opportunity for insurance
                                  Household savings1                                                      Distribution of financial savings (excluding currency)2
       90                 69%                                                                      70%
                                                                                             64%
       70                           60%                            61%                             60%
                                                                                                                                     23.8%
` tn

                54%                                                            55%                                                            19.0%
                          52%                           52%                                        50%             25.1%                               18.8%
                                    48%                                                                                                                         26.7%             20.3%
       50                                     45%                  45%                                                      29.0%
                44%                                                                                                                                                      20.5%
                                                                             37%         38% 40%          16.0%
                                                                                                                                                                                           23.3%
       30                                               36%
                                                                                     18.09
                                              31% 15.59       13.64      16.53               30%
                                 8.56     14.23
       10   2.98       5.38                                                          18.70
                                 9.90     9.33    12.57       14.96      14.38                     20%
            2.86       7.72
   -10      -0.52     -1.88     -2.03     -2.90     -3.77     (3.91)     -4.69        -7.41        10%
            FY2002    FY2008    FY2010    FY2012    FY2015    FY2016     FY2017      FY2018
   -30                                                                                             0%     FY2002   FY2008   FY2010   FY2012   FY2013   FY2014   FY2015   FY2016   FY2017   FY2018
                         Physical savings
                                                                                                                                       Provident / Pension Fund / Claims on Govt
                         Gross financial savings
                                                                                                                                       Shares / Debentures / MFS
                         Household borrowings
                         Gross Financial savings as a % of Household Savings                                                           Life Insurance Fund
                         Net Financial savings as a % of Household Savings                                                             Deposits

                                                       FY2002 FY2008 FY2010                               FY2012            FY2014            FY2018            FY2019             FY2020
       Life insurance premium3
                                                             2.1%              4.0%                4.1%      3.3%              2.8%               2.7%              2.7%               2.8%
       as % of GDP

                    • Financialisation of savings aided by Direct Benefit Transfer, RERA and GST

                                                                          1.      Source: RBI and CSO
                                                                          2.      Source: RBI
                                                                          3.      Total life insurance industry premium including renewal; Source: IRDAI                                            54
Protection opportunity: Where we are…
    Sum Assured as a % of GDP1,2                          Addressable population#
                                                                                                                                        Protection gap(%) 4,5
 273%
                                                              coverage3 (%)
        252% 251%
                                                                                                                            92   56      85     33     73     78    73     56

                                                                                                                      8.56
                                                                                           10%
                      142%    131%                                                                                               6.58
                                     113%                                                                                               5.30

                                                                                                             USD trillion
                                               19%                                                                                             1.09   0.79   0.77   0.52   0.40

* For retail protection sum assured (company               #Based on Income Tax Department
estimates)                                                 data for individuals (annual income
                                                           > 2.5 lac) and company estimates

                                                     1.   As of FY2020 for India (GDP Source: National Statistics Office, protection sum assured source: company estimates)
                                                     2.   As of FY2018 for US, Japan, South Korea. Others as of FY2017 (Source: McKinsey estimates)
                                                     3.   Addressable population coverage= Inforce no. of lives for retail protection/ No. of returns with income >2.5 lac
                                                     4.   Protection gap (%): Ratio of protection lacking/protection needed
                                                     5.   Source: Swiss Re, Economic Research and Consulting 2015                                                        55
Protection opportunity: Liability cover
  ` billion                                    Retail Credit

                                                                                                         25,537
                                                                                                22,207
                                                                              19,085
                                                             16,200                                      12,147
                                             13,922                                             10,606
                               11,663                                          9,339
              8,976   10,097                                   7,599
                                              6,454
                      4,711    5,378
              4,409                                                                             11,601   13,390
                                              7,468            8,601           9,746
              4,567   5,386    6,285

          Mar-13      Mar-14   Mar-15        Mar-16           Mar-17          Mar-18            Mar-19   Mar-20
                                              Home Loans        Others

  • Retail credit has been growing at a healthy pace
  • Credit life is voluntary

                                  Source: RBI
                                  Components may not add up to the totals due to rounding off
                                                                                                                  56
Protection opportunity
Gross direct premium (` billion)                                    FY2009                  FY2020   CAGR
Health                                                                 66.23                516.38   20.5%
Motor                                                                138.21                 692.08   15.8%
   - Motor Own Damage (OD)                                             87.56                265.52   10.6%
   - Motor Third Party (TP)                                            50.65                426.56   21.4%

• Protection premium ~ ` 200 billion for life insurance industry in FY2020

                                   Source: General Insurance Council and company estimate

                                                                                                         57
Agenda

• Company strategy and performance
• Opportunity
• Industry overview
Evolution of life insurance industry in India
                                        FY2002                  FY2010                   FY2015           FY2020

 New business premium1 (` bn)              116         21.5%       550         -5.8%
                                                                                            408   12.5%    735

 Total premium (` bn)                      501         3.2%       2,654         4.3%      3,281   11.6%    5,683

 Penetration (as a % to GDP)              2.1%                    4.1%                    2.6%             2.8%

 Assets under management (` bn)          2,304         24.0%
                                                                 12,899        12.6%     23,361   10.1%   37,757

 In-force sum assured2 (` bn)          11,812*         15.5%     37,505        15.8%     78,091   17.3%   173,077

 In-force sum assured (as % to GDP)     50.1%                    57.9%                   62.7%            85.1%

                                1. Retail weighted received premium (RWRP)
                                2. Individual and Group in-force sum assured
                                Source: IRDAI, CSO, Life Insurance Council, *Company estimate                       59
Channel mix1
                   Industry                                                 Private sector

        9%            11%             12%                           18%           21%         22%
        25%           27%             28%

                                                                    54%           54%         53%

        66%           62%             60%

                                                                    28%           25%         25%

       FY2018       FY2019           FY2020                  FY2018             FY2019       FY2020
                                    Agency        Bancassurance   Others

• Given a well developed banking sector, bancassurance continues to be the largest channel
  for private players

                               1.   Individual new business premium basis
                                    Source: Life Insurance Council
                                                                                                      60
Product mix1
               Industry                                                Private sector

                26%             18%
       27%
                                                                          51%            44%
                                                          54%

                74%             82%
       73%
                                                                          49%            56%
                                                          46%

      FY2018   FY2019          FY2020                    FY2018          FY2019         FY2020
                                    Non-linked           Linked

                          1.   New business weighted premium basis;
                               Source: IRDAI, Life Insurance Council
                                                                                                 61
Annexures
VNB growth and contribution
VNB Margin(%)    17.0%                   21.7%                                                       VNB contribution*

                                                      25%                                FY2019                               FY2020
                VNB growth range to achieve
                      our aspiration
                                                      19%                   VNB              13.28                             16.05
                                                                            ` billion
                                         16.05
 ` billion
                                                                                                                        4.20
                 13.28                                                              4.17
                                                                                                                      (26.2%)
                                                                                  (31.4%)
                                                                                                   7.89               2.27               9.58
                                                                                     1.22        (59.4%)            (14.1%)            (59.7%)
                                                                                    (9.2%)

                FY2019                  FY2020
                                                                                  Protection          Savings: Non-linked       Savings: Linked

         VNB growth of 21%; margin 21.7%                                      74% VNB from protection & non-linked savings

                                                 *Figures in brackets represent share of VNB
                                                 Total may not add up due to rounding off                                                    63
Value of New Business (VNB)
   ` billion                                                         FY2019                FY2020
   VNB                                                                 13.28                 16.05
   VNB margin                                                         17.0%                  21.7%

                      4.7%                   (1.1%)                              1.0%     21.7%
                                                                     0.1%

          17.0%

          FY2019   Business mix            Tax rate*               Assumption   Expense   FY2020
                                                                    changes

                                  * Change in effective tax rate

                                                                                                     64
Protection and Annuity
Protection                                                           Annuity
             8.5%          11.2%      20.6%           25.2%                       2.6%            3.4%         6.6%     8.4%
mix1                                                                 mix1
         Protection new business received premium (` billion)                 Annuity new business received premium (` billion)
                                                        31.44                                                         10.43

                                        21.37                                                                  6.85

                            10.28
                                                                                                       3.11
               6.71                                                                2.06

             FY2017        FY2018     FY2019          FY2020                      FY2017          FY2018      FY2019   FY2020

                      Protection and Annuity contributed over 1/3rd of new business premium

                                          1.    % of new business received premium as per financials
                                                                                                                                65
Protection: Components
                                                                                       Protection split based on APE*
 APE (` billion)                                                                                  (FY2020)
                                     11.16                              ` billion

                                         2.35
                                                                                        1.74                        Retail protection
               7.22                      1.13                                         (15.6%)
                                                                              0.61
              1.57                                                           (5.5%)                                 Group Term
              1.28                                                            1.13
                                                                            (10.1%)                      7.68       Credit life – ICICI
                                         7.68                                                          (68.8%)      Bank
              4.36                                                                                                  Credit life - Other

             FY2019                 FY2020
        Retail Protection   Group Term     Credit Life

                                                                            Credit life through third party contributes
    Retail protection is ~70% of protection APE
                                                                                      ~16% of protection APE

                                         * Figures in brackets represent mix of protection APE
                                         Components may not add up to the totals due to rounding off                                66
Retail persistency excluding single premium1
    Persistency across product categories

              82.6%                                  88.3%                                        82.6%
                               64.7%                              65.8%
                                                                                                               51.7%

                      Linked                              Non linked                                  Protection
                                                   13th month     49th month

    Persistency across channel categories

           81.7%                       86.4%                            82.2%                             86.9%
                                                                                                                   74.2%
                   62.7%                        65.5%                            66.2%

           Bancassurance                  Agency                             Direct                  Partnership distribution
                                                   13th month     49th month

                                        1. 11M-FY2020 persistency
                                        As per IRDA circular dated January 23,2014; excluding group and single premium policies
                                                                                                                                  67
Average APE by product categories

 Average retail APE per policy (`)   FY2018    FY2019    FY2020

 ULIP                                180,746   159,329   183,109

 Par                                  62,379    60,308    64,285

 Non Par                              54,187    76,468   109,410

 Protection                            9,123    12,048    23,115

 Total                                90,620    83,309    88,648

                                                                   68
Policy term and customer age*
          Average policy term (years)                                              Average customer age (years)

                                                                                  43         43

                                              36                                                                    36     36
                                     30

              14
     12

      Savings                        Protection                                        Savings                      Protection
                   FY2019   FY2020                                                                FY2019   FY2020

                                       * For FY2020; protection excludes credit life

                                                                                                                                 69
Channel wise product mix1
  Channel category           Product category                            FY2018               FY2019   FY2020
                             ULIP                                          89.8%               93.4%    86.8%
                             Par                                            7.3%                2.1%     2.2%
  Bancassurance              Non par                                        0.1%                0.6%     1.8%
                             Protection                                     2.7%                3.9%     9.3%
                             Total                                        100.0%              100.0%   100.0%
                             ULIP                                          81.8%               75.3%    49.9%
                             Par                                           13.5%               18.1%    32.5%
  Agency                     Non par                                        0.4%                0.5%     7.3%
                             Protection                                     4.3%                6.1%    10.3%
                             Total                                        100.0%              100.0%   100.0%
                             ULIP                                          88.0%               79.3%    66.7%
                             Par                                            4.3%                5.3%    10.7%
  Direct                     Non par                                        2.4%                6.4%    11.0%
                             Protection                                     5.3%                9.1%    11.6%
                             Total                                        100.0%              100.0%   100.0%
                             ULIP                                          36.8%               28.2%    21.8%
                             Par                                           49.9%               49.5%    39.9%
  Partnership distribution   Non par                                        0.5%                0.6%    10.4%
                             Protection                                    12.8%               21.8%    27.8%
                             Total                                        100.0%              100.0%   100.0%

                                1. Retail Annualized Premium Equivalent (APE)
                                Components may not add up to the totals due to rounding off
                                                                                                                70
Product wise channel mix1
  Product category   Channel category                                       FY2018               FY2019   FY2020
                     Bancassurance                                            57.4%               65.5%    68.2%
                     Agency                                                   25.4%               20.5%    16.3%
  ULIP               Direct                                                   14.5%               12.0%    13.0%
                     Partnership distribution                                  2.7%                2.1%     2.5%
                     Total                                                   100.0%              100.0%   100.0%
                     Bancassurance                                            35.4%               13.8%     9.0%
                     Agency                                                   31.5%               45.4%    56.0%
  Par                Direct                                                    5.3%                7.4%    11.0%
                     Partnership distribution                                 27.7%               33.3%    24.0%
                     Total                                                   100.0%              100.0%   100.0%
                     Bancassurance                                            15.9%               27.4%    19.4%
                     Agency                                                   24.5%                8.0%    33.7%
  Non par            Direct                                                   52.8%               62.0%    30.1%
                     Partnership distribution                                  6.8%                2.6%    16.8%
                     Total                                                   100.0%              100.0%   100.0%
                     Bancassurance                                            35.2%               36.9%    45.2%
                     Agency                                                   27.6%               22.8%    20.9%
  Protection         Direct                                                   17.9%               18.7%    14.0%
                     Partnership distribution                                 19.3%               21.7%    19.8%
                     Total                                                   100.0%              100.0%   100.0%

                                   1. Retail Annualized Premium Equivalent (APE)
                                   Components may not add up to the totals due to rounding off
                                                                                                                   71
Embedded value
Embedded value
 ` billion                                                FY2018                 FY2019      FY2020
 Value of In force (VIF)                                   117.64                  142.69    151.87
 Adjusted Net worth                                          70.24                  73.54     78.43
 Embedded value1                                           187.88                 216.23     230.30
 Return on Embedded Value (ROEV)                           22.7%                   20.2%     15.2%
 EV growth-pre dividend                                    23.4%                   19.6%      8.4%
 EV growth-post dividend                                   16.1%                   15.1%      6.5%
 VNB as % of opening EV                                      7.9%                   7.1%      7.4%
 Operating assumption changes as % of
                                                             4.7%                   2.2%     (1.0%)
 opening EV
 Operating variance as % of opening EV                       1.6%                   2.5%      0.8%

                               1. As per Indian Embedded Value (IEV) method
                               Components may not add up to the totals due to rounding off
                                                                                                      73
EV methodology
• EV results prepared based on the Indian Embedded Value (IEV)
  methodology and principles as set out in Actuarial Practice Standard 10
  (APS10) issued by the Institute of Actuaries of India (IAI)
• EV consists of Adjusted Net Worth (ANW) and Value of in-force covered
  business (VIF)
  • ANW is market value of assets attributable to shareholders, consisting of
      • Required capital
      • Free surplus
  • Value of in-force covered business (VIF) is
      •   Present value of future profits; adjusted for
      •   Time value of financial options and guarantees;
      •   Frictional costs of required capital; and
      •   Cost of residual non-hedgeable risks

                                                                                74
Components of ANW
• Required capital (RC)
  • The level of required capital is set equal to the amount required to be held to
    meet supervisory requirements.
  • It is net of the funds for future appropriation (FFAs)
• Free surplus (FS)
  • Market value of any assets allocated to, but not required to support, the in-force
    covered business

                                                                                         75
Components of VIF (1/2)
• Present value of future profits (PVFP)
  • Present value of projected distributable profits to shareholders arising from in-
    force covered business
  • Projection carried out using ‘best estimate’ non-economic assumptions and
    market consistent economic assumptions
  • Distributable profits are determined by reference to statutory liabilities
• Frictional Cost of required capital (FC)
  • FCs represent investment management expenses and taxation costs associated
    with holding the Required capital
  • Investment costs reflected as an explicit reduction to the gross investment
    return

                                                                                        76
Components of VIF (2/2)
• Time value of financial options and guarantees (TVFOG)
  • Represents additional cost to shareholders that may arise from the embedded
    financial options and guarantees
  • Stochastic approach is adopted with methods and assumptions consistent with the
    underlying embedded value
• Cost of residual non-hedgeable risk (CRNHR)
  • An allowance for risks to shareholder value to the extent not already allowed for in
    the TVFOG or the PVFP
  • Allowance for asymmetric risks of operational, catastrophe mortality/morbidity and
    mass lapsation risk
  • Determined using a cost-of-capital approach
  • Allowance for diversification benefits among the non-hedgeable risks, other than
    the operational risk

                                                                                           77
Components of EV movement (1/2)
• Expected return on existing business (unwind)
  • Expected investment income at opening reference rate on VIF and ANW
  • Expected excess ‘real world’ investment return over the opening reference rate
    on VIF and ANW
• Operating assumption changes
  • Impact of the update of non-economic assumptions both on best estimate and
    statutory bases to those adopted in the closing EV
• Value of new business
  • Additional value to shareholders created through new business during the
    period

                                                                                     78
Components of EV movement (2/2)
• Operating experience variance
  • Captures impact of any deviation of actual experience from assumed in the
    opening EV during the inter-valuation period
• Economic assumption changes and Investment variance
  • Impact of the update of the reference rate yield curve, inflation and valuation
    economic assumptions from opening EV to closing EV
  • Captures the difference between the actual investment return and the expected
    ‘real world’ assumed return
• Net capital injection
  • Reflects any capital injected less any dividends paid out

                                                                                      79
Key assumptions underlying EV (1/2)
• Discount rate and Fund earning rates
  • Set equal to reference rates which is proxy for risk free rates
  • Reference rates derived on the basis of zero coupon yield curve published by
    the Clearing Corporation of India Limited
• Expenses and commission
  • Based on the Company’s actual expenses during FY2020 with no anticipation
    for productivity gains or cost efficiencies
  • Commission rates are based on the actual commission payable to the
    distributors

                                                                                   80
Key assumptions underlying EV (2/2)
• Mortality and morbidity
  • Based on company’s experience with an allowance for future improvements in
    respect of annuities
• Persistency
  • Based on company’s experience
• Taxation
  • Taxation costs reflect the reduction in costs due to dividend income being tax
    exempt subject to maximum of dividend declared and distributed1

                             1.   Limit of deduction subject to dividend distribution introduced in Finance Act, 2020

                                                                                                                        81
Economic assumptions underlying VNB and EV

    Tenor (years)                    References Rates
                    March 31, 2019    March 31, 2020    June 30, 2020
         1                  6.66%              4.83%           3.62%
         5                  7.83%              7.43%           7.03%
         10                 8.35%              7.32%           7.65%
         15                 8.35%              7.17%           7.37%
         20                 8.22%              7.14%           7.11%
         25                 8.11%              7.14%           6.97%
         30                 8.05%              7.14%           6.90%

                                                                        82
Glossary
•   Annualized Premium Equivalent (APE) – Annualized Premium Equivalent (APE) is the sum of the annualized first year
    premiums on regular premium policies, and ten percent of single premiums, from both individual and group
    customers
•   Assets under management (AUM) - AUM refers to the carrying value of investments managed by the company and
    includes loans against policies and net current assets pertaining to investments
•   Embedded Value (EV) - Embedded Value (EV) represents the present value of shareholders’ interests in the earnings
    distributable from the assets allocated to the business after sufficient allowance for the aggregate risks in the
    business
•   Embedded Value Operating Profit (EVOP) - Embedded Value Operating Profit (EVOP) is a measure of the increase in
    the EV during any given period due to matters that can be influenced by management
•   Retail Weighted Received Premium (RWRP) - Premiums actually received by the insurers under individual products
    and weighted at the rate of ten percent for single premiums
•   Total weighted received premium (TWRP) - Measure of premiums received on both retail and group products and is
    the sum of first year and renewal premiums on regular premium policies and ten percent of single premiums
    received during any given period
•   Persistency Ratio - Persistency ratio is the percentage of policies that have not lapsed and is expressed as 13th
    month, 49th month persistency etc. depicting the persistency level at 13th month (2nd year) and 49th month (5th
    year) respectively, after issuance of contract

                                                                                                                  83
•
Safe harbor
Except for the historical information contained herein, statements in this release which
contain words or phrases such as 'will', 'would', ‘indicating’, ‘expected to’ etc., and similar
expressions or variations of such expressions may constitute 'forward-looking statements'.
These forward-looking statements involve a number of risks, uncertainties and other factors
that could cause actual results to differ materially from those suggested by the forward-
looking statements. These risks and uncertainties include, but are not limited to our ability to
successfully implement our strategy, our growth and expansion in business, the impact of
any acquisitions, technological implementation and changes, the actual growth in demand for
insurance products and services, investment income, cash flow projections, our exposure to
market risks, policies and actions of regulatory authorities; impact of competition; experience
with regard to mortality and morbidity trends, lapse rates and policy renewal rates; the
impact of changes in capital, solvency or accounting standards, tax and other legislations and
regulations in the jurisdictions as well as other risks detailed in the reports filed by ICICI Bank
Limited, our holding company, with the United States Securities and Exchange Commission.
ICICI Prudential Life Insurance undertakes no obligation to update forward-looking statements
to reflect events or circumstances after the date thereof.

                                                                                                      84
Thank you
You can also read