REITweek Investor Presentation - DRAFT
←
→
Page content transcription
If your browser does not render page correctly, please read the page content below
DRAFT

REITweek Investor Presentation
      June 2018 – New York, NY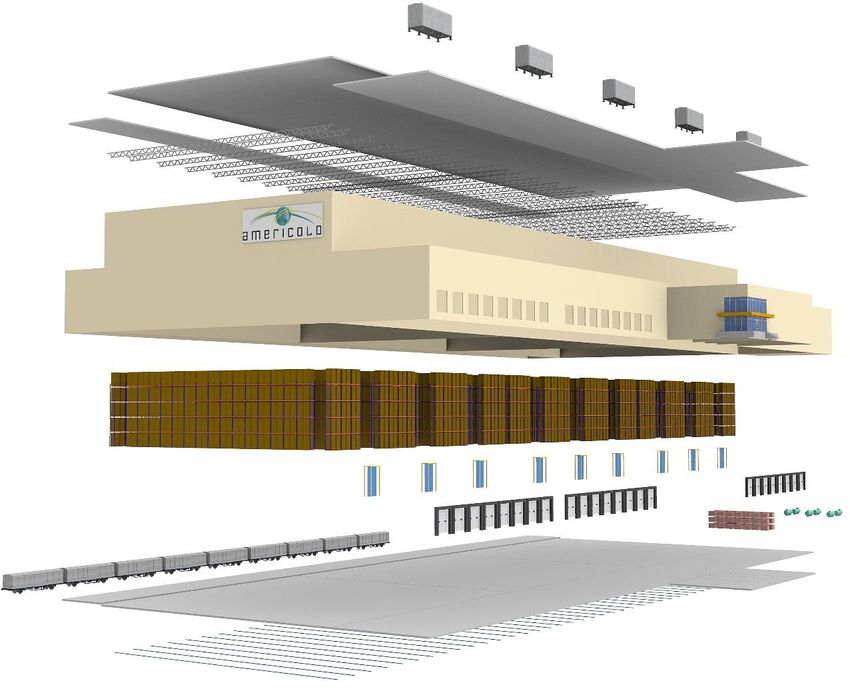
Disclaimer
This presentation contains statements about future events and expectations that constitute forward-looking statements. Forward-looking statements are based
on our beliefs, assumptions and expectations of our future financial and operating performance and growth plans, taking into account the information currently
available to us. These statements are not statements of historical fact. Forward-looking statements involve risks and uncertainties that may cause our actual
results to differ materially from the expectations of future results we express or imply in any forward-looking statements, and you should not place undue
reliance on such statements. Factors that could contribute to these differences include adverse economic or real estate developments in our geographic
markets or the temperature-controlled warehouse industry; general economic conditions; risks associated with the ownership of real estate and temperature-
controlled warehouses in particular; defaults or non-renewals of contracts with customers; potential bankruptcy or insolvency of our customers; uncertainty of
revenues, given the nature of our customer contracts; increased interest rates and operating costs; our failure to obtain necessary outside financing; risks
related to, or restrictions contained in, our debt financing; decreased storage rates or increased vacancy rates; difficulties in identifying properties to be
acquired and completing acquisitions; risks related to expansions of existing properties and developments of new properties, including failure to meet
budgeted or stabilized returns in respect thereof; acquisition risks, including the failure of such acquisitions to perform in accordance with projections;
difficulties in expanding our operations into new markets, including international markets; our failure to maintain our status as a REIT; uncertainties and risks
related to natural disasters and global climate change; possible environmental liabilities, including costs, fines or penalties that may be incurred due to
necessary remediation of contamination of properties presently or previously owned by us; financial market fluctuations; actions by our competitors and their
increasing ability to compete with us; labor and power costs; changes in real estate and zoning laws and increases in real property tax rates; the competitive
environment in which we operate; our relationship with our employees, including the occurrence of any work stoppages or any disputes under our collective
bargaining agreements; liabilities as a result of our participation in multi-employer pension plans; the cost and time requirements as a result of our operation as
a publicly traded REIT; the concentration of ownership by funds affiliated with The Yucaipa Companies, The Goldman Sachs Group, Inc., and Fortress
Investment Group, LLC; changes in foreign currency exchange rates; and the impact of anti-takeover provisions in our constituent documents and under
Maryland law, which could make an acquisition of us more difficult, limit attempts by our shareholders to replace our trustees and affect the price of our
common shares.

Words such as “anticipates,” “believes,” “continues,” “estimates,” “expects,” “goal,” “objectives,” “intends,” “may,” “opportunity,” “plans,” “potential,” “near-
term,” “long-term,” “projections,” “assumptions,” “projects,” “guidance,” “forecasts,” “outlook,” “target,” “trends,” “should,” “could,” “would,” “will” and
similar expressions are intended to identify such forward-looking statements. Examples of forward-looking statements included in this presentation include,
among others, statements about our expected expansion and development pipeline and our targeted return on invested capital on expansion and development
opportunities. We qualify any forward-looking statements entirely by these cautionary factors. Other risks, uncertainties and factors, including those discussed
under “Risk Factors” in our Annual Report on Form 10-K for the year ended December 31, 2017 and our other reports filed with the Securities and Exchange
Commission, could cause our actual results to differ materially from those projected in any forward-looking statements we make. We assume no obligation to
update or revise these forward-looking statements for any reason, or to update the reasons actual results could differ materially from those anticipated in
these forward-looking statements, even if new information becomes available in the future.

                                                                                                                                                                  2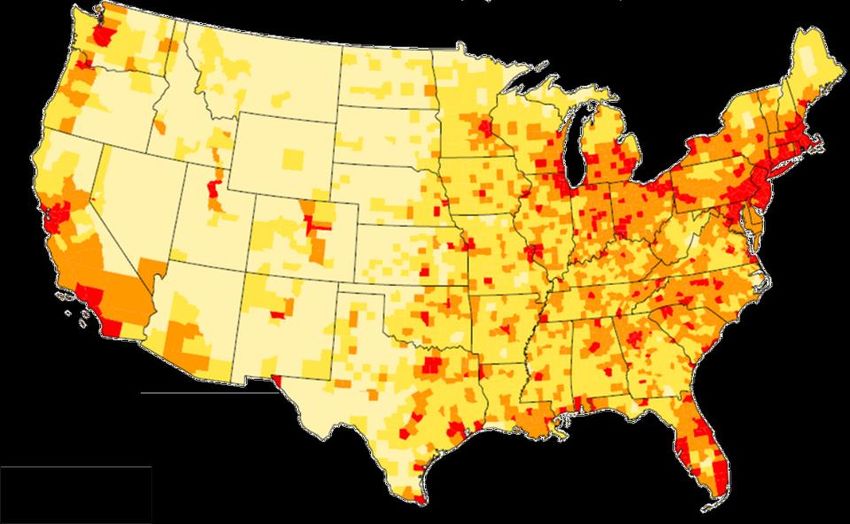
Key Investment Highlights

 1   Important First Mover Advantage as the Only Publicly Traded REIT Focused on Temperature-Controlled Warehouses

 2   Global Market Leader with Integrated Network of Strategically-Located, High-Quality, “Mission-Critical” Warehouses

 3   Infrastructure Supported by Best-in-Class IT and Operating Platforms Provides a Significant Competitive Advantage

 4   Strong and Stable Food Industry Fundamentals Drive Growing Demand

 5   Substantial Internal and External Growth Opportunities Expected to Drive Attractive Risk-Adjusted Returns

 6   Strong, Flexible Balance Sheet Positioned for Growth

 7   Experienced Management Team, Alignment of Interest and Best-In-Class Corporate Governance

                                                                                                                         3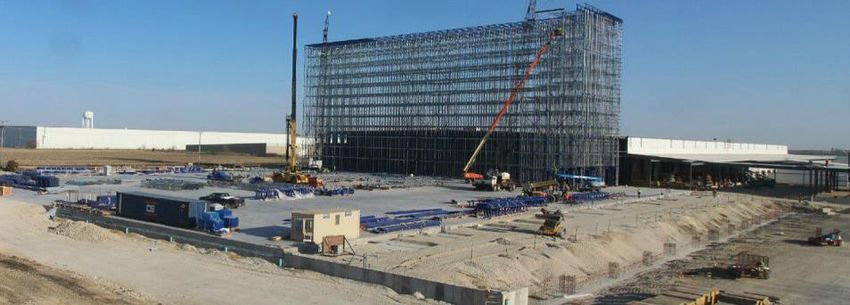
Company Snapshot
                                       Largest global and U.S. REIT focused on the ownership, operation,
                                      development and acquisition of temperature-controlled warehouses

                         Portfolio Overview                                                                                                        Financial Overview
                                                                                                                ($ in millions)
Warehouses                  158                                                                                                                                   2016A                    2017A          LTM 3/31/18

                            120 Owned (1),                                                                      Revenue                                           $1,490                    $1,544                  $1,562
Ownership Type
                            26 capital / operating leased, 12 managed
                                                                                                                Segment Contribution /
                                                                                                                                                                     $346                     $374                     $383
                                                                                                                NOI
Total Capacity              934mm cubic feet / 40mm square feet
                                                                                                                Core EBITDA                                          $261                     $287                     $291

Average Facility Size       5.9mm cubic feet / 253K square feet

                            U.S., Australia, New Zealand, Argentina and
                                                                                                                                LTM 3/31/18 Segment Breakdown (3)
Countries of Operation
                            Canada
                                                                                                                                Revenue                                         Contribution / NOI (4)

Estimate of                                                                                                    Warehouse
                            23% (2)                                                                                                                                     Warehouse
U.S. Market Share
                                                                                                                                                                                      93%

                                                                                                                       74%
Number of Customers         Approx. 2,400                                                                                                             16%      Third-Party
                                                                                                                                                                Managed

Number of Pallet                                                                                                                                  10%                                                        4%
                                                                                                                                                                                                                     Third-Party
                            3.2mm                                                                                                                                                                          3%
Positions                                                                                                                                                Transportation                                               Managed

                                                                                                                                                                                                            Transportation
                           Note: Figures as of March 31, 2018, unless otherwise indicated
                           (1) Includes seven ground leased assets
                           (2) Data as of May 2018. As of January 2018, USDA has changed the definition surrounding the capacity of domestic refrigerated warehouses. Warehouses must meet additional criteria to be included in
                                 the publication.
                           (3) Figures exclude quarry business segment
                           (4) Segment contribution refers to a segment’s revenues less segment specific operating expenses (excludes any depreciation, depletion and amortization, impairment charges and corporate level SG&A)
                                 Contribution for our warehouse segment equates to net operating income (“NOI”)                                                                                                                  4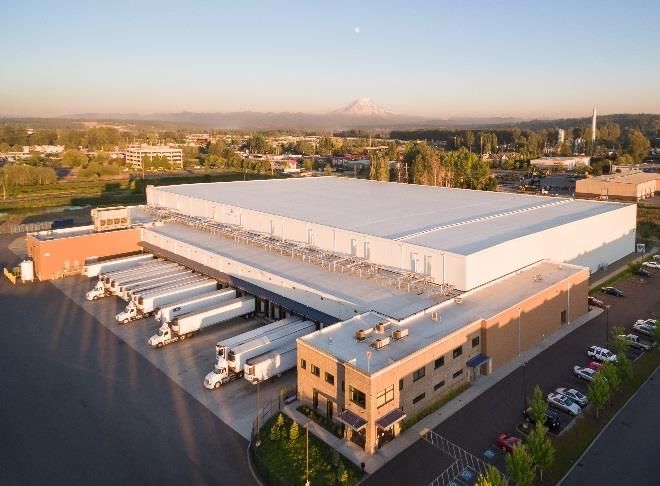
Temperature-Controlled Warehouses: An Attractive Asset Class
       Uniquely designed to maintain the temperature of frozen and refrigerated products in the cold chain and
                 represent a growing, attractive niche of the industrial warehouse real estate sector
   Automated Storage                                                                                  Engine Room with
   & Retrieval System                                                                             Refrigeration Compressors

   Pallet Racking System                                                                           Battery Charging Rooms

                                                                                         Office
                                                                                         Areas
                                                  Insulated Walls

         Rail Dock                                                                                 Specialized Dock Aprons

                                          High-Speed Doors

                                                   Insulated and Heated Floors

                                                                                                                              5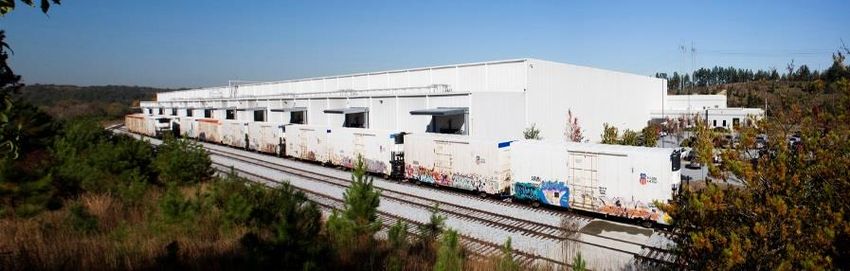
Temperature-Controlled vs Dry Industrial Warehouses
          Temperature-controlled warehouses are mission-critical real estate that serve as a specialized, integral
                         component of the temperature-controlled supply chain infrastructure

     Refrigeration               Customized Racking                                        Commoditized                                                            Non-Specialized

                                                                     VS

  Characteristic     Temperature-Controlled                                         Dry Industrial (1)                                                            Commentary
                                                                                                                                        The temperature-controlled industry uses cubic feet
   Average Size            ~5.9mm cu ft (2)Clear Heights ~200K+ sf                                                                 as space is leased by pallet positions; floor to ceiling volume is
                               (~253K+ sf)                                                                                                        more relevant for storage capacity

      New                                                                                                                          Temperature-controlled infrastructure is typically reusable for
                     $130-$180+                           (2) Heights$75-$100+
                                                      psfClar                                                 psf                      future customers (racking, refrigeration, insulation
Construction Costs                                                                                                                                   and specialized slabs)

     Supply                                                                                                                     Cold storage has higher barriers to entry given construction costs,

   Constraints
                                       High                 Clear Heights                     Low                                 location requirements and operational expertise; and is more
                                                                                                                                 disciplined and usually driven by customer and market demand

                                                                                                                                     Cold storage facilities feature temperature flexibility that is
  Temperature              -20° – Ambient
                                        Clear Heights Ambient                                                                                      dependent on customer needs

    Optimal                                                                                                                       Optimal physical occupancy across temperature-controlled
   Occupancy
                                   ~85% (2)                 Clear Heights                   ~95%                                warehouse portfolio is ~85%; varies depending on facility purpose

                                                                                                                                  Average customer relationship w/ top 25 warehouse customers
     Average
   Lease Terms
                             ~5     years (2)(3)Clear Heights                           5-7 years                                 is 33 years – high customer retention with increased customer
                                                                                                                                         stability and utilization; build-to-suits 10-20 years
                           Key logistics and
                                                                                                                                 Network located in key logistics and production corridors, in close
    Location                                 Clear Heights Primary, Secondary
                      food production corridors,
                                                                                                                                    proximity to customer requirements and commodity flows
                     adjacent to customer facilities

                     (1)    Green Street Advisors Research, Cushman & Wakefield Outlook Report and public company filings
                     (2)    Figures represent Americold specific metrics
                     (3)    Represents weighted average of initial lease term for contracts featuring fixed storage commitments and leases as of March 31, 2018                                         6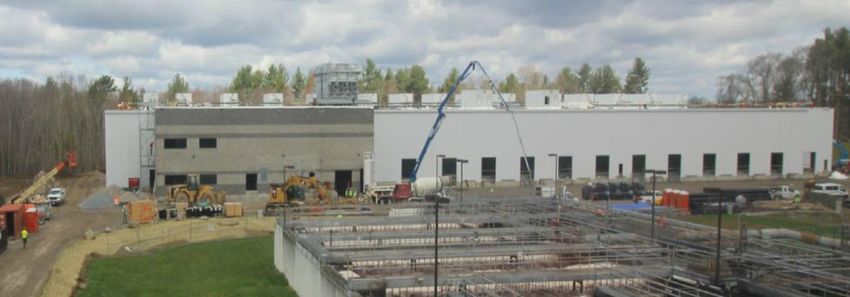
Largest Fully Integrated Network of Temperature-Controlled Warehouses
An indispensable component of food infrastructure from “farm to fork"
e-Commerce
Fulfillment
Delhi, LA LaPorte, TX Atlanta, GA Phoenix, AZ
Fork
Farm Production Public Distribution Retail
Advantaged Warehouse Center Distribution Center
Supermarket
Warehouse
Food Producers Americold Realty Trust Food Distribution + Retailers
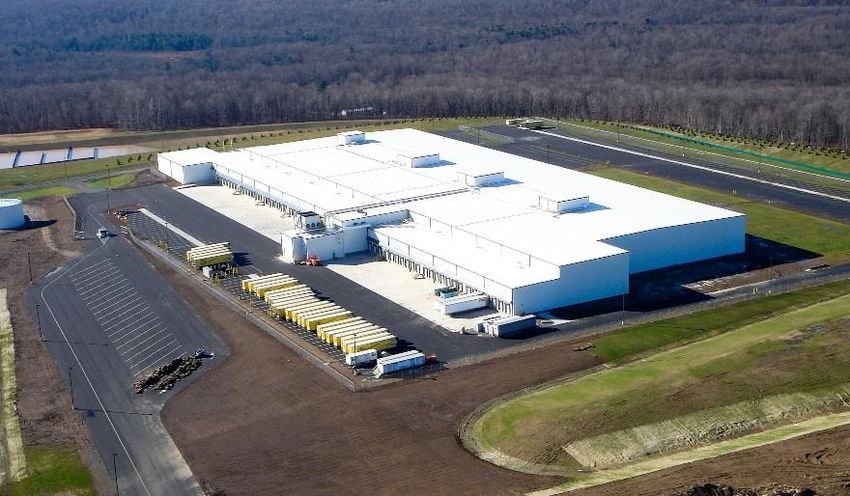
Gouldsboro Distribution Center – Gouldsboro, PA
7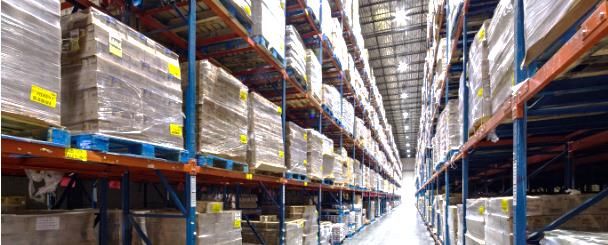
Integrated Operations Overview
Real estate value is driven by the critical nature of the Company’s infrastructure,
strategic locations and integrated, full-service strategy
Overview Select Customers % of Contribution (1)
Mission-critical, temperature-controlled real estate
infrastructure generates rent and storage income
Warehouse
Comprehensive value-add services NOI
(Storage and Handling)
Strategic locations, network breadth, scale, reliable
temperature integrity and best-in-class customer IT interface
Warehouse
distinguish COLD’s warehouses from competitors
93%
Third-Party
Managed
Transportation
Tradewater Distribution Facility – Atlanta, Georgia
Warehouse
Management of customer-owned warehouses
Third-Party
Managed
Warehouse management services provided at customer-
owned facilities 4%
Third-Party
Operating costs passed through to customers Managed
Asset-light consolidation, management and brokerage services
Transportation
Complements warehouse segment
Enhances customer retention and drives warehouse storage
3%
and occupancy
Supplementary offering that improves supply chain efficiency
Transportation
and reduces cost by leveraging Americold’s scale
(1) LTM figures as of March 31, 2018 and excludes the quarry business segment 8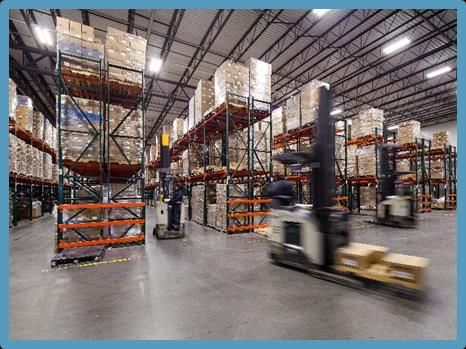
Diverse Customer Needs Drive Multiple Avenues of Demand
We own and develop multiple types of warehouses, which allows us to service all of our
customers’ needs, thus capturing more of their storage and handling revenue
Production Advantaged Public Warehouse Distribution Centers Facility Leased
Customer dedicated Multiple customers storing Distribution centers house a Americold owned facilities
warehouses, located near / inventory with warehouses variety of finished products leased to third parties
Definition attached to customer serving local and regional until future shipment to end-
processing or production warehouse customers users
facilities
Facilities built-to-suit Food producers, distributors, Located in key major market Third-party customers who
Inventory typically stored to e-tailers and retailers store distribution hubs desire to manage their own
be shipped further down the capacity overflow Typically closer to end-users temperature-controlled
supply chain Tends to be smaller and Stores finished products with warehousing and carry on
Key Captive customers closer to food sources forward deployment to processing operations
Characteristics Multi-purpose warehouses regional or local retailers Customers pay rent on a
storing both raw and finished Retail inventory customized square footage basis
products and shipped to retail outlets
Serves a larger population
base
Value-add services provided include blast freezing, storage and case-picking
No. of 39 properties 46 properties 59 properties 4 properties
Properties / 203mm cubic feet 206mm cubic feet 463mm cubic feet 18mm cubic feet
Cubic Feet Average size: 5mm cubic feet Average size: 4mm cubic feet Average size: 8mm cubic feet Average size: 4mm cubic feet
Revenue(1) $227.6mm, or 20% $202.8mm, or 17% $718.3mm, or 62% $7.6mm, or 1%
Site
Examples
Massillon, OH Montgomery, AL Atlanta, GA (Tradewater) San Antonio, TX
Note: Property counts above exclude 12 managed sites
(1) Dollars and percent based on LTM global warehouse segment results as of March 31, 2018 9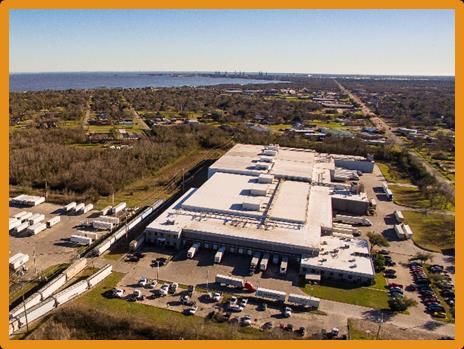
Strategically Located, “Mission-Critical” Temperature-Controlled Warehouses
Strategic locations and extensive geographic presence provide an integrated
warehouse network that is fundamental to customers’ ability to optimize their distribution networks
BC
BC
AB
AB SK
SK MB
MB PE
PE
WA
WA NB
NB
ON
ON NS
NS
QC
QC
MN
MN ME
ME
MT
MT ND
ND
OR
OR VT
VT
ID
ID WI
WI NH
NH
NY
NY MA
MA
SD
SD
WY
WY MI
MI
RI
RI
PA
PA CT
CT
IA
IA NJ
NJ
NE
NE IN
IN
NV
NV OH
OH DE
DE
UT
UT
IL
IL WV
WV MD
MD
CO
CO
CA
CA VA
VA DC
DC
KS
KS MO
MO KY
KY
962500_1.WOR
962500_1.WOR
962500_1.WOR(NY008MZK)
962500_1.WOR
962500_1.WOR
962500_1.WOR (NY008MZK)
(NY008MZK)
(NY008MZK)
(NY008MZK)
NC
NC
AZ
AZ TN
TN
OK
OK
NM
NM AR
AR
SC
SC
GA
GA
MS
MS AL
AL
TX
TX LA
LA
FL
FL
Distribution
Public
Production Advantaged
NY008MZK / 957094_1 962500_1.WOR
962500_1.WOR
962500_1.WOR(NY008MZK)
962500_1.WOR
962500_1.WOR
962500_1.WOR (NY008MZK)
(NY008MZK)
(NY008MZK)
(NY008MZK) NY008MZK / 957094_1
Facility Leased
Third-Party Managed
Canada United States Argentina Australia (1) New Zealand
# facilities 3 # facilities 140 # facilities 2 # facilities 6 # facilities 7
Square feet (000s) 471 Square feet (000s) 37,042 Square feet (000s) 232 Square feet (000s) 1,644 Square feet (000s) 604
Cubic feet (mm) 14.3 Cubic feet (mm) 839.5 Cubic feet (mm) 9.7 Cubic feet (mm) 47.6 Cubic feet (mm) 22.8
Note: Americold portfolio figures as of March 31, 2018
(1) Figures include ambient facility, except for cubic feet metric 10U.S. Portfolio Located in Key Logistics Corridors
Strategically located, “mission-critical” temperature-controlled warehouses
serve the country’s population centers within a one day drive
Map Key
Population per Square Mile
250 or more
50–249.9
10–49.9
Less than 10
Facilities
Key logistics corridor
500 mile radius
Corridor Region Covered
Mid-Atlantic, Tri-State
Lehigh Valley
and New England
Great Lakes and
Chicago
Midwest
Atlanta Southeast
Texas, Oklahoma,
Dallas Louisiana and
Arkansas
California, Arizona and
So. California
Nevada
Seattle/Tacoma Pacific Northwest
Utah, Colorado and
Salt Lake City
Mountain West
Source: U.S. Census Bureau 2015 11Global Portfolio to Support an International Customer Base
Australia
People per sq km
101 or more
Brisbane 10.1–100
1.1–10.0
0.1–1
Sydney
Less than 0.1
Facilities
Key logistics corridor
Melbourne
Perth
Adelaide
Source: Australian Bureau of Statistics June 2015
New Zealand Argentina
People per sq km
Density
109–257 Auckland
(Pop. per km2)
59–108.9
22–58.9 20.1–100.0
10.1–20.0 Buenos
16–21.9
Palmerston North Aires
12–15.9 4.1–10.0
10–11.9 Pilar
0.0–4.0
5–9.9 Facilities
3–4.9
Key logistics
Less than 2.9
corridor
Facilities
Key logistics corridors
500 Kilometer radius Christchurch
Source: INDEC. National Census of Population and
Source: Statistics New Zealand Census 2015 Housing 2015 (IGN) National Geographic Institute
12Global Market Leader in Temperature-Controlled Warehousing
Position as the U.S. and global market leader allows for realization of economies of scale, reduced operating costs and
lower overall cost of capital. Ideally positioned to compete for customers and external growth opportunities
U.S. Market Leader (1) Global Market Leader (2)
Market Cubic Ft Market Cubic Ft
Rank Share(3) (mm) Rank Share (mm)
#1 23.3% 839 #1 4.4% 934
Lineage Logistics #2 18.7% 672 Lineage Logistics #2 3.6% 767
Preferred Freezer Services #3 8.4% 304 Swire Cold Storage #3 1.7% 358
US Cold Storage, Inc. #4 7.8% 280 Preferred Freezer Services #4 1.7% 352
AGRO Merchants Group #5 3.2% 115 AGRO Merchants Group #5 1.2% 263
Interstate Warehousing, Inc. #6 2.8% 100 Nichirei Logistics Group, Inc. #6 0.8% 174
Cloverleaf Cold Storage Co. #7 2.3% 84 Kloosbeheer B.V. #7 0.8% 165
NewCold Advanced Cold
Henningsen Cold Storage Co. #8 1.8% 65 #8 0.7% 140
Logistics
Burris Logistics #9 1.6% 58 VersaCold Logistics Services #9 0.6% 133
Hanson Logistics #10 1.2% 44 Interstate Warehousing, Inc. #10 0.5% 100
Note: Americold portfolio figures provided by the Company as of March 31, 2018
(1) IARW Top Companies in USA and North America, May 2018 and USDA National Agricultural Statistics Service, “Refrigerated Space: By Type of Warehouse” chart
(2) GCCA and IARW Top Companies in USA and North America, May 2018
(3) As of January 2018, USDA has changed the definition surrounding the capacity of domestic refrigerated warehouses. Warehouses must meet additional criteria to be included in the publication. 13Industry-Leading, Integrated IT & Operating Platforms
Proprietary IT system has revolutionized how COLD interfaces with
customers, makes business decisions and manages warehouses
Integrated IT Platform Americold Operating System
Customer-Facing IT Systems
– Proprietary system provides customers with ability to
manage their inventory worldwide via a single online portal
– Ability for customers to integrate systems into their own
systems for seamless data transfer SC
Decision Making Tool Innovation
– Ability to harvest proprietary “Big Data” in order to identify
business trends and leasing opportunities
en-View Enabled
– Ability to review actual results vs. contracted terms
Warehouse Management 5-Habits LEAN-Based
Labor Continuous
– Organize reporting of key metrics Optimization Improvement
– Review of standardized Key Performance Indicators Risk Management Leader/Associate
Best-in-Class Platform Based Safety Development Cycle
– Invested ~$62mm over the last six years and three months SQF Based Energy
ended March 31, 2018 to develop an industry-leading IT Product Quality Maintenance Excellence
platform Excellence Refrigeration
Loss Prevention
Excellence
– Centralized IT customer interface integrated across a broad
network is unique to the sector
– Proprietary platform is a key competitive differentiator
AMERICOLD OPERATING SYSTEM
/
14Highly Diversified Business Model Produces Stable Cash Flows
Diversification helps reduce revenue volatility associated with seasonality and changing commodity trends
Commodity (1) Global Geographic Diversity (1)
Global Warehouse U.S. Warehouse
United States
Central
Dairy Fruits & Argentina
25% Southeast
Poultry Vegetables 1%
New Zealand
3%
LTM 3/31/18 LTM 3/31/18
9% WAREHOUSE TOTAL U.S. 22%
7% Other 14% 83% WAREHOUSE
REVENUE East 26%
10% Australia REVENUE
7% $1,156mm $939mm
Potatoes Bakery
27%
4%
11% LTM 3/31/18
WAREHOUSE 4% Pork West
REVENUE 3% Beef
$1,156mm 2% Warehouse Type (1)
2% Seafood
16% Distributors ⁽⁴⁾ Distribution
Packaged Production
Foods ⁽³⁾ 25% Advantaged
20%
LTM 3/31/18
Retail ⁽²⁾ WAREHOUSE
62% REVENUE
$1,156mm
17%
Public
1% Warehouse
Facility
Leased
Note: Figures may not sum due to rounding
(1) Diversification based on warehouse segment revenues for the twelve months ended March 31, 2018
(2) Retail reflects a broad variety of product types from retail customers
(3) Packaged food reflects a broad variety of temperature-controlled meals and foodstuffs
(4) Distributors reflects a broad variety of product types from distribution customers 15Long Standing Relationships with Top 25 Customers
Scope and scale of network coupled with long-standing relationships position the Company
to grow market share organically and through acquisitions
Food Producers / CPG Companies Top 25 Customers
Have been with Americold for an average of
33 years
100% utilize multiple facilities
100% utilize technology integration
88% utilize value-add services
72% utilize committed contracts or leases
Retailers / Distributors
68% are investment grade or equivalent
60% are in fully dedicated sites
44% utilize transportation and consolidation
services
25 largest customers account for approximately 62% (1) of warehouse revenues,
with no one customer generating more than 8.9% (1) of revenues
(1) Based on warehouse revenues for the last twelve months ended March 31, 2018
(2) Represents long-term issuer ratings as of October 31, 2017 16Economic Occupancy Driving Improved Returns
Implementation of standard underwriting procedures has contributed to
consistent occupancy growth over the last three years
Physical Occupancy Average Physical Occupancy
Optimal physical occupancy across temperature-controlled 1Q 2Q 3Q 4Q Annual
warehouse portfolio is ~85%, but can vary based on several 81%81% 82%
factors, including 78% 77%77% 76%
78%78%
75% 76% 76% 75% 75%
74%
– Intended customer base 72%
71%
– Throughput maximization
– Seasonality
– Leased but unoccupied pallets '15 '16 '17 '18 '15 '16 '17 '15 '16 '17 '15 '16 '17 '15 '16 '17 LTM
3/31/18
Illustrative Economic Occupancy (1)
Warehouse Pallets 10,000
Physical Occupancy Economic Occupancy
9,000
X X X X 9,000 8,500
8,800
8,500
7,850
X X 8,000 7,600 8,300 8,300
7,350
7,000 7,000 7,100
X X 6,800
7,000
Illustrative Economic Occupancy: 85%
X X X X 6,000 vs.
Illustrative Physical Occupancy: 78%
X Currently Occupied 5,000
Contractually Reserved Pallets
(1) Example assumes 10,000 pallet positions and is for illustrative purposes only; we do not yet calculate economic occupancy 17Growing Committed Revenue in Warehouse Portfolio
Significant improvement transitioning from as-utilized, on demand contracts
to fixed storage committed contracts and leases
Rent & Storage Warehouse Revenue
Fixed storage committed contracts and leases currently
represent: Annualized
Committed Rent &
Storage Revenue ⁽¹⁾
– 39% of warehouse rent and storage revenues (1) and $198mm
LTM 3/31/18
39%
WAREHOUSE
– 43% of total warehouse segment revenues (2) RENT & STORAGE
REVENUE
61% $508mm
5-year weighted average stated term (3)
$310mm
Other Rent &
3-year weighted average remaining term (3) Storage Revenue
Total Warehouse Segment Revenue
As of March 31, 2018, COLD had entered into at least one
fixed commitment contract or lease with 18 of top 25 Warehouse Segment
warehouse customers Revenue Generated by
Fixed Commitment
Contracts or Leases ⁽²⁾
The scope and breadth of network positions COLD to LTM 3/31/18
$494mm
43%
continue to increase fixed storage commitments WAREHOUSE
REVENUE
57% $1,156mm
$662mm
Other Warehouse
Segment Revenue
(1) Based on the annualized committed rent and storage revenues attributable to fixed storage commitment contracts and leases as of LTM March 31, 2018
(2) Based on total warehouse segment revenue generated by contracts with fixed storage commitments and leases for LTM March 31, 2018
(3) Represents weighted average term for contracts featuring fixed storage commitments and leases as of March 31, 2018 18Substantially All Warehouse NOI Driven by Rental & Storage Revenue
+ =
Rent & Storage Warehouse Services Total Warehouse Commentary
Revenues
REIT: Rent & Storage
$0.44 $0.56 $1.00 TRS: Warehouse Services
Power ($0.06) -- ($0.06) Power and utilities
Other Real Estate Related Costs: facility
Facility ($0.09) -- ($0.09) maintenance, property taxes, insurance,
Expenses
Costs rent, security, sanitation, etc.
Direct labor, overtime, contract labor,
Labor -- ($0.44) ($0.44) indirect labor, workers’
compensation and benefits
Other MHE (1), warehouse operations
Services
Costs
-- ($0.09) ($0.09) (pallets, shrink wrap, OS&D and D&D (2))
and warehouse administration
$0.28 $0.02 $0.31
65% + 4% = 31%
NOI
Margin:
% WH Total: 93% 7% 100%
Note: Based on LTM warehouse segment as of March 31, 2018. Future results may vary. Figures may not sum due to rounding
(1) Material Handling Equipment
(2) OS&D and D&D refer to Over Short & Damaged and Detentioned & Demurrage, respectively 19Warehouse Financial Summary
Warehouse Revenue ($mm) Warehouse NOI ($mm)
Actual $ CC $ Actual $ CC $
Rent and Storage Revenue CAGR: 2.8% 3.9% Rent and Storage NOI CAGR: 4.6% 5.8%
Warehouse Services Revenue CAGR: 3.7% 5.0% Warehouse Services NOI CAGR: 31.9% 28.1%
Total 2014A – 2017A CAGR: 3.6% 4.5% Total 2014A – 2017A CAGR: 5.8% 6.8%
$348
$308 $314 $24
$1,146 $294
$1,057 $1,081 $14 $11
$1,039 $10
$644
$577 $588 $604
$324
$284 $294 $303
$462 $469 $477 $502
2014A 2015A 2016A 2017A 2014A 2015A 2016A 2017A
Rent & Storage Warehouse Services Rent & Storage Warehouse Services
Same Store Rent & Storage Revenue per Occupied Pallet Growth Contribution (NOI) Margin
-- 0.9% 2.5% 4.1% 28% 29% 29% 30%
2015A – 2017A Average Growth: 2.5% 2014A – 2017A margin expansion: 208 bps
Margin expansion has been driven by contractual rate increases and occupancy growth
Note: Constant currency (CC) growth rate based on 2014 foreign exchange rates 20Positioned for Multiple Avenues of Growth
Global warehouse network, operating systems, scalable information technology platform and economies of scale provide a
significant advantage over competitors with respect to organic and external growth opportunities
Organic Growth Opportunities Development and External Growth and Expansion
Redevelopment Opportunities
8
Expand Presence
7 in Other
Temperature
Global Food Sensitive Products
6 Producers in the Cold Chain
Outsourcing &
Sale-Leaseback
5 Industry Opportunities
Consolidation
Redevelopment
4 & Existing Site
Build-to-Suit
3 Customer-Specific Expansion
& Market-Driven
Operational Development
2 Efficiencies
& Cost
1 Underwriting Containment
& Contract
Standardization
Rate Escalations
/ Occupancy
Increases
21Organic Growth Initiatives Have Driven Same Store Growth
Same store performance is the culmination of replacing legacy customer agreements with new contracts implementing
Commercial Business Rules, active asset management and leveraging integrated network, scale and market position
Same Store Rent & Storage NOI Growth Total Same Store NOI Growth
Constant Currency $ Constant Currency $
Growth % Growth %
6.5% 4.7% 6.3% 5.7% 6.1% 2.9% 9.5% 6.2%
6.4% 9.8%
5.8%
6.5%
3.4%
3.2%
3.2%
2.1%
FY2015 FY2016 FY2017 Q1 2018 FY2015 FY2016 FY2017 Q1 2018
Contribution (NOI) Margin Contribution (NOI) Margin
63% 65% 66% 67% 30% 30% 31% 32%
2017 same store NOI growth was driven by below market contracts resetting to market rates; while this marks a new
base for growth going forward, expect future same store NOI growth to normalize consistent with 2015-2016 levels
Note: NOI growth represents year-over-year growth to the comparable prior period
Note: Constant currency growth represents year-over-year growth based on the same foreign exchange rates relative to the comparable prior year period 22Growth Strategy – Expansion, Development and Acquisitions
Completed 15.7mm Cu Ft $70mm
4 Completed
Since 2014 44,000 Pallets Cost
Expansion and Development Opportunities (1)
Estimated Costs
Return on Invested Capital (1) (2)
Under 20.9mm Cu Ft ~$103.0mm
Construction
86,000 Pallets 1 Expansion & 1 Development 8% – 15%
Target completion date: 4Q17 to 4Q18
Estimated Investment Return on Invested Capital (2) (3)
Future $1.2bn+ 85+ acres land
Pipeline (3) Includes both customer-specific
adjacent to 10% – 15% 10% – 13%
9 warehouses Expansion Development
and market-demand
Development Customer- Market- Existing Sites 600+ acres land
of New
Sites Specific Demand + for Future
Expansion
adjacent to
60+ warehouses
Expect to initiate 2 to 3 expansion / development opportunities annually, with aggregate invested capital of
$75 million to $200 million with unlevered stabilized returns expected to range from 10% to 15%
Fragmented Consolidation Operational Cost of Capital Attractive
Acquisitions
Industry Opportunity Synergies Advantage Currency
(1) As of Mach 31, 2018; no assurance can be given that the actual cost or completion dates of any expansions or developments will not exceed our estimate, or that our targeted returns will be
achieved
(2) For projects under construction, represents budgeted stabilized returns on invested capital. For projects in our future pipeline, represents budgeted unlevered stabilized return on invested capital
(3) These future pipeline opportunities are at various stages of discussion and consideration and, based on historical experiences, many of them may not be pursued or completed as contemplated or
at all and there is no assurance that our budgeted unlevered stabilized returns will be achieved 23Growth Strategy – Recently Completed / Under Construction
($ in millions)
Opportunity Facility Cubic Pallet Cost of Expansion / Development Completion
Facility Type Type Feet (mm) Positions ('000) Total Cost ROIC Date
Completed Since 2014
Phoenix, AZ Development Distribution 3.5 12 $18 18.0% Q1 2014
Leesport, PA Expansion Distribution 2.2 2 12 20.4% Q3 2014
{1)
East Point, GA Redevelopment Distribution 4.2 9 11 9.0% - 11.0% Q4 2016
Clearfield, UT Expansion Distribution 5.8 21 29 12.0% - 15.0% Q4 2017
Total 15.7 44 $70
($ in millions) Cost of Expansion / Development (1)
Opportunity Facility Cubic Pallet Cost Estimated to Estimated Expected Target
Under Construction
(2) (2)
Facility Type Type Feet (mm) Positions ('000) to Date Completion Cost ROIC Completion Date (1)
Production
Middleboro, MA Development 5.2 28 15 9 24 8.0% - 12.0% Q3 2018
Advantaged
Rochelle, IL Expansion Distribution 15.7 58 32 47 79 12.0% - 15.0% Q4 2018
Total 20.9 86 $47 $56 $103
Rochelle, IL Middleboro, MA
Note: Assumes stabilization occurs in year two
(1) No assurance can be given that the actual cost or completion dates of any expansions or developments will not exceed our estimates or that our budgeted stabilized returns will be achieved
(2) Reflects management’s estimate of cost of completion as of March 31, 2018 24Flexible Balance Sheet Positioned for Growth
Significant Liquidity: ~$610mm (1)(2)
% of
– $194mm of cash Debt 1% 1% 12% 22% 25% 39%
Maturing
– $450mm New Senior Secured Revolving Credit
Facility (2)
2010 Mortgage Debt
Minimal near term debt maturities
2013 Mortgage Debt
Weighted average cost of debt of 5.4% Senior Secured Term Loan A
(2)
Debt to total capitalization of 37.5% New Zealand Term Loan
Australian Term Loan
Net debt to Core EBITDA of 4.7x (2)
Undrawn Revolver $475
~$610mm of Liquidity (1)
$7
Cash
$194mm
32%
$450
$406
$159
$262
68% $31
$6 $7 $7
Revolver $18 $18 $19 $7
Availability 2018 2019 2020 2021 2022 2023
$416mm
Note: Dollars in millions. Balances as of March 31, 2018
(1) Figure reflects pro forma cash and the capacity available under the New Senior Secured Revolving Credit Facility less ~$34mm in letters of credit
(2) In connection with the IPO, the Company closed on its new $925.0 million senior secured credit facility, consisting of a five-year, $525.0 million senior secured term loan A facility and a three-
year, $400.0 million senior secured revolving credit facility. Subsequently, the Company used the proceeds to repay its term loan B facility and outstanding construction loan debt aggregating
$827.5 million and repaid $50 million of its outstanding term loan A facility while increasing its revolver capacity by $50 million. 25Strategic Investment Approach to Maintain a High-Quality Portfolio
Capital expenditures ensure that temperature-controlled warehouses
meet the “mission-critical” role they serve in the cold chain
As a % of Total Warehouse NOI before R&M Expense
2015A 2016A 2017A
14.0% 14.2%
13.1%
12.2% 12.4%
11.7%
1.0%
1.1% 1.4% 0.5%
1.0% 0.9% 8.4%
8.7% 7.8%
11.0%
9.5% 9.9%
5.3% 5.7% 5.4%
Recurring
1A R&M
2A 3A Recurring
4A R&M
5A 6A Recurring
7A R&M
8A
Capex (1) Expense (2) Capex (1) Expense (2) Capex (1) Expense (2)
(Capitalized) (Expensed – P/L) (Capitalized) (Expensed – P/L) (Capitalized) (Expensed – P/L)
Real Estate Personal Property Information Technology
Note: Dollars in million. Figures may not sum due to rounding
(1) Recurring capital expenditures are incurred to extend the life of, and provide future economic benefit from, our existing temperature-controlled warehouse network and its
existing supporting personal property and information technology systems. Examples include replacing roof and refrigeration equipment, re-racking warehouses and
implementing energy efficient projects. Personal property capital expenditures include material handling equipment (e.g. fork lifts and pallet jacks) and related batteries.
Information technology expenditures include expenditures on existing servers, networking equipment and current software
(2) Repairs and maintenance expense includes costs of normal maintenance and repairs and minor replacements that do not materially extend the life of the property or provide
future economic benefits. Examples include ordinary repair and maintenance on roofs, racking, walls, doors, parking lots and refrigeration equipment. Personal property expense
includes ordinary repair and maintenance expenses on material handling equipment (e.g. fork lifts and pallet jacks) and related batteries 26Experienced Management Team Driving Accelerated Growth
Years with Years of Management team averages over 25 years
Americold Experience of experience in the:
Real estate
Fred Boehler, Chief Executive Officer, President and Trustee 5 29
Temperature-controlled warehouse
Logistics
Marc Smernoff, Chief Financial Officer 3 (1) 22 Manufacturing
Food industries
Team assembled to bring best practices
Thomas Novosel, Chief Accounting Officer 4 35
from across multiple industries to improve
operations
Less than
Jim Snyder, Chief Legal Officer 29 Experience Across Industry-Leading Firms
1
Andrea Darweesh, Chief Human Resources Officer 2 24
Thomas Musgrave, Chief Information Officer 6 24
Bill Sanders, Head of North American Operations 2 29
David Stuver, Distribution Support and Engineering 5 28
Current management team has driven accelerated same store growth
(1) Years with Americold does not include tenure served as Yucaipa shareholder representative from 2004 until joining the Company in 2014 27Shareholder-Friendly Corporate Governance
Independent Trustees / Trustee Key Highlights
George Alburger ─ Former CFO, Liberty Property Trust Majority independent trustees
Bradley Gross ─ Partner, Goldman Sachs & Co.
Committees comprised of independents
James Heistand ─ President & CEO, Parkway Properties
Each trustee subject to annual re-election
Michelle MacKay ─ Senior Advisor, iStar Inc.
No staggered board
Mark Patterson ─ President, MP Realty Advisors
Andrew Power ─ CFO, Digital Realty Trust
Elected to opt out of MUTA
Insiders
Cannot opt into MUTA without shareholder vote (1)
Fred Boehler ─ President & CEO, Americold
No poison pill
Ronald Burkle ─ Founder, The Yucaipa Companies
Jeffrey Gault ─ Non-Executive Chairman
(1) On any such vote, sponsor will vote for and against the matter in the same proportion as the number of votes cast for and against the proposal by other shareholders until its collective ownership
percentage decreases to less than 20% of the outstanding voting power 28Building Blocks of Net Asset Value
Our Business Segments Tangible Assets
Cash and Cash
Warehouse and LTM Total NOI: $354mm $194mm
Equivalents
Related Services Rent & Storage: $329mm +
Warehouse Services: $25mm
+ Accounts Receivable $179mm
+
Third-Party Managed LTM Contribution: $14mm Restricted Cash $19mm
+ +
Investments in Partially
Owned Entities
$16mm
Transportation LTM Contribution: $13mm +
+ Other Assets $42mm
=
Quarry LTM Contribution: $2mm Total
Tangible Assets
$450mm
=
Total Business Segments $383mm Tangible Liabilities
Total Debt (2) $1,571mm
Construction in Progress and Land +
Accounts Payable $233mm
Spent to Date(1): $47mm +
Construction in Progress $103mm of projects under construction Pension Benefits and
$56mm remaining to complete Related Liabilities
$25mm
(Refer to Slide 24 for ROIC) +
Unearned Revenue $18mm
600+ acres =
Land Total
available for future expansion
Tangible Liabilities
$1,847mm
Note: Figures as of LTM March 31, 2018 unless otherwise indicated. Figures may not sum due to rounding
(1) Figure as of March 31, 2018 and excludes $29mm attributable to Clearfield, UT expansion, which was completed in Q4 2017
(2) Gross of discounts and deferred financing costs 29Strong Cash Flow from Growing Demand for Temperature Sensitive Products
Well-positioned to take advantage of favorable industry dynamics
Population growth, global food shortages, urbanization and fresh, Continued Growth in Outsourcing (1)
chilled and frozen food consumption drive demand for temperature-
controlled warehouse space and services
(in million cubic feet)
3,028 3,077 3,138
2,901
Customers continue to outsource their temperature-controlled 2,436 2,498
2,830
warehousing needs to increase efficiency, reduce costs and redeploy
capital into their core businesses
931 978 1,030
772 822 894 767
Inelastic demand in the food industry creates consistent cold chain
demand even during economic downturns 2005 2007 2009 2011 2013 2015 2017
(2)
In-House Outsourced
U.S. Temperature-Controlled Warehouse Industry Revenues (2006A – 2017E) (3)
(in millions)
$5,287
$5,081
$4,900 $4,946
$4,702 $4,769
$4,666 $4,587
$4,237 $4,269 $4,238
$4,069
2006A 2007A 2008A 2009A 2010A 2011A 2012A 2013A 2014A 2015A 2016A 2017E
Global Financial Crisis Global Recession Continues
(1) USDA National Agricultural Statistics Service. Numbers from “Refrigerated Space: By Type of Warehouse” chart. In-house data is not comprehensive with respect to space
owned by distributors and retailers. Note: Gross space. Apple and pear storage capacity not included. Frozen juice tanks included
(2) In 2017, the USDA updated methodology in calculating the domestic capacity of refrigerated warehouse. Historical data has not been recast to reflect this change in definition
(3) IBIS Report as of February 2017 30You can also read


