Historical Contingency in Microbial Resilience to Hydrologic Perturbations - Frontiers
←
→
Page content transcription
If your browser does not render page correctly, please read the page content below
ORIGINAL RESEARCH
                                                                                                                                          published: 09 February 2021
                                                                                                                                       doi: 10.3389/frwa.2021.590378

                                            Historical Contingency in Microbial
                                            Resilience to Hydrologic
                                            Perturbations
                                            Hyun-Seob Song 1,2,3*, James C. Stegen 1 , Emily B. Graham 1,4 and Timothy D. Scheibe 1
                                            1
                                              Earth and Biological Sciences Directorate, Pacific Northwest National Laboratory, Richland, WA, United States,
                                            2
                                              Department of Biological Systems Engineering, University of Nebraska-Lincoln, Lincoln, NE, United States, 3 Department of
                                            Food Science and Technology, Nebraska Food for Health Center, University of Nebraska-Lincoln, Lincoln, NE, United States,
                                            4
                                              School of Biological Sciences, Washington State University, Pullman, WA, United States

                                            Development of reliable biogeochemical models requires a mechanistic consideration
                                            of microbial interactions with hydrology. Microbial response to and its recovery after
                                            hydrologic perturbations (i.e., resilience) is a critical component to understand in this
                                            regard, but generally difficult to predict because the impacts of future events can be
                                            dependent on the history of perturbations (i.e., historical contingency). Fundamental
                                            issues underlying this phenomenon include how microbial resilience to hydrologic
                                            perturbations is influenced by historical contingency and how their relationships vary
                          Edited by:        depending on the characteristics of microbial functions. To answer these questions, we
               Alexis Navarre-Sitchler,     considered a simple microbial community composed of two species that redundantly
            Colorado School of Mines,
                        United States
                                            consume a common substrate but specialize in producing distinct products and
                       Reviewed by:
                                            developed a continuous flow reactor model where the two species grow with trade-offs
                      Laurie Boithias,      along the flow rate. Simulations of this model revealed that (1) the history of hydrologic
              UMR5563 Géosciences
                                            perturbations can lead to the shifts in microbial populations, which consequently affect
              Environnement Toulouse
                         (GET), France      the community’s functional dynamics, and (2) while historical contingency in resilience
                Blake Warren Stamps,        was consistently predicted for all microbial functions, it was more pronounced for
              UES, Inc., United States
                                            specialized functions, compared to the redundant function. As a signature of historical
                   *Correspondence:
                     Hyun-Seob Song
                                            contingency, our model also predicted the emergence of hysteresis in the transitions
                     hsong5@unl.edu         across conditions, a critical aspect that can affect transient formation of intermediate
                                            compounds in biogeochemistry. This work presents microbial growth traits and their
                    Specialty section:
          This article was submitted to
                                            functional redundancy or specialization as fundamental factors that control historical
               Water and Critical Zone,     contingencies in resilience.
                a section of the journal
                       Frontiers in Water   Keywords: microbial communities, hysteresis, trade-offs, trait-based modeling, co-existence, biogeochemistry

          Received: 01 August 2020
         Accepted: 15 January 2021
        Published: 09 February 2021
                                            INTRODUCTION
                            Citation:       Interactions between hydrologic and microbial processes control the cycling of dissolved organic
  Song H-S, Stegen JC, Graham EB
                                            matter and other chemical substrates (Covino et al., 2018) in biogeochemical hotspots such as
    and Scheibe TD (2021) Historical
Contingency in Microbial Resilience to
                                            river corridors (Singer et al., 2016; Graham et al., 2019). Predictive biogeochemical modeling
            Hydrologic Perturbations.       therefore necessitates development of reliable models of the dynamics of microbial populations and
              Front. Water 3:590378.        their interactions with hydrology. For this purpose, it is important to understand how hydrologic
     doi: 10.3389/frwa.2021.590378          inputs alter microbial diversity, abundances, interactions, spatial organization, and functions.

Frontiers in Water | www.frontiersin.org                                           1                                         February 2021 | Volume 3 | Article 590378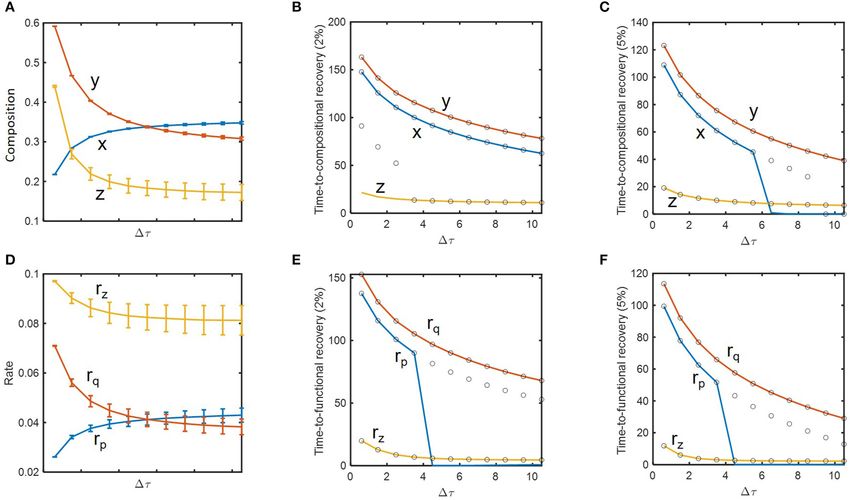
Song et al.                                                                                              Historical Contingency in Microbial Resilience

While specific microbial phenotypes of interest are assumed to            whereby microbial responses to future perturbations are
be definable based on known gene functions and environmental              dependent on past perturbations (Holling, 1996; Allison and
conditions (Jansson and Hofmockel, 2018), their dynamics often            Martiny, 2008; Shade et al., 2012; Song et al., 2015; Martiny
exhibit non-intuitive, complex dynamics under the influence of            et al., 2017). Our model revealed that historical contingencies
the history of perturbations, a phenomenon known as historical            in resilience can be more pronounced for specialized functions
contingency (also termed ecological memory or legacy effect)              associated with individual species, compared to community
(Fukami, 2015; Ogle et al., 2015; Vass and Langenheder, 2017).            functions to which member species commonly contribute,
Despite its critical impact, we do not know much about how                indicating the distribution of growth traits among member
microbial functional responses to hydrologic perturbations are            species plays a controlling role. The model also predicted the
controlled by historical contingencies and how to account for             sophisticated dynamics of microbial communities including
these effects in microbial models (Hawkes and Keitt, 2015).               hysteresis (as an outcome of historical contingency), and
   Historical contingencies of environmental microbial systems            endogenous dynamics (i.e., the continued changes in microbial
have been frequently observed in diverse contexts (Bouskill               populations in the absence of environmental variation).
et al., 2013; Peralta et al., 2013, 2014). For example, microbial         Beyond highlighting the importance of representing the
enzyme activity and respiration in soil that increased with               dynamics of individual species for predictive microbial
moisture were shown to be constrained by previous climate                 community modeling, this work provides a specific model
such as precipitation history (Averill et al., 2016; Hawkes et al.,       structure for parameterization in the context of resilience
2017). As another example, soil systems showed an enhanced                and historical contingency toward predictive ecological and
protection of plants against a pathogen through the induced               biogeochemical modeling.
presence of disease-suppressive microbes by pre-exposure to the
same pathogen in the past, just like an adaptive human immune
system (Raaijmakers and Mazzola, 2016). In a recent study, it was         METHODS
shown that different land use significantly affected the transfer
of soil organic carbon and bacterial diversity and functions in           Design of the Study
surface water runoff (Le et al., 2020). Historical contingencies          Before providing the details on model development and
related to hydrologic perturbations were reported by Goldman              specific metrics used for quantifying the effect of hydrologic
et al. (2017) where the biogeochemical response (i.e., CO2                perturbations on microbial function in the context of historical
flux) of parafluvial hyporheic zone sediments to re-inundation            contingencies, we here provide a brief overview of the design
was contingent on hydrologic history. Goldman et al. (2017)               of our study. Our major goal is to examine how the history
interpreted lower and higher CO2 fluxes in sediment samples               of hydrologic perturbations will drive the composition and
as being caused by relative dominance of fungal and bacterial             functions in microbial communities depending on the microbial
species, respectively. All examples here indicate the importance          growth traits and their trade-offs; how this effect will be
of accounting for the role of microbial species controlling               shown differently for redundant vs. specialized functions among
historical contingencies for predictive biogeochemical modeling.          member species. For this purpose, we formulate a mathematical
While a current trend is to increasingly incorporate microbial            model of a continuous-flow stirred-tank (i.e., well-mixed) reactor
physiology and processes into biogeochemical models (Wieder               where two species competitively grow on the shared nutrient
et al., 2013; Wang et al., 2017), accounting for historical               (S) and produce distinct products (P1 by species 1 and P2
contingencies still remains a challenge due to the lack of                by species 2). This setting enables assessing the impact of
understanding of controlling aspects in microbial systems,                past hydrologic perturbations on microbial functions (i.e.,
severely limiting our ability to reliably predict biogeochemical          historical contingencies of resilience) based on the following two
function (Widder et al., 2016).                                           categories: (1) consumption of S, which represents a function
   As a critical step toward addressing this challenge, we designed       commonly performed among two species and (2) production
an in silico study to examine historical effects on microbial             of P1 and P2 , which exemplify unshared functions uniquely
responses to hydrological perturbations. Inspired by the field            associated with individual species. To account for growth traits
observations of Goldman et al. (2017) that linked biogeochemical          observed in Goldman et al. (2017), we design the kinetics of
historical contingency with the shifts in microbial populations           microbial growth such that species 1 grows faster in lower flow
in a community, we formulated a mathematical model of a                   rates, while species 2 grows faster in higher flow rates. This allows
microbial consortium composed of two competing microbial                  us to examine the effect of the trade-off in growth along the
species growing with different growth traits in a continuous flow         flow rate as a key mechanism for the resilience of community
reactor. In the model, one species grows more effectively in lower        functions, particularly those redundantly shared among member
flow rates and the other species in higher flow conditions so that        species (i.e., the consumption of S). Using the resulting model, we
they hold microbial growth traits as observed in Goldman et al.           assess resilience based the time-to-recovery after perturbations.
(2017). We used this model to test the hypothesis that trade-offs         For generalizable analysis across scales, we provide the final
in individual growth strategies underlie historical contingencies         model equations in dimensionless form. In the following, we
observed at the community level                                           begin model description with theories for the co-existence of
   In this work, we explored how hydrologic history and                   competing microbial species, which is a pre-requisite in building
population dynamics lead to historical contingency of resilience,         a microbial community model.

Frontiers in Water | www.frontiersin.org                              2                                    February 2021 | Volume 3 | Article 590378
Song et al. Historical Contingency in Microbial Resilience
Mechanism for the Coexistence of we additionally considered the exponential term in ρ1 (x1 , x2 ) so
Competing Species that µ1 is suppressed as the population density increases because
Implementation of species co-existence in a community model otherwise co-existence becomes impossible due to the dominance
requires a special consideration because simple kinetics will of species 1.
end up with the dominance by a fast grower due to the
competitive exclusion principle, a classical ecological theory Reaction Stoichiometries and Mass
asserting that only one species can survive the competition
(Hardin, 1960). As one of the simplest mechanisms enabling
Balances
We considered two reactions (R1 and R2 ), respectively driven by
the coexistence of competing organisms in a continuous flow
species 1 and 2 (X1 and X2 ) such that they compete for the shared
reactor setting considered in this work, we chose density-
substrate (S) to produce distinct products (P1 and P2 ):
dependent growth (including flocculation or crowding effect)
(De Leenheer et al., 2006; Haegeman and Rapaport, 2008), while
several other plausible mechanisms are also available, including: R1 :YS1 S → X1 +YP1 P1
spatial heterogeneity (Stephanopoulos and Fredrickson, 1979), (4)
R2 :YS2 S → X2 +YP2 P2
externally imposed temporal fluctuations (Stephanopoulos et al.,
1979; Smith, 1981), endogenously induced temporal fluctuations
through a specific type of interactions (Hsu et al., 1978; Butler where stoichiometric coefficients YSi and YPi (i = 1,2) denote how
et al., 1983), dormancy (Lennon and Jones, 2011), nutrient many quantities of S and Pi are consumed or produced whenever
storage (Revilla and Weissing, 2008), exchange of metabolic a unit mass of biomass is produced through Ri . Specific values of
by-products (Hesseler et al., 2006), and time delay in the YSi and YPi depend on the chemical formulae of S, Xi and Pi , as
nutrient uptake and growth (Freedman et al., 1989). Density- well as their mass units (i.e., mole or gram). For simplicity, we set
dependent growth is a reasonable representation of the growth all stoichiometric coefficients with unity values i.e.,
of microorganisms in natural environments that often form
biofilms in sediments and soils where the growth of inside species R1 :S → X1 +P1
is limited due to lower availability of nutrients along the depth, (5)
R2 :S → X2 +P2
indicating that the overall specific growth can be suppressed by
crowding as the density increases (Roughgarden, 1971). Even
in the case where no biofilm is formed, the density-dependent Note that the resulting reaction stoichiometries above equate the
growth mechanism is still valid in situations where species do not production rates of P1 and P2 with the growth rates of X1 and
effectively distribute in space because cells surrounded by others X2 , respectively.
will have the same difficulty in accessing nutrients as the local To mimic microbial growth in river corridor sediments,
population density increases. we considered a continuous-flow well-mixed reactor where the
substrate is fed through water flow into the sediment as illustrated
Microbial Growth Kinetics in Figure 1A. A continuous flow reactor configuration has been
Based on the density-dependent growth mechanism, we modeled frequently used in the literature as a model system for addressing
specific growth rates of species i (µi ), which are split into ecological questions [e.g., Kraft et al. (2014)] and provides
nutrient- and density-dependent terms, i.e., µ′i (s) and ρi (x1 , x2 ) advantages over batch cultures in studying mixed populations
as follows: (Veldkamp and Jannasch, 1972). Under well-mixed conditions,
dynamic mass balances for microbial populations, substrate, and
µi (s, x1 , x2 ) = µ′i (s)ρi (x1 , x2 ), i = 1, 2 (1) products can be written as follows:
where dxi
= µi (s, x1 , x2 )xi − kd xi , i = 1, 2 (6)
ki s dt
µ′i (s) = (2) ds
Ki + s = −µ1 (s, x1 , x2 )x1 − µ2 (s, x1 , x2 )x2 + D (sin − s) (7)
dt
and dpi
= µi (s, x1 , x2 )xi − Dpi , i = 1, 2 (8)
dt
x + x2
exp (−ax1 ) 1 − 1
, i=1
ρi (x1 , x2 ) = C (3) where xi denote the population size of Xi , s and pi are the
1 − x1 + x2 , i = 2
C concentrations of S and Pi , t is the time, µi denotes the specific
growth rate (1/time) of Xi (mass/volume), kd is the specific death
As shown in Equation (3), we imposed environmental constraints rate (1/time) fixed as constant, D is the dilution rate (1/time), and
(such as limited space and resources) on both organisms to the subscript in represents the quantities associated with the inlet
limit the total population of the community below a given feed flow, respectively. As implied by the same notation of kd for
carrying capacity (C). Species 1 was chosen to have faster species 1 and 2, we assumed no difference in the specific death
growth kinetics in this work, i.e., µ′1 (s) > µ′2 (s). Therefore, rate between the two organisms.
Frontiers in Water | www.frontiersin.org 3 February 2021 | Volume 3 | Article 590378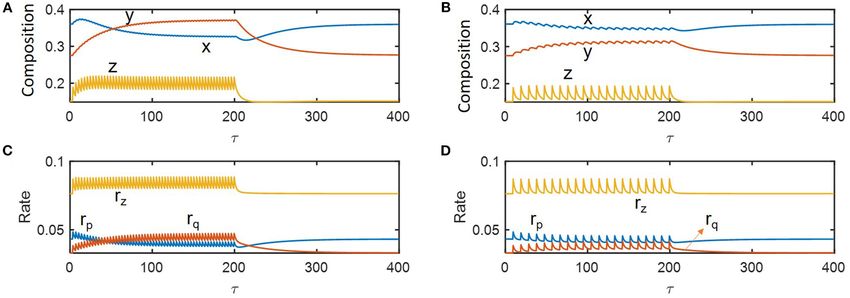
Song et al. Historical Contingency in Microbial Resilience
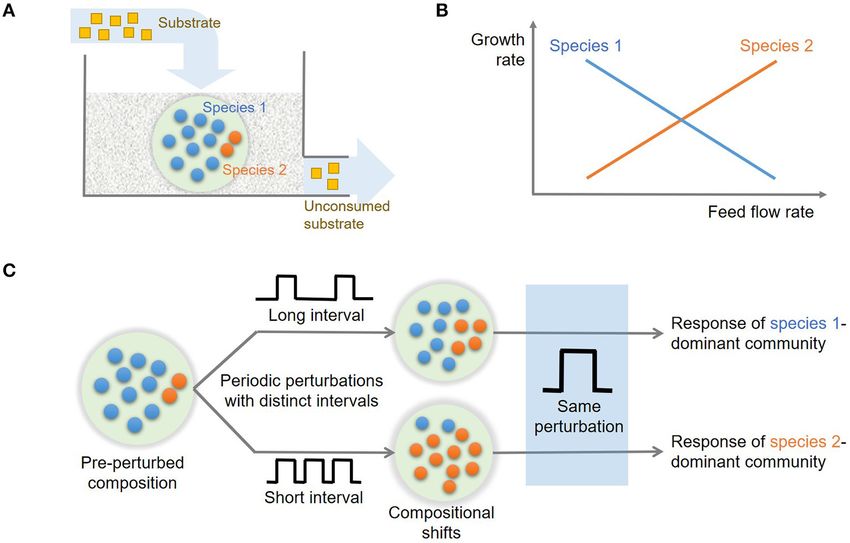
FIGURE 1 | Conceptual model to investigate historical contingencies in microbial response to hydrologic perturbations: (A) a continuous flow reactor configuration for
competitive growth of two microbial species on a shared substrate in a homogeneous environment, (B) trade-offs in microbial growth along the flow rate gradient, and
(C) expected compositional changes driven by the history of hydrologic perturbations.
Non-dimensionalization TABLE 1 | Definitions of dimensionless variables and parameters contained in the
For scale independence, we non-dimensionalized the equations model.
as follows: Dimensionless Definition Dimensionless Definition
variable parameter
k1
dx Time, τ tr 1 (sin ) Reaction rate constant for
= f x, y, z x − λx species 1, kx (= 1.2)
r1 (sin )
dτ
x1 k2
dy Population of
sin
Reaction rate constant for
r1 (sin )
= g x, y, z y − λy (9) species 1, x species 2, ky (= 1.2)
dτ x2 K1
dz Population of Half saturation constant
sin sin
= −f x, y, z x − g x, y, z y + δ (1 − z) (10) species 2, y for species 1, Kx (= 0.2)
dτ s K2
Nutrient Half saturation constant
dp sin sin
= f x, y, z x − δp (11) concentration, z for species 2, Ky (= 0.4)
dτ D
Dilution rate, δ Parameter denoting sin a
dq r1 (sin )
density dependence,
= g x, y, z y − δq (12)
dτ α (= 1.25)
C
Carrying capacity, κ (= 1)
where sin
kd
Cell death rate, λ (= 0.12)
r1 (sin )
kx z −αx x+y
f x, y, z = Kx + z e 1− κ
ky z x+y
(13)
g x, y, z = Ky + z 1 − κ
Metrics for Resilience
Definitions of dimensionless variables and parameters used in We imposed hydrologic perturbation by fluctuating the dilution
the above equations were provided in Table 1. The values of rate following a rectangle-shaped wave. Based on the concept of
kinetic parameters kx , Kx , ky , and Ky in Equation (13) were engineering resilience (Holling, 1996; Song et al., 2015), we used
derived from the flocculation model by Haegeman and Rapaport “time-to-recovery” as a measure of resilience, i.e., how quickly
(2008). Nutrient concentration in the feed flow in the last term of a chosen system variable or function recovers the pre-perturbed
Equation (10) was set to 1 due to the normalization with respect state, while other metrics could also be considered (Hillebrand
to itself. et al., 2018). Key variables and functions of interest in this work
Frontiers in Water | www.frontiersin.org 4 February 2021 | Volume 3 | Article 590378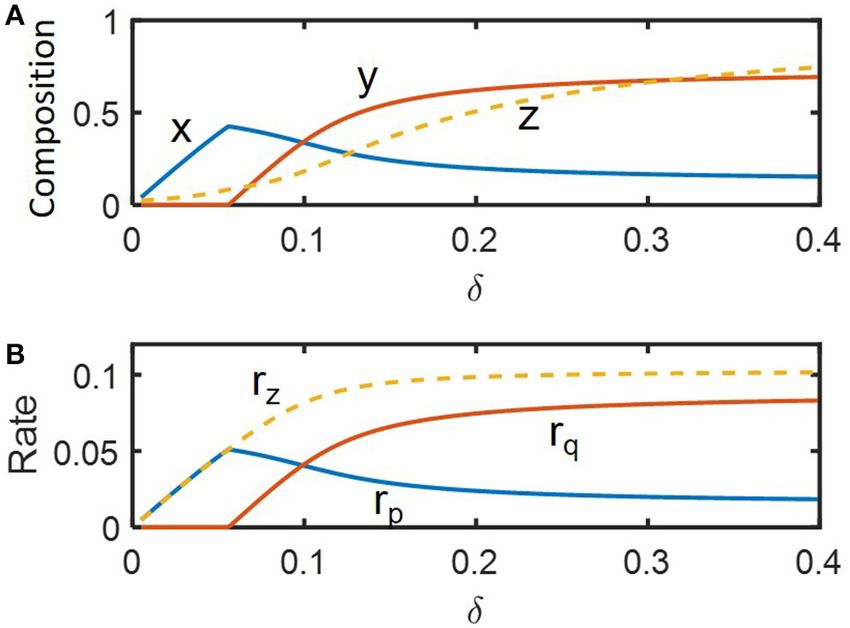
Song et al.                                                                                                   Historical Contingency in Microbial Resilience

include: microbial and chemical compositions (i.e., x, y, and z)
and their associated functions such as consumption rate of z (i.e.,
rz ≡ −fx − gy) and production rates of p (i.e., rp ≡ fx) and q
(i.e., rq ≡ gy). These rates represent redundant (rz ) and unique
functions (rp and rq ) among member species.
    In quantifying the resilience of a chosen variable or function
among those mentioned above, we ensured the system to be
exposed to a cyclic perturbation of dilution rate for a sufficient
time period; when the system reached a sustained oscillation, we
stopped imposing perturbation and started to measure time-to-
recovery. We used two different metrics for the time-to-recovery
as defined below:
• Hitting time is when the variable or function hits the pre-
  perturbed level for the first time. We measured this as the
  first time when the variable hits an upper or lower boundary
  of the band around the pre-perturbed level. The bandwidth
  was defined by the 2 and 5% values above and below the                   FIGURE 2 | The changes in key variables and functions in steady state as a
  pre-perturbed level.                                                     function of flow rate (δ): (A) species abundances (x and y) and substrate
• Settling time is the time required for the variable or function          concentration (z), and (B) consumption rate of the shared substrate (rz ) and
  to finally reach and remain within a given band of the                   production rates of distinct products (rp and rq ).
  pre-perturbed level. This quantity needs to be distinguished
  from hitting time when the system recovery takes place in
                                                                          rates on the dilution rate, i.e., x decreased with δ, while y
  an oscillatory way so that it may touch the boundaries of the
                                                                          increased, so that their population curves intersect at δ ≈ 0.1.
  band more than one time. In this case, the first and last times
                                                                          This shows that species 1 is more competitive in lower flow rate
  that the nutrient profile crosses the boundaries of the band
                                                                          conditions, while species 2 can grow faster in the higher flow rate
  correspond to hitting and settling times, respectively. If there
                                                                          regime, confirming that the parameter setting in our model leads
  are no oscillations during the post-perturbation period, hitting
                                                                          to the expected microbial growth traits as indicated in Methods
  and settling times are identical. In measuring the settling time,
                                                                          (also see Figure 1B)
  we considered 2 and 5% bandwidths as defined above.
                                                                             Similar trends were observed for community functions such
                                                                          as consumption rate of the shared substrate (rz ) and production
RESULTS                                                                   rates of distinct products (rp and rq ) (Figure 2B). As the
                                                                          conversion rate of z (rz ) includes the contribution from both
Using a model of microbial community growing in a                         species that competitively consume the shared substrate, the
homogenous continuous flow reactor (Figure 1A), we test                   function rz showed milder changes over δ ≥ 0.05, compared
the following hypotheses: (H1) distinct growth traits and their           to specialized functions (rp and rq ) that are uniquely associated
trade-offs along the flow rate gradient (Figure 1B) leads to              with only one species. As will be discussed more in the follow-up
the shifts in the community composition subject to hydrologic             section, the trade-off in growth traits of the two species provides
perturbations with different intervals, (H2) the resulting                a mechanistic basis for enhanced resilience of the community.
microbial communities dominated by species 1 or 2 will show               We used the steady state profiles in Figure 2 as a guide map
distinct responses to future perturbations (Figure 1C), and (H3)          to identify distinct operating zones where the system shows
the extent of historical contingencies in microbial functions             qualitatively different dynamics.
depend on their redundancy or specialization, i.e., whether a
given functions is performed in common among multiple species             Compositional and Functional Responses
or uniquely associated with specific organisms.                           to Hydrologic Perturbations
                                                                          We performed dynamic simulations to examine how microbial
Trade-Off in Microbial Growth Traits in                                   communities respond to hydrologic perturbations. Disturbances
Steady State                                                              were imposed by periodically changing the dilution rate (δ)
We examined how state variables including species abundances              between pre-chosen nominal (i.e., pre-perturbed) (δnorm = 0.09)
(x and y) and substrate concentration (z) vary along the dilution         and inundated conditions (0.19) (following a rectangular shape
rate (δ) (Figure 2A), which are dimensionless variables of x1 ,           in time). For illustration, we simulated compositional and
x2 , s, and D (Methods). The values of x, y, and z in Figure 2A           functional responses to the two specific cycles of perturbations
denote their steady-state values that change as a function of δ.          with the inundation intervals of 3.5 and 9.5 imposed over 0 ≤
For very low dilution rates (i.e., δ ≤ 0.05), species 2 (y) could         τ ≤ 200 (Figure 3). Among the three state variables denoting
not survive the competition with species 1 (x). In this regime, x         microbial and chemical compositions (x, y, and z), z showed the
linearly increased with δ as the supply of substrate accordingly          most significant fluctuation in time because the substrate was
increased. For higher dilution rates above the threshold, two             being fed into the reactor while microorganisms were not. As
species coexisted with the opposite dependence of their growth            species 1 is a faster grower at the nominal flow rate (δ = 0.09) and

Frontiers in Water | www.frontiersin.org                              5                                          February 2021 | Volume 3 | Article 590378
Song et al. Historical Contingency in Microbial Resilience
FIGURE 3 | Microbial response to periodic change of the inlet flow (δ) between 0.09 and 0.19: (A,C) perturbation interval of 3.5, and (B,D) perturbation interval of 9.5.
The periodic perturbation was imposed over 0 ≤ τ ≤ 200 and released afterwards.
species 2 grows faster following inundation (δ = 0.19) (Figure 2), of engineering resilience, i.e., the rate of return to the pre-
the abundances of species 1 and 2, respectively decreased and perturbed state (Holling, 1996; Allison and Martiny, 2008;
increased under periodic inundation (Figures 3A,B). That is, in Shade et al., 2012; Song et al., 2015; Martiny et al., 2017), we
the case of the shorter inundation interval (i.e., 3.5), species evaluated the system’s resilience based on time-to-recovery such
dominance was switched over from x to y (Figure 3A), while the as hitting and settling times with 2 and 5% criteria as defined
original composition was recovered after periodic perturbation in Methods. For δnorm = 0.09 (as previously considered), we
was stopped. This result supported our hypothesis on the effect examined how state variables and their recovery times change
of hydrological perturbations on microbial populations (H1). as a function of inundation interval (Figures 4A–C). In support
Similar trends were observed for functional responses including of the hypothesis H1, state variables including microbial (x, y)
production rates of products (rp and rq ) and consumption rate and chemical compositions (z) changed as a function of dilution
of the shared substrate (rz ). Temporal fluctuations of rp and rq rate. This change was significant in the regime where inundation
were more significant than those of their populations (x and y) intervals were small (i.e., when perturbation frequencies were
because rp and rq are functions of substrate concentration as well high) (Figure 4A), while the time-to-compositional recovery did
as species abundances. not show such a sharp increase over the corresponding regime
Even in this simple simulation setting, we found several (Figure 4B). For x and z, the hitting time (solid line) was not
interesting dynamics: (1) species 1 (x) showed inverse responses always the same as the settling time (open circle), meaning
(i.e., the initial change in its abundance in a direction opposite that these variables first entered the area within 2 or 5% range
to the final outcome) when periodic inundation was stopped at of the nominal (i.e., pre-perturbed) values and later escaped
τ = 200, while such over- or under-shooting was suppressed them prior to ultimately returning to pre-perturbation conditions
for species 2 and substrate concentration; (2) the deviation (Figures 4B,C). The time-to-recovery for z was shorter than
of rz during periodic perturbation was the least significant those for x and y as indicated by the result in the previous section.
among others (when evaluated based on the minimum values Many of these trends observed from compositional variables
of fluctuation); and (3) the recovery of rz was the fastest among (x, y, and z) were reproduced for functional variables (rp ,
others. The result (1) indicates that species 1 with relatively fast rq , and rz ) (Figures 4D–F). As a notable difference, however,
dynamics and high momentum can show complex dynamics rz showed suppressed changes compared to z due to the
(such as inverse response). The results (2) and (3) partially functional compensation from member species as explained
supported the hypotheses H2 and H3 by showing the highest earlier. Consequently, the time-to-functional recovery for rz
resilience for rz , which may be ascribable to the functional not only was significantly lower than those for rx and ry ,
compensation from member species with growth trade-off. In the but also showed a milder dependence on inundation interval
next section, these two hypotheses are more rigorously addressed (Figures 4E,F). These results provide a clear support for
based on the quantification of time-to-recovery in response H2 and H3.
to perturbations.
Hysteresis in Transition Across Two
Historical Contingencies in Resilience Distinct Perturbation Cycles
We performed a more thorough analysis of how resilience is As shown in Figures 5A,B, we simulated sustained oscillations
influenced by historical contingencies. Based on the concept of compositional (x, y, and z) and functional variables (rp , rq ,
Frontiers in Water | www.frontiersin.org 6 February 2021 | Volume 3 | Article 590378Song et al. Historical Contingency in Microbial Resilience
FIGURE 4 | The impact of perturbation interval (1τ ) on species abundances, substrate concentration, microbial functions, and their time-to-recoveries: (A) microbial
(x and y) and chemical compositions (z), (B) time-to-compositional recovery calculated by the 2% criterion, (C) time-to-compositional recovery calculated by the 5%
criterion, (D) consumption rate of the shared substrate (rz ) and production rates of distinct products (rp and rq ), (E) time-to-functional recovery calculated by the 2%
criterion, (F) time-to-functional recovery calculated by the 5% criterion. In (B,C,E, and F), solid lines and open circles denote hitting and settling times, respectively.
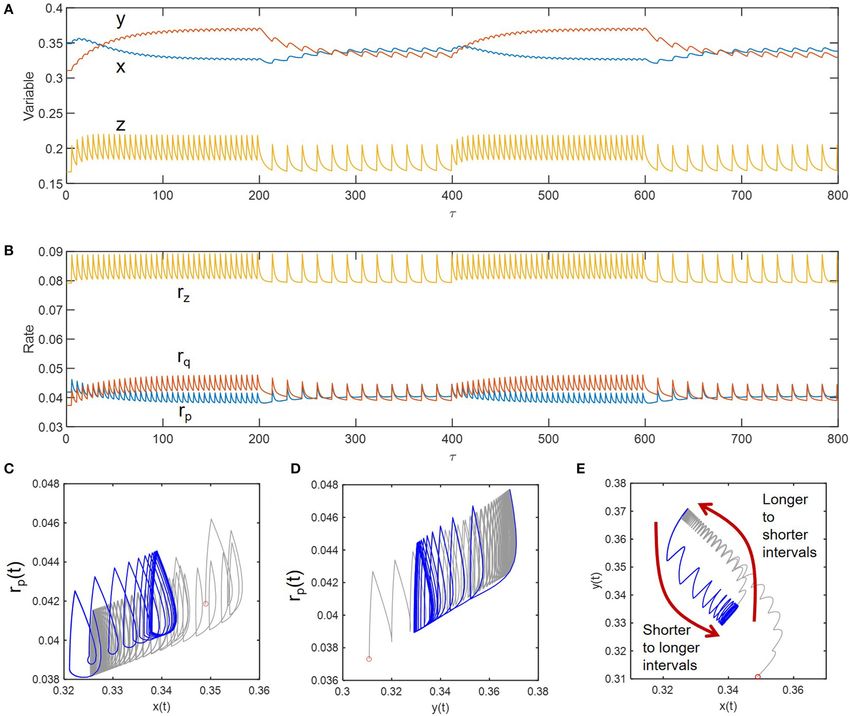
and rz ) at two different inundation intervals (5 and 15) to see trade-offs. Our model enabled us to reveal important aspects of
how the transitions occur between them. Consideration of these resilience and its historical contingencies as summarized below.
two intervals (wider than those considered the previous case) was Historical contingency in the resilience of microbial systems
to ensure the dramatic differences in the fluctuation patterns so was significantly affected by the degree of functional redundancy
that one can see transition trajectories more clearly. We initially or specialization. Redundant functions commonly performed
imposed the periodic perturbation with the interval of 5 and by multiple species (such as the consumption rate of the
when sustained oscillation was reached (i.e., at τ = 200), switched shared substrate in this work) were more readily recovered
to the interval of 15 – this process was repeated afterwards. Phase from perturbations, while specialized functions associated with
diagrams in Figures 5C–E showed the existence of hysteresis in individual species (such as the production rates of distinct
the transition between the two periodically perturbed conditions products by species 1 and 2) showed slower recovery.
with distinct intervals. The transition between the two limit cycles Consequently, historical contingencies in resilience were more
formed by periodic perturbations with intervals of 5 and 15 pronounced for specialized functions partitioned only into
occurred through different trajectories. The hysteresis was most specific species. The enhanced resilience for redundant functions
effectively shown for the phase diagram of the two compositional performed by majority of species is ascribable to their
variables (x and y) (Figure 5C). compensating roles in contributing to a total biomass stock that
is more robust to disturbances than individual species. Related to
DISCUSSION this, we also found that the compositional recovery of microbial
populations was prolonged even after a certain community
A growing body of data indicate critical effects of historical function (e.g., the substrate consumption rate) became stable.
contingency in biogeochemistry and microbial ecology, but While this endogenous dynamics was discussed as an intrinsic
theoretical frameworks that can predict the sophisticated characteristic of compositionally complex natural communities
behavior of environmental systems are still lacking. In this study, (Konopka et al., 2015; Song et al., 2015), our model demonstrated
we formulated a mathematical model of a minimal complexity that even structurally simple communities can develop those
to reveal how historical contingencies in resilience to hydrologic subtle dynamics in the process of stabilizing microbial functions
perturbations are driven by microbial growth traits and their against perturbations. Our work therefore provides a minimal
Frontiers in Water | www.frontiersin.org 7 February 2021 | Volume 3 | Article 590378Song et al. Historical Contingency in Microbial Resilience
FIGURE 5 | Hysteresis in dynamic transitions between the two distinctively perturbed conditions with the intervals of 5 and 15: (A) compositional fluctuations, (B)
functional fluctuations, and (C–E) phase diagrams. Curves in gray and blue, respectively denote the transitions from longer to shorter intervals and from shorter to
longer intervals.
structure of model for studying a mechanistic linkage between transitions when microbial communities undergo the dynamic
endogenous dynamics, functional redundancy, resilience, and shifts in their composition and functions through different
historical contingency. trajectories. The lack of understanding of hysteric behaviors in
As an outcome of historical contingency, we also observed microbial communities therefore may cause a significant error in
hysteresis, whereby the system takes different routes in model predictions, particularly for those associated with specific
transitioning across conditions. Hysteresis of biological systems organisms, the populations of which undergo a more significant
has been typically reported based on forward and backward dynamic variation than the total community biomass.
trajectories of state variables between multiple steady states (Kim Our work offers a direction toward building more mechanistic
et al., 2012; Gedeon et al., 2018), but the hysteresis in this work is biogeochemical models. Stronger historical contingencies of
defined in a more dynamic context, i.e., as being characterized specialized functions as predicted by the model highlights the
by distinct transient paths between two sustained oscillations importance of representing distinct traits of individual species
maintained across different inundation intervals. As a signature for predictive modeling – because the lumped description
of historical contingency, a predictive understanding of hysteresis based on community-level properties such as the total biomass
is critically important because it can lead to the unexpected and/or carbon use efficiency cannot predict complex aspects
formation of intermediate chemical compounds during the of biogeochemical function such as resilience and historical
Frontiers in Water | www.frontiersin.org 8 February 2021 | Volume 3 | Article 590378Song et al. Historical Contingency in Microbial Resilience
contingency driven by the interplay between distinct microbial DATA AVAILABILITY STATEMENT
species. In this regard, model extension though linking
conceptualized microbial functions with specific biogeochemical The datasets presented in this study can be found in online
pathways would be an important next step. Two reaction repositories. The names of the repository/repositories and
pathways driven by species 1 and 2 considered in our model accession number(s) can be found below: https://github.com/
can be translated as specific biogeochemical pathways, for hyunseobsong/history.
example, such as denitrification and anammox, i.e., once NO− 3
is converted to NO− 2 (as the first step of denitrification), the AUTHOR CONTRIBUTIONS
subsequent reaction paths bifurcated afterwards are driven by
distinct microbial functional groups. Therefore, this type of H-SS developed the modeling concept and performed
model that has both redundant (i.e., conversion of NO− −
3 to NO2 )
simulations. H-SS drafted out the article, which was
and specialized functions (i.e., conversion afterwards through edited by JS and EG. All authors contributed to
two pathways) would be suitable for investigating function- the design of the research, read and approved the
specific resilience and historical contingencies as demonstrated final manuscript.
in our study. For this direction, trait-based modeling approaches
that appropriately combine the concepts of functional guilds FUNDING
and functional enzymes should be considered as an appropriate
modeling framework (Allison, 2012; Bouskill et al., 2012; Song This research was supported by the U.S. Department of Energy,
et al., 2014, 2017). We expect that accounting for individual Office of Science, Office of Biological and Environmental
growth rates, and species-associated specific biogeochemical Research, Environmental System Science (ESS) program through
traits will significantly improve predictive capabilities for multi- subcontract to the River Corridor Scientific Focus Area project at
scale hydrobiogeochemical models. Pacific Northwest National Laboratory.
REFERENCES Goldman, A. E., Graham, E. B., Crump, A. R., Kennedy, D. W., Romero, E.
B., Anderson, C. G., et al. (2017). Biogeochemical cycling at the aquatic-
Allison, S. D. (2012). A trait-based approach for modelling terrestrial interface is linked to parafluvial hyporheic zone inundation history.
microbial litter decomposition. Ecol. Lett. 15, 1058–1070. Biogeosciences 14, 4229–4241. doi: 10.5194/bg-14-4229-2017
doi: 10.1111/j.1461-0248.2012.01807.x Graham, E. B., Stegen, J. C., Huang, M. Y., Chen, X. Y., and Scheibe, T. D.
Allison, S. D., and Martiny, J. B. H. (2008). Resistance, resilience, and redundancy (2019). Subsurface biogeochemistry is a missing link between ecology and
in microbial communities. Proc. Natl. Acad. Sci. U. S. A. 105, 11512–11519. hydrology in dam-impacted river corridors. Sci. Total Environ. 657, 435–445.
doi: 10.1073/pnas.0801925105 doi: 10.1016/j.scitotenv.2018.11.414
Averill, C., Waring, B. G., and Hawkes, C. V. (2016). Historical precipitation Haegeman, B., and Rapaport, A. (2008). How flocculation can explain coexistence
predictably alters the shape and magnitude of microbial functional response in the chemostat. J. Biol. Dyn. 2, 1–13. doi: 10.1080/17513750801942537
to soil moisture. Glob. Chang. Biol. 22, 1957–1964. doi: 10.1111/gcb. Hardin, G. (1960). The competitive exclusion principle. Science 131, 1292–1297.
13219 doi: 10.1126/science.131.3409.1292
Bouskill, N. J., Lim, H. C., Borglin, S., Salve, R., Wood, T. E., Silver, W. L., Hawkes, C. V., and Keitt, T. H. (2015). Resilience vs. historical contingency
et al. (2013). Pre-exposure to drought increases the resistance of tropical in microbial responses to environmental change. Ecol. Lett. 18, 612–625.
forest soil bacterial communities to extended drought. Isme J. 7, 384–394. doi: 10.1111/ele.12451
doi: 10.1038/ismej.2012.113 Hawkes, C. V., Waring, B. G., Rocca, J. D., and Kivlin, S. N. (2017). Historical
Bouskill, N. J., Tang, J., Riley, W. J., and Brodie, E. L. (2012). Trait- climate controls soil respiration responses to current soil moisture. Proc. Natl.
based representation of biological nitr fication: model development Acad. Sci. U. S. A. 114, 6322–6327. doi: 10.1073/pnas.1620811114
testing, and predicted community composition. Front. Microbiol. 3:364. Hesseler, J., Schmidt, J. K., Reichl, U., and Flockerzi, D. (2006). Coexistence in
doi: 10.3389/fmicb.2012.00364 the chemostat as a result of metabolic by-products. J. Math. Biol. 53, 556–584.
Butler, G. J., Hsu, S. B., and Waltman, P. (1983). Coexistence of competing doi: 10.1007/s00285-006-0012-3
predators in a chemostat. J. Math. Biol. 17, 133–151. doi: 10.1007/BF00305755 Hillebrand, H., Langenheder, S., Lebret, K., Lindstrom, E., Ostman, O., and
Covino, T., Golden, H. E., Li, H. Y., and Tang, J. Y. (2018). Aquatic carbon- Striebel, M. (2018). Decomposing multiple dimensions of stability in global
nutrient dynamics as emergent properties of hydrological, biogeochemical, and change experiments. Ecol. Lett. 21, 21–30. doi: 10.1111/ele.12867
ecological interactions: scientific advances. Water Resour. Res. 54, 7138–7142. Holling, C. S. (1996). Engineering resilience vs. ecological resilience. Eng. Ecol.
doi: 10.1029/2018WR023588 Const. 31:32.
De Leenheer, P., Angeli, D., and Sontag, E. D. (2006). Crowding effects Hsu, S. B., Hubbell, S. P., and Waltman, P. (1978). Competing predators. SIAM J.
promote coexistence in the chemostat. J. Math. Anal. Appl. 319, 48–60. Appl. Math. 35, 617–625. doi: 10.1137/0135051
doi: 10.1016/j.jmaa.2006.02.036 Jansson, J. K., and Hofmockel, K. S. (2018). The soil microbiome - from
Freedman, H. I., So, J. W. H., and Waltman, P. (1989). Coexistence in a model metagenomics to metaphenomics. Curr. Opin. Microbiol. 43, 162–168.
of competition in the chemostat incorporating discrete delays. SIAM J. Appl. doi: 10.1016/j.mib.2018.01.013
Math. 49, 859–870. doi: 10.1137/0149050 Kim, J. I., Song, H. S., Sunkara, S. R., Lali, A., and Ramkrishna, D.
Fukami, T. (2015). Historical contingency in community assembly: integrating (2012). Exacting predictions by cybernetic model confirmed experimentally:
niches, species pools, and priority effects. Annu. Rev. Ecol. Evol. Syst. 46, 1–23. steady state multiplicity in the chemostat. Biotechnol. Prog. 28, 1160–1166.
doi: 10.1146/annurev-ecolsys-110411-160340 doi: 10.1002/btpr.1583
Gedeon, T., Cummins, B., Harker, S., and Mischaikow, K. (2018). Identifying Konopka, A., Lindemann, S., and Fredrickson, J. (2015). Dynamics in microbial
robust hysteresis in networks. PLoS Comput. Biol. 14:e1006121. communities: unraveling mechanisms to identify principles. Isme J. 9,
doi: 10.1371/journal.pcbi.1006121 1488–1495. doi: 10.1038/ismej.2014.251
Frontiers in Water | www.frontiersin.org 9 February 2021 | Volume 3 | Article 590378Song et al. Historical Contingency in Microbial Resilience
Kraft, B., Tegetmeyer, H. E., Meier, D., Geelhoed, J. S., and Strous, M. (2014). Song, H. S., Renslow, R. S., Fredrickson, J. K., and Lindemann, S. R.
Rapid succession of uncultured marine bacterial and archaeal populations (2015). Integrating ecological and engineering concepts of resilience in
in a denitrifying continuous culture. Environ. Microbiol. 16, 3275–3286. microbial communities. Front. Microbiol. 6:1298. doi: 10.3389/fmicb.2015.
doi: 10.1111/1462-2920.12552 01298
Le, H. T., Rochelle-Newall, E., Ribolzi, O., Janeau, J. L., Huon, S., Latsachack, K., Song, H. S., Thomas, D. G., Stegen, J. C., Li, M. J., Liu, C. X., Song, X. H., et al.
et al. (2020). Land use strongly influences soil organic carbon and bacterial (2017). Regulation-structured dynamic metabolic model provides a potential
community export in runoff in tropical uplands. Land Degr. Dev. 31, 118–132. mechanism for delayed enzyme response in denitrification process. Front.
doi: 10.1002/ldr.3433 Microbiol. 8:1866. doi: 10.3389/fmicb.2017.01866
Lennon, J. T., and Jones, S. E. (2011). Microbial seed banks: the ecological Stephanopoulos, G., and Fredrickson, A. G. (1979). Effect of spatial
and evolutionary implications of dormancy. Nat. Rev. Microbiol. 9, 119–130. inhomogeneities on the coexistence of competing microbial-populations.
doi: 10.1038/nrmicro2504 Biotechnol. Bioeng. 21, 1491–1498. doi: 10.1002/bit.260210817
Martiny, J. B. H., Martiny, A. C., Weihe, C., Lu, Y., Berlemont, R., Brodie, E. L., Stephanopoulos, G., Fredrickson, A. G., and Aris, R. (1979). The growth of
et al. (2017). Microbial legacies alter decomposition in response to simulated competing microbial-populations in a cstr with periodically varying inputs.
global change. Isme J. 11, 490–499. doi: 10.1038/ismej.2016.122 Aiche J. 25, 863–872. doi: 10.1002/aic.690250515
Ogle, K., Barber, J. J., Barron-Gafford, G. A., Bentley, L. P., Young, J. M., Huxman, Vass, M., and Langenheder, S. (2017). The legacy of the past: effects of historical
T. E., et al. (2015). Quantifying ecological memory in plant and ecosystem processes on microbial metacommunities. Aquat. Microb. Ecol. 79, 13–19.
processes. Ecol. Lett. 18, 221–235. doi: 10.1111/ele.12399 doi: 10.3354/ame01816
Peralta, A. L., Ludmer, S., and Kent, A. D. (2013). Hydrologic history Veldkamp, H., and Jannasch, H. W. (1972). Mixed culture studies
influences microbial community composition and nitrogen cycling under with the chemostat. J. Appl. Chem. Biotechnol. 22, 105–123.
experimental drying/wetting treatments. Soil Biol. Biochem. 66, 29–37. doi: 10.1002/jctb.5020220113
doi: 10.1016/j.soilbio.2013.06.019 Wang, K. F., Peng, C. H., Zhu, Q. A., Zhou, X. L., Wang, M., Zhang, K.
Peralta, A. L., Ludmer, S., Matthews, J. W., and Kent, A. D. (2014). R., et al. (2017). Modeling global soil carbon and soil microbial carbon by
Bacterial community response to changes in soil redox potential along integrating microbial processes into the ecosystem process model TRIPLEX-
a moisture gradient in restored wetlands. Ecol. Eng. 73, 246–253. GHG. J. Adv. Model. Earth Syst. 9, 2368–2384. doi: 10.1002/2017MS
doi: 10.1016/j.ecoleng.2014.09.047 000920
Raaijmakers, J. M., and Mazzola, M. (2016). Soil immune responses soil Widder, S., Allen, R. J., Pfeiffer, T., Curtis, T. P., Wiuf, C., Sloan, W.
microbiomes may be harnessed for plant health. Science 352, 1392–1393. T., et al. (2016). Challenges in microbial ecology: building predictive
doi: 10.1126/science.aaf3252 understanding of community function and dynamics. Isme J. 10, 2557–2568.
Revilla, T., and Weissing, F. J. (2008). Nonequilibrium coexistence in a competition doi: 10.1038/ismej.2016.45
model with nutrient storage. Ecology 89, 865–877. doi: 10.1890/07-1103.1 Wieder, W. R., Bonan, G. B., and Allison, S. D. (2013). Global soil carbon
Roughgarden, J. (1971). Density-dependent natural selection. Ecology 52, 453–468. projections are improved by modelling microbial processes. Nat. Clim. Chang.
doi: 10.2307/1937628 3, 909–912. doi: 10.1038/nclimate1951
Shade, A., Peter, H., Allison, S. D., Baho, D. L., Berga, M., Burgmann, H., et al.
(2012). Fundamentals of microbial community resistance and resilience. Front. Conflict of Interest: The authors declare that the research was conducted in the
Microbiol. 3:417. doi: 10.3389/fmicb.2012.00417 absence of any commercial or financial relationships that could be construed as a
Singer, M. B., Harrison, L. R., Donovan, P. M., Blum, J. D., and Marvin-Dipasquale, potential conflict of interest.
M. (2016). Hydrologic indicators of hot spots and hot moments of mercury
methylation potential along river corridors. Sci. Total Environ. 568, 697–711. Copyright © 2021 Song, Stegen, Graham and Scheibe. This is an open-access article
doi: 10.1016/j.scitotenv.2016.03.005 distributed under the terms of the Creative Commons Attribution License (CC BY).
Smith, H. L. (1981). Competitive coexistence in an oscillating chemostat. SIAM J. The use, distribution or reproduction in other forums is permitted, provided the
Appl. Math. 40, 498–522. doi: 10.1137/0140042 original author(s) and the copyright owner(s) are credited and that the original
Song, H.-S., Cannon, W. R., Beliaev, A. S., and Konopka, A. (2014). Mathematical publication in this journal is cited, in accordance with accepted academic practice.
modeling of microbial community dynamics: a methodological review. No use, distribution or reproduction is permitted which does not comply with these
Processes 2, 711–752. doi: 10.3390/pr2040711 terms.
Frontiers in Water | www.frontiersin.org 10 February 2021 | Volume 3 | Article 590378You can also read