The effect of COVID-19 on the economy: Evidence from an early adopter of localized lockdowns - Journal of Global ...
←
→
Page content transcription
If your browser does not render page correctly, please read the page content below
Electronic supplementary material:
The online version of this article contains supplementary material.

                                                                                                                                                                                    PANDEMIC
                                                                                                                                                                           RESEARCH THEME 1:
© 2021 The Author(s)                                                                          Cite as: Asahi K, Undurraga EA, Valdés R, Wagner R. The effect of COVID-19
JoGH © 2021 ISGH                                                                              on the economy: Evidence from an early adopter of localized lockdowns.
                                                                                              J Glob Health 2021;11:05002.

                                                                                                                                                                           VIEWPOINTS
The effect of COVID-19 on the economy:

                                                                                                                                                                           COVID-19
Evidence from an early adopter of
localized lockdowns
Kenzo Asahi1,2, Eduardo                                   Background Governments worldwide have implemented large-scale non-phar-
A Undurraga1,3,4,5, Rodrigo                               maceutical interventions, such as social distancing or school closures, to prevent
Valdés1,5, Rodrigo Wagner6,7                              and control the growth of the COVID-19 pandemic. These strategies, implement-
                                                          ed with varying stringency, have imposed substantial social and economic costs
 Escuela de Gobierno, Pontificia Uni-
1
                                                          to society. As some countries begin to reopen and ease mobility restrictions, lock-
 versidad Católica de Chile, Santiago,                    downs in smaller geographic areas are increasingly considered an attractive policy
 Región Metropolitana, Chile                              intervention to mitigate societal costs while controlling epidemic growth. Never-
 Centre for Sustainable Urban Devel-
2
                                                          theless, there is a lack of empirical evidence to support these decisions.
 opment (CEDEUS), Chile
 Millennium Nucleus for the Study
3
                                                          Methods Drawing from a rich data set of localized lockdowns in Chile, we used
 of the Life Course and Vulnerability                     econometric methods to measure the reduction in local economic activity from
 (MLIV), Santiago, Chile                                  lockdowns when applied to smaller or larger geographical areas. We measured
 Millennium Initiative for Collabora-
4
                                                          economic activity by tax collection at the municipality-level.
 tive Research in Bacterial Resistance
 (MICROB-R), Santiago, Chile                              Results Our results show that lockdowns were associated with a 10%-15% drop
 Research Center for Integrated Di-
5
                                                          in local economic activity, which is twice the reduction in local economic activity
 saster Risk Management (CIGIDEN),                        suffered by municipalities that were not under lockdown. A three-to-four-month
 Santiago, Chile                                          lockdown had a similar effect on economic activity than a year of the 2009 great
 Business School, Universidad Adolfo
6
                                                          recession. We found costs are proportional to the population under lockdown,
 Ibáñez, Santiago, Chile                                  without differences when lockdowns were measured at the municipality or city-
 Growth Lab, Center for International
7
                                                          wide levels.
 Development, Harvard, Cambridge,
 Massachusetts, USA                                       Conclusions Our findings suggest that localized lockdowns have a large effect on
                                                          local economic activity, but these effects are proportional to the population un-
                                                          der lockdown. Our results suggest that epidemiological criteria should guide de-
                                                          cisions about the optimal size of lockdown areas since the proportional impact of
                                                          lockdowns on the economy seems to be unchanged by scale.

                                                       Despite the historic approvals in the United Kingdom and the United States of a
Correspondence to:                                     COVID-19 vaccine tested in a large clinical trial [1,2], non-pharmaceutical inter-
Eduardo A. Undurraga                                   ventions are still the main strategies to control viral transmission in the COVID-19
Escuela de Gobierno                                    pandemic [3-6]. These interventions range from individual-level recommendations,
Pontificia Universidad Católica de
                                                       such as the use of facemasks or frequent hand-washing, to large-scale regulations
Chile
                                                       and policies, such as large-scale lockdowns and non-essential business closures [7,8].
Vicuña Mackenna 4860
Macul CP 7820436                                       Several countries have achieved some control over the COVID-19 based on a combi-
Región Metropolitana                                   nation of non-pharmaceutical interventions and high levels of testing and isolation
Chile                                                  of infected people [9-15]. However, several countries are going through the second
eundurra@uc.cl                                         wave of infections, and there is a substantial risk of a resurgence of the epidem-

www.jogh.org • doi: 10.7189/jogh.11.05002                                     1                                                    2021 • Vol. 11 • 05002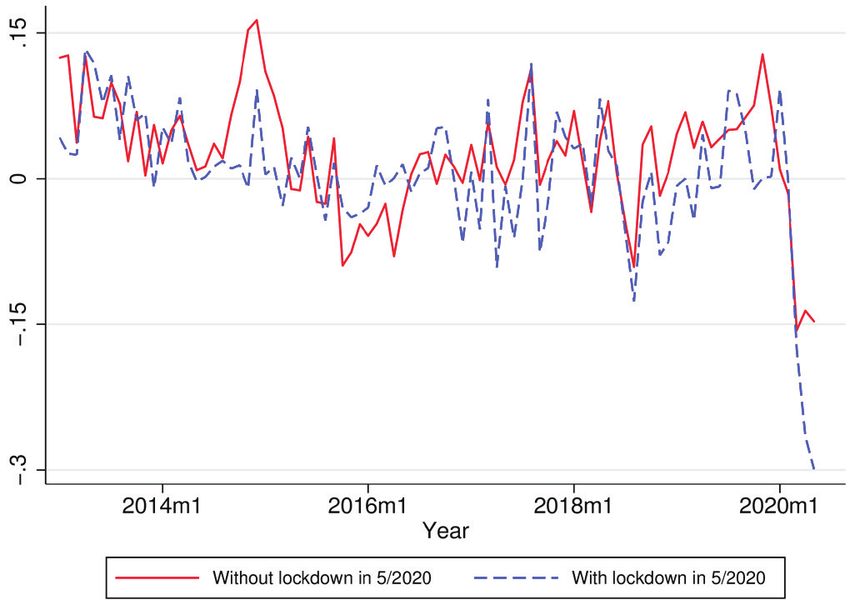
Asahi et al.

                                   ic elsewhere [16-19]. Understanding these interventions' impacts is critical because they will most likely
                                   continue until an effective vaccine becomes available for a substantial proportion of the population [20].
                                   There is still limited empirical evidence of the effects of interventions to prevent viral transmission [3,21].
COVID-19 PANDEMIC
RESEARCH THEME 1:

                                   Most intervention’s impact has been estimated using mathematical models [20,22-26]. The COVID-19
                                   pandemic has already imposed an enormous global burden, with about 72 million cases and one million
                                   deaths reported so far, and substantial social and economic costs from epidemic control measures [27-33].
VIEWPOINTS

                                   As countries have begun to reopen and ease mobility restrictions, localized lockdowns are increasingly con-
                                   sidered a critical element of a non-pharmaceutical toolkit to control COVID-19 resurgence [9,10,23,34,35].
                                   In contrast to nation-wide lockdowns, localized lockdowns are implemented over a limited geographical
                                   area, ranging from a neighbourhood to a city, including suburbs, districts, or towns. Localized lockdowns
                                   may be appealing to policy-makers because, in principle, they would allow countries to reopen and reclose
                                   specific jurisdictions based on local virus transmission dynamics. Large-scale lockdowns are unsustain-
                                   able because of the high costs they impose on the population [15]. Thus, compared to large-scale interven-
                                   tions, localized lockdowns may control transmission hotspots while mitigating some social and economic
                                   costs. Policy-makers need to make decisions about COVID-19 control strategies, considering their epide-
                                   miological, social, and economic effects.
                                   Epidemiological evidence is one of several criteria for decision-making regarding non-pharmaceutical in-
                                   terventions. For example, a policy-maker would want to understand if costs of foregone economic activ-
                                   ity are proportional to the population under lockdown or whether per-person costs are mitigated or am-
                                   plified when lockdowns are implemented at different administrative levels (eg, municipality, city, state,
                                   country). On the one hand, demand spill overs would suggest that people in a municipality could buy in
                                   stores of the neighbouring municipality and, through substitution, limit the economic fallout in the city
                                   as a whole. On the other hand, the fall in economic activity could be more than proportional if a lock-
                                   down affects supply chains, such as when workers cannot work in a neighbouring municipality because
                                   of mobility restrictions in their municipality of residence. The answer to this question is mostly empirical,
                                   as there are good arguments to both sides. However, there is limited and non-conclusive evidence on the
                                   economic costs of non-pharmaceutical interventions. Researchers in the United States have examined how
                                   non-pharmaceutical interventions have impacted unemployment insurance, employment, or store client
                                   traffic [28,30,36-40]. Some research suggests that lockdowns explain a small share of the total economic
                                   activity decline [28,36-38]. Others [30,39,40] have found that lockdowns play a relevant role in explain-
                                   ing the drop in economic activity. We test these effects in a setting where localized lockdowns were im-
                                   plemented intermittently at different administrative levels, thus allowing us to identify the impact of lo-
                                   calized lockdowns on economic activity.
                                   The World Health Organization declared South America as the new epicentre of COVID-19 on May 22,
                                   2020 [41]. Despite implementing several epidemic control strategies early in the pandemic, including travel
                                   restrictions, school closures, and mandatory lockdowns, the pandemic has imposed a massive toll on the
                                   region. As of December 13, South America has reported more than 360 thousand deaths [42]. Adjusted by
                                   population, Argentina, Colombia, Chile, Brazil, and Peru are among the countries with the most reported
                                   COVID-19 infections and deaths globally. The epidemic is far from controlled [42-44]. While mostly fail-
                                   ing to stop viral spread [43,45], Latin America is now facing the social and economic costs of large-scale
                                   non-pharmaceutical interventions.
                                   Since the beginning of the epidemic, Chile has implemented localized lockdowns at the municipality level,
                                   the smallest administrative subdivision in the country, at various points in time (Figure 1). The govern-
                                   ment roughly defined the criteria for implementing localized lockdowns as a function of disease burden,
                                   growth in transmission, and health care capacity but did not define specific thresholds [46]. Epidemio-
                                   logical evidence suggests that localized lockdowns reduce epidemic growth [47], but their effectiveness is
                                   heavily affected by their duration, spill overs from neighbouring communities, and socioeconomic status
                                   of the population affected [48,49]. Localized lockdowns have helped contain the transmission of the virus
                                   in isolated areas. Still, they cannot control the epidemic in highly interdependent areas, such as munici-
                                   palities within a metropolitan area [21].
                                   Drawing on a rich integrated data set, including value-added tax (VAT) revenues, population data, and
                                   daily incidence of laboratory-confirmed COVID-19 cases, we use econometric methods to empirically es-
                                   timate the economic costs of these localized lockdowns in Chile. We hope these results will help inform
                                   policy implementation decisions in the context of the COVID-19 pandemic.

                    2021 • Vol. 11 • 05002                                      2                               www.jogh.org • doi: 10.7189/jogh.11.05002
Effect of COVID-19 on the economy
Figure 1
PANDEMIC
RESEARCH THEME 1:
VIEWPOINTS
COVID-19
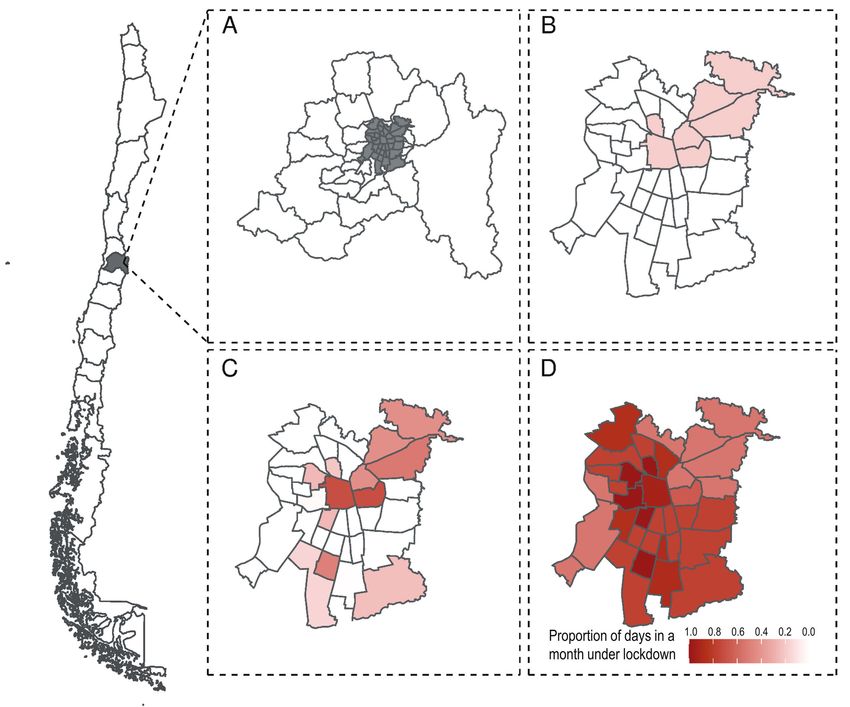
Figure 1. Illustration of localized lockdowns at the municipality level, Greater Santiago, Chile, March-May 2020. To con-
trol COVID-19 growth, the Ministry of Health implemented localized lockdowns at the country's municipality level,
the smallest administrative subdivision. The figure illustrates these lockdowns implemented in Greater Santiago (A in
grey) during different months: March (B), April (C), and May (D), where the colour scale represents the proportion of
days in a month under lockdown for each municipality.
METHODS
Data
Value-added tax (VAT) applies to all goods with a flat rate of 19% in Chile. VAT is collected and paid
monthly to the Chilean tax authority (Servicio de Impuestos Internos). Our data includes VAT at the mu-
nicipality level, by all firms registered in the Chilean tax authority, for 2018-2020. VAT collection has a
tight one-to-one relationship with GDP; it is, therefore, a good proxy for economic activity. Both variables
cointegrate in time series and panel analysis; error correction models suggest that half-life deviations van-
ish in less than a year [50].
We used Chile’s 2017 National Census [51] to estimate each municipality's population and epidemiologi-
cal surveillance records for COVID-19 from Chile’s Ministry of Health [46,52]. We obtained mobility data
from the Data Science Institute at Universidad del Desarrollo [53,54]. Mobility data correspond to Chile’s
largest telecommunications operator. Data on COVID-19, mobility, and population are publicly available
on institutional websites [51-53]. The data on VAT used for this study are available from the correspond-
ing author upon reasonable request and with permission of the Chilean tax authority.
Analysis
We used the collection of the VAT as our dependent variable. Our lockdown variable corresponds to the
proportion of days that a municipality i is in lockdown in a given month t:
Lockdowni,t = ∑ quarantine daysit/Total month’s dayst
www.jogh.org • doi: 10.7189/jogh.11.05002 3 2021 • Vol. 11 • 05002Asahi et al.
We limited our analysis to the 170 municipalities with above-median total VAT in 2018, excluding mostly
small and rural municipalities. This preferred sample of municipalities includes 97% of Chile’s 2018 VAT
and 89% of the population (Figure 2). Our sample also excluded the three municipalities that concentrate
COVID-19 PANDEMIC
RESEARCH THEME 1:
large-company headquarters (Santiago, Las Condes, and Providencia), such as banks and mining compa-
nies, because VAT data in these municipalities do not reflect local economic activity.
Figure 2
VIEWPOINTS
Figure 2. VAT and population cumulative distribution across all municipalities. Panel (a) shows the proportion of total
2018 VAT considered in our baseline sample. We sorted the 343 municipalities in our data set in ascending order by 2018
VAT. We calculated the accumulated tax from the one with the lowest to the highest VAT level. Municipalities not con-
sidered in our baseline sample account for 2.9% of the total 2018 VAT (darker area), while the remaining 97.1% (lighter
area) is in our preferred sample. Panel (b) shows the proportion of the total population, according to the 2017 Census
within our preferred sample. In this case, we sorted the municipalities in ascending order. We then calculated the total
population's accumulated percentage not considered in our sample, which is 10.9% (darker area). Hence, the remaining
89.1% (lighter area) is in our sample.
Our main empirical specification is a two-way fixed-effects model:
Δ%VATit = β + β1lockdownit + β2X it + γi + δt + εit
where ∆%VATit corresponds to the percent variation of total VAT collected in municipality i at month t in
2020 relative to the same month in 2019. lockdownit is our variable of interest and represents the propor-
tion of days in a month that a municipality was under lockdown. γi and δt correspond to municipality and
time fixed-effects, respectively. A distinctive feature of our setting is that lockdownit effectively changes by
municipality and month, providing a variation that allows for a plausible estimate of effects (Figure 1). We
controlled for threat or risk perception [55] and social distance by adding new monthly COVID-19 cases
or new monthly COVID-19 deaths in the municipality i at time t (variable X it) as covariates. For instance,
people may not open their businesses or spend in the local economy because they fear COVID-19 conta-
gion, independent of whether their municipality is under lockdown or not.
Similar to virus transmission spill overs, the economic effects of localized lockdowns within a city or in
a conurbation may differ from more relatively isolated municipalities with no neighbouring urban areas
(“standalone” municipalities). To examine whether the impact of lockdowns on economic activity is het-
erogeneous depending on whether municipalities belong to a conurbation or are a standalone municipal-
ity, we used the following regression specification:
Δ%VATit = β 0 + β1lockdownit + β2standalonei + β3standalonei × lockdownit + γi + δt + εit
where standalonei takes a value of one for standalone municipalities and zero otherwise.
The economic effects of localized lockdowns may differ depending on the area under lockdown – for exam-
ple, at the municipality or conurbation level. To examine this question, we also ran our analysis comparing
all municipalities within a conurbation with standalone municipalities. We weighted the number of days in
lockdown in month t of each municipality i belonging to the conurbation c according to the total 2018 VAT:
∑ i=1lockdown it * VATi
C
lockdownct =
Total Montht’ s days ∑ i=1VATi
C
2021 • Vol. 11 • 05002 4 www.jogh.org • doi: 10.7189/jogh.11.05002Effect of COVID-19 on the economy
We estimated deaths and COVID-19 cases as a weighted average of deaths in municipalities within the
conurbation, using the municipality’s population as the weight. Hence, the equation describing per capita
COVID deaths in each conurbation is as follows:
PANDEMIC
RESEARCH THEME 1:
C
∑ COVID deathsit
Per capita COVID deathsct = i=C1
∑i=1Population i
VIEWPOINTS
Last, we investigate how mobility at the municipality-level affects economic activity. We used a mobility
index based on cell phone data. The index was calculated from anonymized aggregate records of mobile
COVID-19
telephones in Santiago, which describe trips within and between municipalities. Data are not based on the
mobile phone's exact location but on the antenna to which the phones were connected. Each trip is defined
by the person’s mobile phone moving between antennas [53,54].
RESULTS
Descriptive statistics
Table 1 shows the main descriptive statistics of our sample. Figure 3 shows the longitudinal effects of
lockdown. As a benchmark, municipalities without a localized lockdown saw a 15% drop in VAT collec-
tion in April-May 2020 compared to the same months of 2019. By contrast, municipalities with lockdown
suffered a more substantial decline of 25%-30% in VAT collection, again measured vis-à-vis the previous
year. Figure 4 shows a cross-section, considering month and municipality fixed-effects. The figure shows
a clear relationship between the extent of lockdowns and the decline in VAT.
Table 1. Descriptive statistics related to localized lockdowns in Chilean municipalities, March-May 2020.
N Municipalities Mean SD
VAT log growth rate periods, compared to the same month in the previous year:
Before the outbreak: January-February 2020 340 170 0.083 0.423
During the pandemic: March-May 2020 510 170 -0.139 0.319
Lockdown (% of days):
March-May 2020 510 170 0.082 0.227
Conditional on one day at least 153 51 0.273 0.348
Mobility index (mobile phones):
Before COVID-19 (March 1-15) 170 170 8.03 3.24
During COVID-19 (March 16-May 31) 510 170 6.12 2.57
New COVID-19 deaths per million population:
March 2020 170 170 2.13 6.61
April 2020 170 170 20.32 27.90
May 2020 170 170 108.95 147.54
New COVID-19 incidence per million population:
March 2020 168 168 59.54 119.57
April 2020 170 170 633.38 729.48
May 2020 170 170 3160.5 4319.0
SD – standard deviation, VAT – value-added tax
*The VAT year-over-year growth rate is calculated as the difference in logarithms of VAT for each month and each municipality rela-
tive to 12 months before. As such, a number like 0.08 is approximately an 8% drop vis-à-vis the previous year. In the VAT growth rate
for “March-May 2020,” we include the growth rate for each month-municipality in that period. We consider that the disruption of the
COVID-19 pandemic on mobility occurred on March 16 because the government closed all schools on that date [46].
Multivariate analysis
Municipality level
Table 2 presents our baseline results for the effect of lockdowns on economic activity. Table 2, column (1)
shows that one month of lockdown decreases monthly VAT around 12.5% (β = -0.125; 95% confidence in-
terval (CI) = -0.220, -0.031; P = 0.009). The coefficient or the effect of lockdowns has about the same mag-
nitude when restricting the sample to municipalities with at least 50% of the urban population (Table 2,
column 2; β = -0.132; 95% CI = -0.228, -0.035; P = 0.008). Table 2, column (3) shows the results for mu-
nicipalities with less than 50% of rural population and excluding observations from Greater Santiago. To
www.jogh.org • doi: 10.7189/jogh.11.05002 5 2021 • Vol. 11 • 05002Asahi et al.
assess our estimates' robustness, we excluded municipali-
ties in Greater Santiago, the conurbation in Chile with the
highest proportion of municipalities in lockdown between
COVID-19 PANDEMIC
RESEARCH THEME 1:
March and May 2020. We found that VAT decreases 16 per-
centage points for each month of lockdown, but the coef-
ficient is only significant at the 90% level (β = -0.162; 95%
CI = -0.350, 0.0268; P = 0.093).
VIEWPOINTS
We then limited our sample to urban municipalities (n = 72)
that are part of a conurbation (Table 2, column 4). One
month of lockdown results in a monthly VAT decrease of
16 percentage points (β = -0.161; 95% CI = -0.287, -0.034;
P = 0.013). We found similar results when excluding Great-
er Santiago (Table 2, column 5; β = -0.153; 95% CI = -0.410,
0.103; P = 0.240).
Figure 3. Median of the real value-added-tax (VAT) year-on-year growth We added an interaction term to examine whether lock-
rates. The graphs show the median of VAT growth rates for munici- downs had a different effect on VAT in municipalities that
palities under lockdown in May 2020 (blue) and municipalities that are part of a conurbation or in standalone municipalities.
were not under lockdown (red). The median of the value-added-tax The results in Table 2, column (6) show a 23% decline
(VAT) growth rate in May 2020 for municipalities with and without in monthly VAT collection due to a one-month lockdown
lockdown is 2.67 and 5.37 standard deviations lower than the mean of (β = -0.230; 95% CI = -0.345, -0.115; P < 0.001). However, we
such medians in the 2006-2019 period. The sample of municipalities
includes municipalities over the 50th percentile of the total 2018 VAT.
did not find evidence of a differential effect for standalone
municipalities relative to municipalities in conurbations.
Last, we examined whether perceived threat or risk from
new COVID-19 deaths or new cases could be an omitted
variable bias in the effect of local lockdowns on econom-
ic activity. Table 2, Column (7) includes the municipality’s
one-month per-capita COVID deaths per 100 000 popula-
tion as control. The lockdown effect is roughly the same as
in column 1 (β = -0.125; 95% CI = -0.265, 0.013; P = 0.077).
Controlling for COVID-19 monthly incidence per 100 000
population Table 2, Column (8) shows that one month of
lockdown results in a thirteen percent decrease in VAT
collection (β = -0.135; 95% CI = -0.237, -0.033; P = 0.010).
Results are robust to using one-month lagged COVID-19
deaths and cases.
Overall, Table 2 suggests that one month of lockdown
would reduce economic activity by 10%-15%, robust to
Figure 4. Effect of lockdown on value-added-tax (VAT) collection for several model specifications. Notably, the effect size is not
January 2020 through May 2020, controlling for month and mu- affected when controlling for COVID-19 deaths or case in-
nicipality fixed effects. The results show the association between cidence, suggesting that this sample's lockdown effect goes
lockdown on VAT collection for January 2020 through May 2020, over and above the impact of perceived threat or risk of
controlling for month and municipality fixed effects. We group the contagion.
municipalities of our baseline sample into equal-sized bins accord-
ing to days of lockdown between January 2020 and May 2020. Each
Conurbations and standalone municipalities
dot represents the mean VAT collection growth rate (y-axis) and the
mean deviation from lockdown as a percentage of a month (x-axis) Next, we examined the effects of lockdowns on VAT when
within each bin. Each bin has 17 municipalities. The red dashed line
analysed for conurbations or standalone municipalities (Ta-
represents the population regression line. ble 3). The objective was to test whether the effects of lock-
downs were different when there were no spill overs from
closely interdependent neighbouring areas. For the analysis, we collapsed municipalities into conurbations.
Our sample now had eighteen conurbations and seventeen standalone municipalities in our baseline sample.
Table 3, column (1), shows a statistically significant decline in monthly VAT collection of around 18%
(β = -0.184; 95% CI = -0.360, -0.009; P = 0.042). Because Greater Santiago had the largest number of munic-
ipalities with lockdown, we dropped Greater Santiago from the sample to test our results (Table 3, column
2). The effect's magnitude remained but was significant only at the 90% level (β = -0.188; 95% CI = -0.382,
0.051; P = 0.056). In Table 3, column 3, we examined whether there was a differential effect for standalone
2021 • Vol. 11 • 05002 6 www.jogh.org • doi: 10.7189/jogh.11.05002Effect of COVID-19 on the economy
Table 2. Regressions results for the effect of one month localized lockdown on total VAT collection, estimated with two-way fixed effects
at the municipality level, January-May 2020
Dependent variable: VAT Baseline Excluding Excluding Conurbations Conurbations As in (1) As in (1)
Greater Conurbations excluding Greater and standalone controlling controlling
PANDEMIC
growth rural units Santiago
RESEARCH THEME 1:
Santiago municipalities for deaths for cases
(1) (2) (3) (4) (5) (6) (7) (8)
Lockdown -0.125§ -0.132§ -0.162† -0.161‡ -0.153 -0.230§ -0.125† -0.135§
(0.048) (0.049) (0.096) (0.064) (0.130) (0.059) (0.071) (0.052)
VIEWPOINTS
Standalone × lockdown -0.059
(0.104)
COVID-19
Standalone -0.005
(0.038)
New deaths per 100 000 0.00004
(0.002)
New log cases per 100 000 0.002
(0.005)
Observations 850 785 570 360 195 455 850 850
Adjusted R 2 0.352 0.369 0.356 0.352 0.278 0.171 0.351 0.351
Time effect YES YES YES YES YES YES YES YES
Municipalities 170 157 114 72 39 91 170 170
VAT – value-added tax
*All specifications have both geography and time fixed effects. Robust standard errors in parenthesis. Column (1) shows regression results for the base-
line sample (ie, municipalities over the 50th percentile of total 2018 VAT). Column (2) excludes units, with over fifty percent of the rural population. Col-
umn (3) is the same as (2) but excluding municipalities in Greater Santiago, the capital. Columns (4) includes only municipalities that are part of a large
conurbation. Column (5) is the same as column (4), excluding municipalities in Greater Santiago. Column (6) includes municipalities that are part of
large conurbations and standalone municipalities (Angol, Antofagasta, Arica, Aysén, Calama, Castro, Chañaral, Colina, Copiapó, Curicó, Osorno, Ovalle,
Puerto Montt, Puerto Natales, Punta Arenas, Valdivia, and Vallenar). Columns (7) and (8) consider the baseline sample and controls for contemporaneous
COVID-19 new deaths and lagged incidence per 100 000 population, respectively, at the municipality level.
†P < 0.10.
‡P < 0.05.
§P < 0.01.
Table 3. Regressions results for the effect of one month localized lockdown on total VAT collection, estimated with two-way fixed effects
for conurbations and standalone municipalities, January-May 2020
All Conurbations and Excluding Greater As in (1) interacting As in (1) with per As in (1) with log
Dependent variable: VAT growth standalone municipalities Santiago lockdown & standalone capita deaths per capita incidence
(1) (2) (3) (4) (5)
Lockdown -0.184‡ -0.188† -0.243§ -0.126 -0.157
(0.089) (0.020) (0.064) (0.106) (0.116)
Standalone -0.00294
(0.044)
Standalone × lockdown -0.042
(0.105)
New deaths per 100 000 -0.007
(0.006)
New log cases per 100 000 -0.014
(0.027)
Observations 175 170 175 175 175
Adjusted R 2 0.325 0.322 0.101 0.326 0.323
Units 35 35 35 35 35
Conurbations 18 18 18 18 18
Standalone municipalities 17 17 17 17 17
VAT – value-added tax
*All specifications have both geography (conurbation, standalone municipalities) and time fixed-effects. Robust standard errors in parenthesis. Localized
lockdowns at the conurbation level are aggregated and weighted by total 2018 VAT. COVID-19 deaths and cases are calculated at the conurbation level.
†P < 0.10.
‡P < 0.05.
§P < 0.01.
municipalities. The results show that one month of lockdown results in a significant decrease of 24% of
VAT collection (β = -0.243; 95% CI = -0.370, -0.117; P < 0.001). We did not find evidence for a differential
effect in standalone municipalities. However, the coefficient in Table 3, column 3, was not statistically dif-
ferent from the coefficient in Table 3, columns (1) and (2).
www.jogh.org • doi: 10.7189/jogh.11.05002 7 2021 • Vol. 11 • 05002Asahi et al.
Last, we examined whether the lockdown effect was different from the perceived threat or risk from
COVID-19. In Table 3, columns (4) and (5) show lockdowns were no longer statistically significant at con-
ventional levels (P = 0.240 and P = 0.175, respectively). However, the coefficient’s sign was still negative and
COVID-19 PANDEMIC
RESEARCH THEME 1:
about the same magnitude as the coefficient in Table 3, columns (7) and (8). The joint significance test
for the proportion of the month under lockdown and lagged per capita COVID-19 deaths and incidence
was significant (F = 3.84, P < 0.05; F = 2.81, P = 0.064, respectively). Thus, working with data at the conur-
bation-level instead of the municipality-level makes it harder to disentangle the effect of lockdowns. This
VIEWPOINTS
difficulty is partly explained by insufficient statistical power and by limited variation in the lockdown
variable. The last columns of Table 3 reinforce the advantage of our baseline setting at the municipal lev-
el, with more sizable variation in the lockdown (key) variable.
Table S1 in the Online Supplementary Document also shows that our baseline results are robust to con-
trolling for a measure of cell phone-based mobility. However, we also argue that it might be misleading to
control for mobility since it is one of the main mediating channels by which lockdown affects economic
activity (see Appendix S1 in the Online Supplementary Document for further discussion).
DISCUSSION
Our results suggest that a full-month lockdown explains a drop in activity of the order of 10-15 percentage
points, almost twice the reduction for non-locked down areas. While the expected sign of the effect of lock-
downs on economic activity might be obvious, its magnitude is not.
These estimates are large. Our estimates suggest that a three-to-four-month lockdown would reduce econom-
ic activity by approximately the same amount that the recession affected the Chilean economy in the (whole)
year 2009. During the 2009 Great Recession, GDP declined by 1.1% instead of growing by 3.7% [56]. These
three to four months only consider the additional effect of lockdowns. If one considered the whole drop in
economic activity, the magnitude would be twice as much (in two months under lockdown in 2020, the GDP
decline is comparable to the annual decrease in 2009).
Another way of thinking quantitatively about the magnitude and implications of our baseline estimate is in
terms of employment. Assuming a standard short-run labour-to-economic activity elasticity of around 0.3-
0.5, as suggested by an OECD study [40], a one-month lockdown would imply a drop of about 6% in month-
ly employment. We estimate this illustrative 6% fall in monthly employment by multiplying the coefficient
of -0.15 in Table 2 by an average short-run labour-to-economic activity elasticity of 0.4.
It is also useful to contrast our results with the polar case of South Korea, without lockdowns. Aum et al.
found that a one-per-thousand increase in the infection rate was associated with an employment loss of 2
to 3 percent. Extrapolating this result to the United States and the United Kingdom, which had large-scale
lockdowns, Aum et al. [30] argue that only half of the 5 to 6 percent drop in job losses in these Western
economies might be attributable to lockdowns. The rest would be from social panic, some other large-scale
non-pharmaceutical intervention, such as school closures, or demand effects. This similar effect of areas with
and without lockdown seems consistent with our findings. Importantly, we obtained our results from a direct
test in the same sample, instead of extrapolating across countries. The relatively large effect of lockdowns has
not yet been found empirically in the United States. For instance, Bartik et al. found that the relative impact
of lockdowns was smaller, explaining 1/6 of the total fall during the COVID-19 pandemic. Our results show
that lockdowns explain half of the effect, both in the raw time series (Figure 3) and in the main regressions
(Table 2). Thus, we offer a qualification to Brzezinksi et al. [57], who found that not imposing lockdowns
barely improves economic performance while drastically increasing medical costs. This baseline drop prob-
ably includes threat or risk perception and includes other economic channels, like lower spending [31].
Epidemiological evidence suggests that localized lockdowns reduce epidemic growth [47], but their effective-
ness is affected by spill overs from neighbouring areas where there is economic interdependence, such as in
a city [21]. From an epidemiological standpoint, governments may desire to implement localized lockdowns
at the city-level, where “buffer” zones exist to minimize transmission networks [34]. We examined localized
lockdowns at different scales to understand their relative economic costs, understanding that this is only one
portion of the relevant cost-benefit calculation. Our findings suggest no disproportionate economic gains from
unlocking a part of the city. Our estimated effects of lockdowns on the economy are unchanged by scale. The
plausible channels that mitigate or amplify the economic impact in the case of a widespread vis-à-vis a local
lockdown do not seem critical, at least in our study setting, suggesting the convenience of implementing lo-
calized lockdowns at the city or commuting area levels, if epidemiologically appropriate.
2021 • Vol. 11 • 05002 8 www.jogh.org • doi: 10.7189/jogh.11.05002Effect of COVID-19 on the economy
Economic problems could also feedback into health through several channels. For instance, a drop in eco-
nomic activity of 10-15 percentage points is relevant because lockdowns can affect government budgets, even
in the long term. For example, Frenier et al. [58] argue that several states in the USA will probably face severe
PANDEMIC
RESEARCH THEME 1:
budget deficits from tax revenue reductions from the pandemic. Further, an economic downturn may prompt
many deaths of despair and mental illness from unemployment and isolation [59].
Our estimates have limitations. First, we used a tax payment as a proxy for economic activity. Nonetheless, we
also have VAT and survey-based employment at the regional level in Chile. We found a statistically significant
VIEWPOINTS
elasticity of 0.3 between the drop in VAT and the decline in total employment (including self-employed), consis-
COVID-19
tent with short-run output-employment elasticities in the literature (34). Another limitation is that informal eco-
nomic activity is, by its very nature, not directly captured in our measures of VAT. However, compared to Latin
America (53%), Chile has relatively low levels of informality (30%) [60], which have declined in the past decade
[61]. Still, many households depend on daily wages from informal employment, which has critically affected
their capacity to comply with some non-pharmaceutical interventions such as localized lockdowns [48,49]. The
World Bank has recently underscored the pandemic's adverse effects on informal employment and businesses,
which are harder to reach through policy instruments such as subsidies or payment deferrals [27]. We lack data
on informal activity during the pandemic. However, we have some indirect evidence of the pandemic's large eco-
nomic effects on informal activity through data from informal settlements in Chile. A nationally representative
panel survey of informal settlements showed that about 75% of individuals had lost more than half their income
since the pandemic began [62], a substantially larger decline in income compared to the general population.
These data suggest that our estimates of the effects of COVID-19 on the Chilean economy may be conservative.
Our study may also have other confounders. For instance, the government gave some leeway on when to pay
taxes, and we could only examine monthly-level observations. Nevertheless, there are no apparent reasons
why these confounders may interact with lockdowns. These confounders may have also introduced measure-
ment error in our tax measures. This measurement error would have increased our standard errors, making it
more difficult to get statistical significance. Nevertheless, we did get relevant and robust estimates across var-
ious specifications, which mitigates these concerns.
CONCLUSIONS
We used a rich data set of localized lockdowns in Chile to measure their effect on economic activity. We find
sizeable impacts of lockdowns, doubling the drop in economic activity compared to non-treated municipali-
ties, and robust to several model specifications and controls. As many countries are beginning to reopen and
ease mobility restrictions, localized lockdowns can be a critical tool to control COVID-19 resurgence while
minimizing economic impact. We found no evidence that localized lockdowns generate a proportionally larg-
er or smaller effect in the economy when applied to areas of different sizes. Critically, our results suggest that
epidemiological criteria should guide decisions about the optimal size of lockdown areas since the propor-
tional effects of lockdowns on the economy seem to be unchanged by the geographic scale of the restrictions.
Acknowledgments: We thank Sebastian Piña (Universidad de Chile) for excellent research assistance, Paula Aguirre (Pon-
tificia Universidad Católica de Chile) for help with Figure 1, and the Servicio de Impuestos Internos (Chilean Tax Au-
thority) for the local Value-added-tax data. Our research uses public administrative data collected by the Chilean govern-
ment. Data were aggregated at the municipality level, and subjects cannot be identified directly or through identifiers. It
is considered exempt by the Comite Ético Científico of Pontificia Universidad Católica de Chile. The data on VAT used for
this study is available from the corresponding author upon reasonable request and with permission of the tax authority.
Funding information: This research was supported by the Agencia Nacional de Investigación y Desarrollo (ANID) Project
ANID-COVID-0377 to KA and RW; ANID Millennium Science Initiative Program MICROB-R [NCN17_081] and MLIV
[NCS17_062] to EU; Fondo Nacional de Desarrollo Científico y Tecnológico (FONDECYT) [Grant 11191206] to RW;
Centre for Sustainable Urban Development (CEDEUS), ANID Fondo de Financiamiento de Centros de Investigación en
Áreas Prioritarias (FONDAP) [Grant 15110020] to KA; and Research Center for Integrated Disaster Risk Management
(CIGIDEN), ANID FONDAP [Grant 15110017] to RV and EU.
Authorship contributions: KA, EU, RV and RW contributed to the design and implementation of the research, to the
analysis of the results and to the writing of the manuscript.
Competing interests: The authors completed the Unified Competing Interest form at www.icmje.org/coi_disclosure.pdf
(available upon request from the corresponding author), and declare no conflicts of interest.
Additional material
Online Supplementary Document
www.jogh.org • doi: 10.7189/jogh.11.05002 9 2021 • Vol. 11 • 05002Asahi et al.
1 Ledford H, Cyranoski D, Noorden RV. The UK has approved a COVID vaccine – here’s what scientists now want to know.
Nature. 2020;588:205-6. Medline:33288887 doi:10.1038/d41586-020-03441-8
REFERENCES
2 Tanne JH. Covid-19: FDA panel votes to authorise Pfizer BioNTech vaccine. BMJ. 2020;371:m4799. Medline:33310748
doi:10.1136/bmj.m4799
COVID-19 PANDEMIC
RESEARCH THEME 1:
3 Hsiang S, Allen D, Annan-Phan S, Bell K, Bolliger I, Chong T, et al. The effect of large-scale anti-contagion policies on the
COVID-19 pandemic. Nature. 2020;584:262-7. Medline:32512578 doi:10.1038/s41586-020-2404-8
4 Walker PGT, Whittaker C, Watson OJ, Baguelin M, Winskill P, Hamlet A, et al. The impact of COVID-19 and strategies for
mitigation and suppression in low- and middle-income countries. Science. 2020;369:413-22. Medline:32532802
VIEWPOINTS
5 Wiersinga WJ, Rhodes A, Cheng AC, Peacock SJ, Prescott HC. Pathophysiology, Transmission, Diagnosis, and Treat-
ment of Coronavirus Disease 2019 (COVID-19): A Review. JAMA. 2020;324:782-93. Medline:32648899 doi:10.1001/
jama.2020.12839
6 Li Y, Campbell H, Kulkarni D, Harpur A, Nundy M, Wang X, et al. The temporal association of introducing and lifting
non-pharmaceutical interventions with the time-varying reproduction number (R) of SARS-CoV-2: a modelling study across
131 countries. Lancet Infect Dis. 2020. Online ahead of print. doi:10.1016/S1473-3099(20)30785-4
7 Flaxman S, Mishra S, Gandy A, Unwin HJT, Mellan TA, Coupland H, et al. Estimating the effects of non-pharmaceutical
interventions on COVID-19 in Europe. Nature. 2020;584:257-61. Medline:32512579 doi:10.1038/s41586-020-2405-7
8D avies NG, Kucharski AJ, Eggo RM, Gimma A, Edmunds WJ, Jombart T, et al. Effects of non-pharmaceutical interventions on
COVID-19 cases, deaths, and demand for hospital services in the UK: a modelling study. Lancet Public Health. 2020;5:e375-
85. Medline:32502389 doi:10.1016/S2468-2667(20)30133-X
9L avezzo E, Franchin E, Ciavarella C, Cuomo-Dannenburg G, Barzon L, Del Vecchio C, et al. Suppression of a SARS-CoV-2
outbreak in the Italian municipality of Vo’. Nature. 2020;584:425-9. Medline:32604404 doi:10.1038/s41586-020-2488-1
10 Hao X, Cheng S, Wu D, Wu T, Lin X, Wang C. Reconstruction of the full transmission dynamics of COVID-19 in Wuhan.
Nature. 2020;584:420-4. Medline:32674112 doi:10.1038/s41586-020-2554-8
11 C ousins S. New Zealand eliminates COVID-19. Lancet. 2020;395:1474. Medline:32386582 doi:10.1016/S0140-
6736(20)31097-7
12 Cowling BJ, Ali ST, Ng TWY, Tsang TK, Li JCM, Fong MW, et al. Impact assessment of non-pharmaceutical interventions
against coronavirus disease 2019 and influenza in Hong Kong: an observational study. Lancet Public Health. 2020;5:e279-
88. Medline:32311320 doi:10.1016/S2468-2667(20)30090-6
13 Pan A, Liu L, Wang C, Guo H, Hao X, Wang Q, et al. Association of Public Health Interventions With the Epidemiology of
the COVID-19 Outbreak in Wuhan, China. JAMA. 2020;323:1915-23. Medline:32275295 doi:10.1001/jama.2020.6130
14 Lai S, Ruktanonchai N, Zhou L, Prosper O, Luo W, Floyd J, et al. Effect of non-pharmaceutical interventions to contain
COVID-19 in China. Nature. 2020;585:410-3. Medline:32365354 doi:10.1038/s41586-020-2293-x
15 Rudan I. Answering 20 more questions on COVID-19 (March-April 2020). J Glob Health. 2020;10:020102. Medline:33110501
doi:10.7189/jogh.10.020102
16 S himizu K, Wharton G, Sakamoto H, Mossialos E. Resurgence of covid-19 in Japan. BMJ. 2020;370:m3221. Medline:32816821
doi:10.1136/bmj.m3221
17 Ruktanonchai NW, Floyd J, Lai S, Ruktanonchai CW, Sadilek A, Rente-Lourenco P, et al. Assessing the impact of coordinat-
ed COVID-19 exit strategies across Europe. Science. 2020;369:1465-70. Medline:32680881 doi:10.1126/science.abc5096
18 Wise J. Covid-19: Risk of second wave is very real, say researchers. BMJ. 2020;369:m2294. Medline:32518177 doi:10.1136/
bmj.m2294
19 IHME COVID-19 Forecasting Team. Modeling COVID-19 scenarios for the United States. Nat Med. 2020. Online ahead of
print.
20 Kissler SM, Tedijanto C, Goldstein E, Grad YH, Lipsitch M. Projecting the transmission dynamics of SARS-CoV-2 through
the postpandemic period. Science. 2020;368:860-8. Medline:32291278 doi:10.1126/science.abb5793
21 Li Y, Undurraga EA, Zubizarreta JR. Effectiveness of Localized Lockdowns in the SARS-CoV-2 Pandemic. medRxiv.
2020:2020.08.25.20182071.
22 Shea K, Runge MC, Pannell D, Probert WJM, Li S-L, Tildesley M, et al. Harnessing multiple models for outbreak manage-
ment. Science. 2020;368:577-9. Medline:32381703 doi:10.1126/science.abb9934
23 Karatayev VA, Anand M, Bauch CT. Local lockdowns outperform global lockdown on the far side of the COVID-19 epidemic
curve. Proc Natl Acad Sci U S A. 2020;117:24575-80. Medline:32887803 doi:10.1073/pnas.2014385117
24 Britton T, Ball F, Trapman P. A mathematical model reveals the influence of population heterogeneity on herd immunity to
SARS-CoV-2. Science. 2020;369:846. Medline:32576668 doi:10.1126/science.abc6810
25 Firth JA, Hellewell J, Klepac P, Kissler S, Kucharski AJ, Spurgin LG. Using a real-world network to model localized COVID-19
control strategies. Nat Med. 2020;26:1616-22. Medline:32770169 doi:10.1038/s41591-020-1036-8
26 Rainisch G, Undurraga EA, Chowell G. A dynamic modeling tool for estimating healthcare demand from the COVID19 ep-
idemic and evaluating population-wide interventions. Int J Infect Dis. 2020;96:376-83. Medline:32425631 doi:10.1016/j.
ijid.2020.05.043
27 World Bank. The Economy in the Time of CoVID-19. 2020. Available: https://bit.ly/35B2r3y. Accessed: 21 April 2020.
28 Baek C, McCrory PB, Messer T, Mui P. Unemployment effects of stay-at-home orders: Evidence from high frequency claims
data. The Review of Economics and Statistics. 2020. doi:10.1162/rest_a_00996
29 Lozano-Rojas F, Jiang X, Montenovo L, Simon KI, Weinberg BA, Wing C. Is the cure worse than the problem itself? im-
mediate labor market effects of covid-19 case rates and school closures in the US. National Bureau of Economic Research.
2020;WP27172:1-17.
2021 • Vol. 11 • 05002 10 www.jogh.org • doi: 10.7189/jogh.11.05002Effect of COVID-19 on the economy
30 A um S, Lee SYT, Shin Y. COVID-19 Doesn’t Need Lockdowns to Destroy Jobs: The Effect of Local Outbreaks in Korea. Na-
tional Bureau of Economic Research. 2020:w27264:1-19.
REFERENCES 31 Gupta S, Montenovo L, Nguyen TD, Rojas FL, Schmutte IM, Simon KI, et al. Effects of social distancing policy on labor mar-
ket outcomes. National Bureau of Economic Research. 2020:WP27280:1-49.
PANDEMIC
RESEARCH THEME 1:
32 Pfefferbaum B, North CS. Mental Health and the Covid-19 Pandemic. N Engl J Med. 2020;383:510-2. Medline:32283003
doi:10.1056/NEJMp2008017
33 d e Girolamo G, Cerveri G, Clerici M, Monzani E, Spinogatti F, Starace F, et al. Mental Health in the Coronavirus Disease 2019
Emergency—The Italian Response. JAMA Psychiatry. 2020;77:974-6. Medline:32352480 doi:10.1001/jamapsychiatry.2020.1276
VIEWPOINTS
34 Chowdhury R, Luhar S, Khan N, Choudhury SR, Matin I, Franco OH. Long-term strategies to control COVID-19 in low and
COVID-19
middle-income countries: an options overview of community-based, non-pharmacological interventions. Eur J Epidemiol.
2020;35:743-8. Medline:32656618 doi:10.1007/s10654-020-00660-1
35 Mahase E. Covid-19: How does local lockdown work, and is it effective? BMJ. 2020;370:m2679. Medline:32620558
doi:10.1136/bmj.m2679
36 Bartik AW, Bertrand M, Lin F, Rothstein J, Unrath M. Measuring the labor market at the onset of the COVID-19 crisis. National
Bureau of Economic Research, 2020;WP27613:1-53.
37 Forsythe E, Kahn LB, Lange F, Wiczer D. Labor Demand in the time of COVID-19: Evidence from vacancy postings and UI
claims. J Public Econ. 2020;189:104238. Medline:32834178 doi:10.1016/j.jpubeco.2020.104238
38 Goolsbee A, Syverson C. Fear, lockdown, and diversion: Comparing drivers of pandemic economic decline 2020. National
Bureau of Economic Research, 2020;WP27432:1-25.
39 Coibion O, Gorodnichenko Y, Weber M. The cost of the covid-19 crisis: Lockdowns, macroeconomic expectations, and con-
sumer spending. National Bureau of Economic Research, 2020;WP27141:1-51.
40 Görg H, Hornok C, Montagna C, Onwordi G. Employment to output elasticities & reforms towards flexicurity: Evidence from
OECD countries. IZA Discussion Paper. 2018;IZADP12004:1-38.
41 Taylor L. How South America became the new centre of the coronavirus pandemic. New Sci. 2020.
42 Dong E, Du H, Gardner L. An interactive web-based dashboard to track COVID-19 in real time. Lancet Infect Dis. 2020;20:534-
4. Medline:32087114 doi:10.1016/S1473-3099(20)30120-1
43 de Souza WM, Buss LF, Candido DS, Carrera J-P, Li S, Zarebski AE, et al. Epidemiological and clinical characteristics of the
COVID-19 epidemic in Brazil. Nat Hum Behav. 2020;4:856-65. Medline:32737472 doi:10.1038/s41562-020-0928-4
44 Moreira RM, Montoya ACV, Araujo SLS, Trindade RA, da Cunha Oliveira D, de Oliveira Marinho G. How prepared is Brazil to
tackle the COVID-19 disease? J Glob Health. 2020;10:020321. Medline:33110523 doi:10.7189/jogh.10.020321
45 Taylor L. How Latin America is fighting covid-19, for better and worse. BMJ. 2020;370:m3319. Medline:32873574 doi:10.1136/
bmj.m3319
46 Ministerio de Salud. Plan de acción por coronavirus. 2020. Available: https://www.gob.cl/coronavirus/plandeaccion/. Accessed:
10 October 2020.
47 Cuadrado C, Monsalves MJ, Gajardo J, Bertoglia MP, Najera M, Alfaro T, et al. Impact of small-area lockdowns for the control
of the COVID-19 pandemic. medRxiv. 2020:2020.05.05.20092106. doi:10.1101/2020.05.05.20092106
48 Bennett M. All things equal? Heterogeneity in policy effectiveness against COVID-19 spread in chile. World Dev. 2021;137:105208.
Medline:32994662 doi:10.1016/j.worlddev.2020.105208
49 Gil M, Undurraga EA. COVID-19 has exposed how ‘the other half’ (still) lives. Bull Lat Am Res. 2020;39:28-34. doi:10.1111/blar.13175
50 Aguirre P, Asahi K, Díaz-Rioseco D, Riveros I, Valdés R. Medium-run Local Economic Effects of a Major Earthquake. Unpub-
lished Manuscript, Pontificia Universidad Católica de Chile. 2020.
51 Instituto Nacional de Estadísticas. Estimaciones y proyecciones de la población de Chile 1992-2050. 2017. Available: https://
www.censo2017.cl/. Accessed: 2 April 2020.
52 Ministerio de Salud. Cifras Oficiales COVID-19. 2020. Available: https://www.gob.cl/coronavirus/cifrasoficiales/. Accessed: 30
October 2020.
53 Ministerio de Ciencia T. Conocimiento, e Innovación, Base de datos CoVID-19. 2020. Available: http://www.minciencia.gob.
cl/covid19. Accessed: 29 September 2020.
54 Bravo L, Ferres L. The IM (Mobility Index) dataset. Data Science Institute Universidad del Desarrollo. Santiago, Chile, 2020.
55 Bavel JJV, Baicker K, Boggio PS, Capraro V, Cichocka A, Cikara M, et al. Using social and behavioural science to support
COVID-19 pandemic response. Nat Hum Behav. 2020;4:460-71. Medline:32355299 doi:10.1038/s41562-020-0884-z
56 Banco Central de Chile. Cuentas Nacionales 2003-2009, Cuadro 1.3. 2010. Available: https://bit.ly/3obaYm9. Accessed: 1
September 2020.
57 Brzezinski A, Kecht V, Van Dijcke D. The Cost of Staying Open: Voluntary Social Distancing and Lockdowns in the US. Eco-
nomics Series Working Papers Oxford. 2020;910:1-39.
58 Frenier C, Nikpay SS, Golberstein E. COVID-19 Has Increased Medicaid Enrollment, But Short-Term Enrollment Changes
Are Unrelated To Job Losses. Health Aff (Millwood). 2020;39:1822-31. Medline:32757955 doi:10.1377/hlthaff.2020.00900
59 Case A, Deaton A. Deaths of Despair and the Future of Capitalism: Princeton University Press; 2020.
60 Levy-Yeyati E, Valdés R. COVID-19 in Latin America: How is it different than in advanced economies? In: Djankov S, Panizza
U, editors. COVID-19 in Developing Economies CEPR Press VoxEU.org eBook; 2020.
61 International Labour Organization. Recent experiences of formalization in Latin America and the Caribbean. 2014. Available:
https://bit.ly/2IJ2m6V. Accessed: 11 December 2020.
62 Gil D, Undurraga EA, Valenzuela E, Bowen S, Palacios P. Efectos socioeconómicos y percepción de riesgo del CoVID-19 en
campamentos y población vulnerable en Chile, mayo-septiembre 2020. 2020. Available: https://bit.ly/3b3aWsI. Accessed: 3
December 2020.
www.jogh.org • doi: 10.7189/jogh.11.05002 11 2021 • Vol. 11 • 05002You can also read