Human mobility in response to COVID 19 in France, Italy and UK
←
→
Page content transcription
If your browser does not render page correctly, please read the page content below
www.nature.com/scientificreports
OPEN Human mobility in response
to COVID‑19 in France, Italy and UK
Alessandro Galeazzi 1*, Matteo Cinelli2,3, Giovanni Bonaccorsi 4, Francesco Pierri 5
,
Ana Lucia Schmidt2, Antonio Scala3, Fabio Pammolli4,6 & Walter Quattrociocchi2
The COVID-19 pandemic is one of the defining events of our time. National Governments responded
to the global crisis by implementing mobility restrictions to slow down the spread of the virus. To
assess the impact of those policies on human mobility, we perform a massive comparative analysis
on geolocalized data from 13 M Facebook users in France, Italy, and the UK. We find that lockdown
generally affects national mobility efficiency and smallworldness—i.e., a substantial reduction of
long-range connections in favor of local paths. The impact, however, differs among nations according
to their mobility infrastructure. We find that mobility is more concentrated in France and UK and
more distributed in Italy. In this paper we provide a framework to quantify the substantial impact of
the mobility restrictions. We introduce a percolation model mimicking mobility network disruption
and find that node persistence in the percolation process is significantly correlated with the economic
and demographic characteristics of countries: areas showing higher resilience to mobility disruptions
are those where Value Added per Capita and Population Density are high. Our methods and findings
provide important insights to enhance preparedness for global critical events and to incorporate
resilience as a relevant dimension to estimate the socio-economic consequences of mobility restriction
policies.
The COVID-19 pandemic caused an unprecedented global health crisis with high fatality rates that stressed the
national health systems and the socio-economic structures of countries1–4. National Governments have responded
with non-pharmaceutical interventions (NPI) aimed at reducing the mobility of citizens to decrease the rate of
contagion5. In response to the threat, the research community has exerted impressive efforts to understand on
one side the epidemiological features of the outbreak6–9 and on the other side its economic consequences10–12. This
unprecedented scenario calls, indeed, for a better understanding of human mobility patterns during emergencies
as well as in the immediate post-disaster relief. The study of mobility habits is a foundational instance for several
issues ranging from traffic forecasting, up to virus spreading, and urban p lanning13–16. However, a quantitative
assessment of its statistical properties at different geographical scales remains elusive17–26. The availability of
rich datasets on the mobility of individuals, coupled with the urgency of the current situation, has fostered the
collaboration between tech giants, such as Facebook and Google, institutions, and s cholars8,27–30. Along this
path, the present work builds upon a collection of data from Facebook users and addresses the dynamics of
spatial redistribution of individuals as a response to mobility restrictions applied to limit the disease outbreak.
We perform a massive analysis of aggregated and de-identified data provided by Facebook through its Disease
Prevention movement maps31 to compare the effects of lockdown measures applied in France, Italy, and the UK
in response to the COVID-19 outbreak. The limitation to these three countries depends on the data available at
the time of the investigation. However, the overall dataset spans over 1 month of observations and accounts for
the daily movements of over 13 M people.
We model countries as networks of mobility flow and, similarly to32, we find that restrictions elicit geographi-
cal fragmentation through a transition toward local/short-range connections, thus causing a loss in the efficiency
of mobility.
Furthermore, to quantify the substantial effect of the lockdown we provide a model to simulate the effects
of movement restrictions and find that the responses to the shock observed in real mobility networks can be
fairly approximated through different network dismantling strategies. Indeed, the mobility restrictions caused
a general reduction of the overall efficiency in the mobility network and a geographical fragmentation with a
massive reduction of long-range connections. However, different countries experience changes depending upon
1
University of Brescia, Via Branze, 59, 25123 Brescia, Italy. 2Ca’Foscari University of Venice, via Torino 155,
30172 Venezia, Italy. 3Applico Lab-ISC CNR, Via dei Taurini 19, 00185 Rome, Italy. 4Impact, Department of
Management, Economics and Industrial Engineering, Politecnico di Milano, Milan, Italy. 5Department of
Electronics, Information and Bioengineering, Politecnico di Milano, Milan, Italy. 6CADS, Joint Center for Analysis,
Decisions and Society, Human Technopole and Politecnico di Milano, Milan, Italy. *email: a.galeazzi002@unibs.it
Scientific Reports | (2021) 11:13141 | https://doi.org/10.1038/s41598-021-92399-2 1
Vol.:(0123456789)www.nature.com/scientificreports/
their initial structure of inter-connections. The three countries exhibit differentiated mobility patterns that reflect
the structural diversity in their underlying infrastructure: more centralized around their capital cities in the
case of France and the UK, and more clustered in the case of Italy. Such infrastructural characteristics, together
with different responses to national lockdown, contributed to the emergence of varied configurations in terms
of residual mobility patterns. France shows one big cluster centered in Paris and many other smaller spots that
disconnect as soon as the segregation process starts. Italy exhibits four interconnected clusters, centered approxi-
mately along the high-speed rail lines in Naples, Rome, Milan, and Turin, that remain interconnected over time
thus showing a high persistence and resilience. Finally, the UK has one cluster centered in London, but most
of England exhibits a higher persistence with respect to France and Italy, thus suggesting the presence of more
capillary infrastructures. As a further step, we try to assess the impact of mobility restrictions by coupling our
modeling approach to some economic indicators. Indeed, the correlations among mobility, disease spreading, and
economic variables are crucial both in emergency scenarios and in ordinary times since the different resilience
of mobility networks could be both a predictor of the severity of future systemic crises and a guide to improve
the economic and social impact of policies. Hence the understanding of different resilience features in national
mobility networks is fundamental to craft and tailor specific release policies, and to smooth the economic impact
of NPIs. To obtain a first intuition of the reasons behind the different behaviors of the three countries in our
sample, we address the correlation among nodes’ persistence in the dismantling process and their economic and
demographic features. We find a positive and significant relation between node persistence and, on the one side,
production per capita (either measured by GDP per Capita or Value Added Per Capita) and on the other side
with population density. However, the two relations are stronger for Italy and France and have a weaker effect
in the UK, signaling that in this last case, as a consequence of the structural features of the capillary mobility
network, also less populated and wealthy areas of Great Britain are showing high resilience to mobility disruption.
Connectivity of national mobility networks
We represent national mobility networks of France, Italy, and the UK as weighted directed graphs, built upon
movement maps provided by Facebook through their “Data for Good” p rogram31 (see “Materials and methods”
for further details). Notice that the analysis is limited solely to Italy, UK, and France because, at the time of the
analysis, data comprising the lockdown dates were available only for these three countries.
In our framework nodes correspond to municipalities and edges are weighted according to the amount of
traffic between pairs of nodes. We first aggregate mobility flows in two symmetric disjoint time windows before
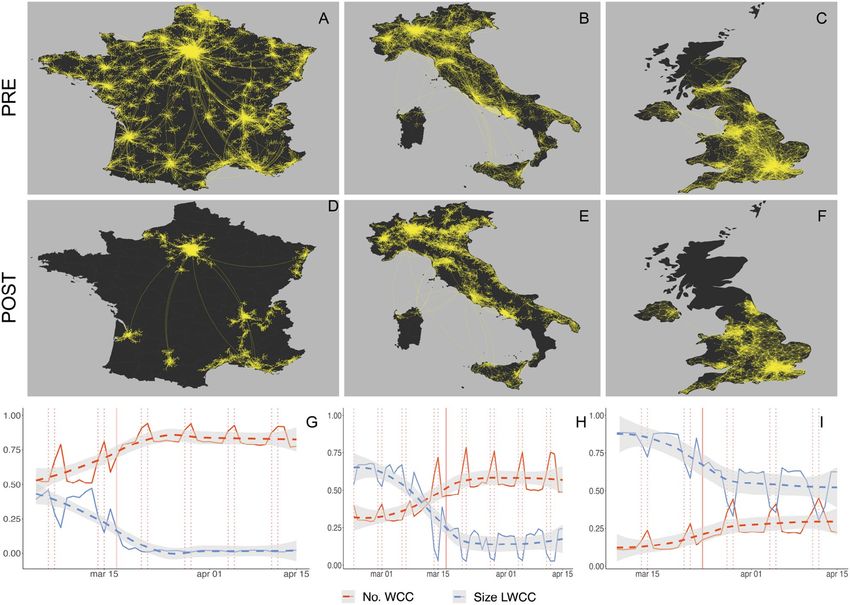
and after the day of national lockdown (see Materials and Methods), as shown in panels (A–F) of Fig. 1. By com-
paring mobility networks in the period before the intervention (panels A–C of Fig. 1) and during the lockdown
phase, we note a significant reduction of the overall connectivity. We find that mobility restrictions have a higher
impact on the connectivity of France, whereas they yield more limited effects in the other two countries. Italy
and UK, indeed, show respectively a reduction of 16% and 21% in the size of the largest weakly connected com-
ponent (LWCC, i.e., the maximal subgraph of a network in which any two vertices are interconnected through
an un-directed path), whereas France exhibits a reduction of almost 79%.
In panels G–I of Fig. 1, we further characterize daily connectivity patterns by computing the number of
weakly connected components (No. WCC) and the size of the LWCC of mobility networks constructed on a
daily basis. In all cases, we observe a decrease in the LWCC size and an increase in the number of WCCs. We
also observe periodic changes in correspondence with weekends, perhaps because of the reduced necessity to
commute during weekdays. In France (where the LWCC is Paris-centric), we notice a strong fragmentation of
the network since the beginning: the number of WCCs is larger than the size of the LWCC, suggesting that the
mobility is well distributed along with the whole country. However, Paris remains connected by long-range
connections to the remaining most active areas of Bordeaux, Toulouse, Marseille, and Lyon. In the case of Italy
(where the LWCC contains all the main Italian cities distributed on the high-speed rail line, i.e. Naples, Rome,
Milan, and Turin), the lockdown enhances the importance of local mobility. Notice that, while in the Center
and South of Italy mobility remains defined mainly at the regional level (in Fig. 1E one can distinguish Sicilia,
Campania, Lazio, and Toscana), the lockdown unveils that northern Italy is more interconnected, showing a
clustered mobility for the main industrial regions, i.e. Piedmont, Lombardy, Veneto, and Emilia-Romagna. The
UK is clearly London-centric: the size of the LWCC remains higher than the number of WCCs, with strong local
mobility patterns only in the Bristol and in Manchester-Liverpool areas. The number of WCCs and the size of
the LWCC reflect the different underlying structure of the three countries: France has a hub in Paris which is
star-connected via long-range links to the local city-centered areas, Italian national mobility is distributed mostly
over the center-northern region, and the UK appears as an extension of London, whose network of mobility
remains pervasive even after the lockdown.
Efficiency of national mobility networks
We further investigate the effect of lockdown focusing on the global e fficiency33 of mobility networks, as shown
in Fig. 2. The global efficiency is a measure that quantifies how optimal is the information flow in a network and
it can be used as a proxy to measure its s mallworldness33(further details are reported in “Materials and meth-
ods”). We notice a decreasing trend of the efficiency in the period before national lockdown and a steady-state
in the days after the intervention (Fig. 2), which is consistent with the observed decrease in global connectivity
(Fig. 1). Since the network efficiency is a measure that condensates information related to both clustering (i.e.
connectedness of neighbors) and small-world effect (i.e. presence of long-range connections that act as shortcuts),
the trends observed in top panels of Fig. 2 well describe the effect of an ongoing shock that cuts both long-range
connections and the overall cohesiveness. Moreover, the three countries experience different amounts of decen-
tralization as a consequence of the lockdown. To better quantify the differences, we measure the heterogeneity
Scientific Reports | (2021) 11:13141 | https://doi.org/10.1038/s41598-021-92399-2 2
Vol:.(1234567890)www.nature.com/scientificreports/
Figure 1. Outlook on national mobility networks for France, Italy and UK during COVID-19 pandemic.
Panels (A–F) show the largest weakly connected components (LWCC) of national mobility networks built on
two disjoint symmetric windows: respectively 2 weeks before (panels A–C) and 2 weeks after (D–F) the day of
national lockdown. The lockdown dates are respectively March 17th for France, March 9th for Italy and March
24th for UK. Bright dots represent municipalities that belong to the LWCC. We observe the following reductions
in terms of nodes that disappear from the main cluster. France: from 5495 to 1174 nodes. Italy: from 2733 to
2293 nodes. UK: from 1072 to 844 nodes. Panels (G–I) show the temporal evolution of daily connectivity for
national mobility networks of municipalities, in terms of number of weakly connected components (No. WCC)
and size of the largest weakly connected component (LWCC). Both quantities are normalized using the number
of nodes of the corresponding network. We visualize trends by means of a LOESS regression (dashed lines with
95% confidence intervals shaded in grey) and highlight lockdown and week-end days with vertical red lines,
respectively solid and dashed .
of nodes in terms of their contribution to global efficiency using the Gini i ndex34 (see “Materials and methods”).
We first observe that, in correspondence with the initial decrease of global efficiency, the Gini index displays
an increasing trend that becomes steady after the lockdown date (Fig. 2). The observed trend means that the
contribution of nodes to global efficiency becomes more and more heterogeneous over time until it reaches a
steady-state. This result indicates a progressive disruption with very heterogeneous effects on the single nodes,
suggesting that policies should be carefully tailored to avoid enhancing unequal treatments of different areas:
as an example, in Italy, it has been observed that the lockdown could enhance economic d isparities29 among
municipalities. Such an effect could be even more uttered in France, which shows a higher level of heterogeneity
in connectivity at municipal level with respect to Italy. Indeed, in the French context disconnected nodes are
more likely to remain isolated when compared to the Italian case, which exhibits a more distributed mobility
network. We observe a more nuanced response to the shock in the UK, where mobility is distributed more evenly
among distinct municipalities.
Resilience of national mobility networks
To quantify the substantial effect of the mobility restrictions applied in France, Italy, and the UK in this section,
we explore the drivers behind the empirical evidence reported in previous sections. We perform an analysis
based on percolation theory35 on the aggregated graph which corresponds to the period before the national
lockdown. We assume that this setting is a good proxy for the structure of the mobility network in “business as
usual” conditions (see “Materials and methods”). We implement bond percolation on the aggregated networks
by iteratively deleting edges following an increasing (respectively decreasing) weight order. During the process
Scientific Reports | (2021) 11:13141 | https://doi.org/10.1038/s41598-021-92399-2 3
Vol.:(0123456789)www.nature.com/scientificreports/
FR IT UK
1.0
Efficiency
0.5
0.0
1.0
Gini index
0.5
0.0
mar 01
mar 15
mar 01
mar 15
mar 01
mar 15
apr 01
apr 15
apr 01
apr 15
apr 01
apr 15
Figure 2. Evolution of global efficiency and of its heterogeneity. Top panels display the temporal evolution of
global efficiency (normalized by its maximum value during the period of observation), for the mobility network
of municipalities. We visualize trends using a LOESS regression (dashed lines with 95% confidence intervals
shaded in grey) and highlight lockdown dates using a solid vertical line. Bottom panels display the temporal
evolution of the Gini index of the nodal efficiency. The Gini index is used as a measure of heterogeneity and it is
computed considering the nodal contributions to global network efficiency. Overall, we observe an increase of
the Gini index indicating an increasing heterogeneity over time.
of network dismantling, we keep track of measures related to both cohesiveness and distance, namely the LWCC
size, global efficiency, and node persistence. In more detail, the node persistence measures the extent to which a
node remains connected to the LWCC, that is, how much the node is resilient to percolation. Notice that several
edge removal strategies can be considered to model different percolation processes and quantify different node
characteristics. We tried several removal strategies based on different edge features such as weight, geographi-
cal distance, and edge betweenness. We chose edge weight removal strategy since it turns out to be the one that
better approximates the real data (see “Materials and methods”).
The top row of Fig. 3 shows the results of the percolation process in terms of node persistence, carried out
by removing edges in increasing weight order for France, Italy, and the UK. To each node we assign an area
on the map calculated using Voronoi tessellation36 and colored according to node persistence (see “Materials
and methods”). The empirical evidence displayed in previous sections finds support in the percolation results.
Indeed, comparing the three cases, the differences in the network structure among countries emerge. While
France has one big cluster centered in Paris and many smaller modules that disconnect as soon as the process
occurs, Italy exhibits four interconnected clusters, centered approximately in Naples, Rome, Milan and Turin (that
roughly correspond to the high-speed rail lines), that remain interconnected and thus showing high persistence
levels. Conversely, UK has one cluster centered on London, but most of England exhibits a higher persistence
with respect to France and Italy, thus suggesting the presence of a more resilient network with a very capillary
structure.
To compare the effects of the percolation dynamics on each of the three countries, in the middle and bottom
rows of Fig. 3 we show trends for LWCC size and global efficiency throughout the process.
We first notice that the decay of the LWCC size differs depending both on the country and edge removal
strategy: removing edges sorted by decreasing weight affects less the decay of the LWCC size than removing edges
sorted by increasing weight, for all countries. However, we see differences in the decay of LWCC size among the
three nations in the increasing case: while France exhibits an almost linear trend, UK shows a significant drop
only after an important amount of connections is removed. Moreover, Italy seems to be in an intermediate situ-
ation, showing an almost linear but scattered decay. We observe that the largest connected component is quickly
disrupted when edges are deleted for increasing order of weights. Following results from network dismantling
theory37, transportation networks generally exhibit higher vulnerability to such weak link removal and are
more robust to the deletion of edges with higher weight. This effect can be explained by assuming a “rich club”
structure38, where links corresponding to higher mobility flows are concentrated around core regions. Indeed, the
largest fragility of the mobility network toward the deletion of weaker edges hints at a core-periphery structure.
The bottom row of Fig. 3 displays the normalized global efficiency as a function of the residual edge. Also in
this case, France has a smoother decay with respect to Italy and the UK, mainly when percolation is performed
on increasing order of weights. Furthermore, when removing the same percentage of residual edges by increasing
order of weights, UK yields the highest efficiency across countries. However, such a relationship changes when
the opposite percolation strategy is taken into account. In this case, the UK has a slightly steeper decay of global
efficiency, hinting the presence of a large number of strong connections among nodes. Again, we observe that
Scientific Reports | (2021) 11:13141 | https://doi.org/10.1038/s41598-021-92399-2 4
Vol:.(1234567890)www.nature.com/scientificreports/
Figure 3. Results of the percolation process in terms of node persistence and edge removal strategies. A
percolation process is performed by iterating a cutting procedure on edges according to their weights calculated
in the whole period before lockdown. Top row: node persistence during the percolation process. Node
persistence is defined as the number of iterations a node remains connected to the LWCC over the maximum
number of iterations before the network is completely disconnected; the more persistent the node, the brighter
the color. Notice that we are defining persistence upon deleting edges by their increasing strength: hence,
brighter nodes are not only the last to be disconnected, but are also those embedded in stronger mobility flows.
Middle row: size of the LWCC (largest weakly connected component) as a function of the number of residual
edges. Green and blue curves correspond to deleting edges respectively in decreasing and increasing order of
their weight. Bottom row: variation of global network efficiency obtained deleting edges by increasing (green)
or decreasing (blue) weight. In both middle and bottom rows, we plot the “empirical” values of LWCC and
global efficiency for the mobility networks calculated aggregating flows in the weeks before (dots), during (stars)
and after (cross) the lockdown date. Notice that, while lockdown cut out the peripheries of national networks
(middle panels, but see also panels (D–F) of Fig. 1), the reduced mobility severely affects also the network
efficiency (bottom panels).
core regions (the ones where strong links are more concentrated, i.e. the most persistent regions in the upper
panels) are the most relevant. The steepest decrease in the efficiency occurs when deleting the strongest edges
first. Conversely, periphery regions only mildly contribute to the network efficiency, as demonstrated by the
slowest decrease upon cutting weakest edges fi rst37.
To highlight the impact of the lockdown on actual mobility networks, we superimpose values in the networks
observed across distinct weeks over the results of the percolation process. Each point in the curve corresponds to
a certain statistic computed on the mobility network aggregated over each week (see “Materials and methods”).
Mobility networks are divided into three categories based on the period taken into account: the weeks before the
national lockdown, the week in which the lockdown took place, and the weeks after the lockdown.
We observe that the residual amount of edges decreases over time and it differs from country to country.
France displays the lowest percentage of residual edges, while Italy and the UK tend to retain a higher percent-
age of their edges. Moreover, we notice how Italy and UK strongly differ in terms of the evolution of LWCC size:
although they lose roughly the same fraction of edges, there is a strong difference in terms of the number of
connected nodes. Despite such differences, percolation by increasing order of weights approximates adequately
Scientific Reports | (2021) 11:13141 | https://doi.org/10.1038/s41598-021-92399-2 5
Vol.:(0123456789)www.nature.com/scientificreports/
Figure 4. Correlation of node persistence with economic and demographic variables. Left panel: correlation
between Node Persistence and GDP per Capita in 2016, with the size of nodes corresponding to Total
Population in 2018. Right panel: correlation between Node Persistence and Value Added per Capita in 2016,
with the size of nodes corresponding to Population Density in 2018. Overall correlation is significantly positive
with respect to GDP per Capita (P–R: P ∼ 0 R = 0.37; S–R: P ∼ 0 R = 0.39; K–T: P ∼ 0 R = 0.27) and Valued
Added per Capita (P–R: P ∼ 0 R = 0.3; S–R: P ∼ 0 R = 0.4; K–T: P ∼ 0 R = 0.27). Country correlations with
Value Added per Capita are positive and significant for all countries, while for GDP per Capita are positive and
significant only for Italy and France but not for UK (full results reported in section “Materials and methods”).
Nodes have been aggregated at the province level to match economic variables. Colors of scatter points
correspond to three countries in the sample. Full sample regression line reported as the continuous black line,
while regressions lines for single countries are reported as colored dashed lines. Top 1% of the nodes by GDP
Per Capita (left) or Value Added per Capita (right) has been removed to avoid the influence of outlier values and
ease visualization (correlation results for the full sample are reported in “Materials and methods”).
the decreasing trend of the LWCC size observed in all countries. The case of the normalized global efficiency is
somewhat different: all countries show a similar loss proportionally to their initial efficiency. Additionally, the
trend of the empirical curves is closer to that of the decreasing weight percolation strategy. The major differ-
ence observed between the middle and bottom rows of Fig. 3 is based on the fact that the considered empirical
statistics follow opposite link removal strategies. This effect is due in part to the nature of the two measures;
the former more related to the density and the structure of connections and the second more related to their
weight. Overall, it is interesting to observe how the lockdown cannot be modeled by a removal strategy based
only on edge weights. Rather, it is the result of a joint effect deriving from the removal of links based both on
their structural importance and weight.
Economic and demographic features of most resilient nodes
As the last step in the analysis, we examine if the resilience of nodes in the network can be explained by spe-
cific economic and demographic characteristics. In the left panel of Fig. 4, we plot the relation between Gross
Domestic Product (GDP) Per Capita in 2016 and Node Persistence of the municipalities in the mobility network
aggregated at the province level. Colors correspond to three countries in the sample and the size of the scatter
points is proportional to the total population in the province for the year 2019. To eliminate the effect of outliers
we calculate correlations removing the top 1% observations by GDP (results on the full sample are reported in
Table 1 of section “Materials and methods”). We find an overall positive and significant correlation among the
two variables (Pearson’s R (P–R): P ∼ 0 R = 0.37; Spearman’s Rho (S–R): P ∼ 0 R = 0.39; Kendall’s Tau (K–T):
P ∼ 0 R = 0.27) meaning that the most persistent nodes are often located in provinces where production per
capita is higher, confirming the insights acquired when studying the patterns of country mobility resilience.
However, by looking at the country-specific correlations (the colored dashed lines in the left panel of Fig. 4) we
find that the positive relation is especially true for France and Italy while GDP per Capita in the UK has a weaker
relation with Node Persistence. By looking at correlation coefficients for single countries (reported in “Materials
and methods”) we note that coefficients for Italy and France are higher and significant while UK correlation is
lower and significant only at a significance level between 0.1 and 0.05. This finding is explained by the different
patterns of resilience in the UK which is more equally distributed across municipalities without showing the
emergence of a strong core-periphery structure.
The relation between total population and persistence is instead less strong in the whole sample (P–R: P ∼ 0
R = 0.22; S–R: P ∼ 0 R = 0.32; K–T: P ∼ 0 R = 0.21) as also signaled by the absence of a visible pattern of the
size of the scatter points. However, unlike the correlation with GDP per Capita, the weaker relation is significant
Scientific Reports | (2021) 11:13141 | https://doi.org/10.1038/s41598-021-92399-2 6
Vol:.(1234567890)www.nature.com/scientificreports/
All observations Without top 1%
Country Pearson Spearman Kendall Obs Pearson Spearman Kendall Obs
All 0.3046 0.4154 0.2894 328 0.3732 0.3962 0.2745 324
ITA 0.4305 0.5374 0.3866 110 0.4305 0.5374 0.3866 110
Gdp Per Capita (2016) FR 0.7751 0.5409 0.3836 93 0.5655 0.5101 0.3574 91
UK 0.2294 0.2148 0.1529 125 0.1795 0.1964 0.1406 123
0.0101 0.0162 0.0122 0.0469 0.0295 0.0224
All 0.2766 0.3344 0.2273 329 0.2234 0.3179 0.2152 325
ITA 0.6543 0.4939 0.3581 110 0.3706 0.4507 0.3235 107
Total population (2019)
FR 0.6035 0.7921 0.605 94 0.6358 0.7862 0.6001 93
UK 0.4544 0.5095 0.3603 125 0.4544 0.5095 0.3603 125
All 0.398 0.4215 0.2917 328 0.3059 0.402 0.2762 324
ITA 0.639 0.5987 0.4369 110 0.5433 0.5764 0.4171 108
Value added per capita (2016)
FR 0.794 0.7801 0.5954 93 0.6012 0.7655 0.5783 91
UK 0.4214 0.5203 0.3744 125 0.4214 0.5203 0.3744 125
All 0.5966 0.813 0.622 329 0.6594 0.806 0.6128 325
ITA 0.8303 0.6612 0.4863 110 0.8303 0.6612 0.4863 110
Population density (2016)
FR 0.8292 0.8542 0.6794 94 0.9265 0.8394 0.6588 91
UK 0.5311 0.6985 0.5079 125 0.517 0.6911 0.4998 124
Table 1. Correlation among node persistence and economic and demographic indicators calculated for all
countries together and separately on each country subset. Calculation performed on the full sample (columns
on the left) and on the sample without the top percentile to avoid the influence of outliers. First row reports
correlation coefficients, second row reports in italic p values only for values greater than 0.001.
both in the full sample and in the single country cases with the stronger relation found in France (P–R: P ∼ 0
R = 0.63; S–R: P ∼ 0 R = 0.78; K–T: P ∼ 0 R = 0.60). We can conclude that node persistence is higher in heavily
populated provinces of France while in Italy and the UK the relation is less clear.
We repeat the analysis by using two different types of variables: Value Added per Capita and Population
Density for the year 2016. Results are reported in the right panel of Fig. 4. As with GDP per Capita, we find a
positive and significant relation between Node Persistence and Value Added per Capita (P–R: P ∼ 0 R = 0.3;
S–R: P ∼ 0 R = 0.4; K–T: P ∼ 0 R = 0.27), this time in both the full sample and in the single country analysis
and with higher correlation coefficients. We find, on average, a very strong and significant relation with Popula-
tion Density in every case, as can be seen by the pattern of scatter points of greater size in the top part of the plot
(P–R: P ∼ 0 R = 0.66; S–R: P ∼ 0 R = 0.80; K–T: P ∼ 0 R = 0.61).
We can conclude that Node Persistence is highly correlated with the wealth of provinces (either measured
by Value Added Per Capita or, with a smaller effect, by GDP per Capita) and with the density and the size of the
population on the territory. These effects are almost always stronger for Italy and France than for the UK. All
in all, we can see how these features identify territories where urban areas and important cities create a strong
modular structure with few central nodes and several peripheral zones, while in the case of the UK the territory
is organized in a completely different manner. As a consequence, the economic effect of lockdown measures in
these countries will certainly show a completely different spatial pattern which should be carefully analyzed.
Conclusions
The COVID-19 pandemic is stressing the structural robustness of our societies. Most national governments have
reacted to the contagion by applying mobility restrictions to contain the disease outbreak. The resulting disrup-
tion is similar to that caused by a natural disaster, but the effect is on a global scale. In this work, we analyze the
effects of the lockdown in Italy, France, and the UK leveraging data from Facebook accounting for the movements
of more than 13M individuals. We provide a framework to assess the effective impact of mobility restrictions
and to perform a comparative analysis of the national mobility networks. We find that lockdown mainly affects
national smallworldness—i.e., mobility restrictions yield a strong reduction of long-range connections in favor
of local paths. Our analysis confirms that the national resilience to massive stress differs and depends upon the
inner connectivity structure. Indeed, the three countries show very different mobility patterns that reflect the
diversity of their underlying infrastructure, more concentrated in the case of France and UK, and more dis-
tributed in the case of Italy. Our analysis provides further insights into the interplay between human mobility,
disease spreading and economic variables. Understanding the resilience of mobility networks can contribute to
enhance the preparedness to future systemic crises and to improve our predictive capabilities on the economic
and social impact of mobility restriction policies.
Materials and methods
Mobility data and networks. We analyzed human mobility leveraging data provided by Facebook
rogram31. The platform provides movement maps that are based on de-identified
through its “Data for Good” p
and aggregated information of Facebook users who enabled their geo-positioning.
Scientific Reports | (2021) 11:13141 | https://doi.org/10.1038/s41598-021-92399-2 7
Vol.:(0123456789)www.nature.com/scientificreports/
Movements across administrative regions (i.e. municipalities in our case) are aggregated with a 8-h frequency,
and describe the amount of traffic flowing between two municipalities in a given time window. Similar to data
analyzed in recent research on mobility restrictions applied in C hina6,7, Facebook does not really provide the
number of people moving between two locations but rather an index, constructed with a proprietary method to
ensure privacy and anonymization, that highly correlates with real movements31.
We collected data relative to mobility in Italy, France and United Kingdom until April 15th, with different
starting times depending on the availability of Facebook maps (respectively February 23th, March 10th and
March 4th). The average number of daily users with their location enabled during the period of interest is
13,669,145 (France: 4,110,226; UK: 5,801,979; Italy: 3,786,940).
For the sake of our analysis we represent mobility flows using a weighted directed graph where nodes are
municipalities and edges are weighted based on the amount of traffic flowing between two locations. To represent
mobility networks before/during lockdown we aggregate daily traffic on windows of 12–13–14 days (respectively
for France, UK and Italy) before/after the day of intervention depending on the availability of data. From these
data, we build several graphs for each country. We consider a directed daily graph at municipality levels, where
there can be only one edge per day from municipality A to municipality B, whose weight is the daily sum of all
edges from A to B. The same procedure is applied for building aggregate networks at different time scales such
as weekly graphs of pre/post lockdown graphs.
Network efficiency. The efficiency is a global network measure that combines the information deriving
from the network cohesiveness and the distance among the nodes. It measures how efficiently information is
exchanged over the network33 and it can be defined as the average of nodal efficiencies eij among couples of ver-
tices of the network. Given a weighted network G(V, E) with n = |V | nodes and m = |E| edges, the connections
of G are represented by the weighted adjacency matrix W with elements {wij } where wij ≥ 0 ∀ i, j. The global
efficiency can be written by means of the following expression:
1 1 1
Eglob (G) = eij = (1)
n(n − 1) n(n − 1) dij
i�=j∈V i�=j∈G
where dij is the distance between two generic nodes i and j, defined as the length of the shortest path among such
nodes. The shortest path length dij is the smallest sum of the weights wij throughout all the possible paths in the
network from i to j. When node i and j cannot be connected by any path then dij = +∞ and eij = 0. Following
the methodology of33, the global efficiency Eglob (G) is normalized in order to assume maximum value E(G) = 1
in the case of perfect efficiency. In such a setting the nodal efficiency, i.e. the contribution of each node to the
global efficiency, can be simply written as:
1 1
ei = . (2)
n−1 dij
j�=i
Beside the geographical distance between two nodes of the graphs, proximity can also be defined consider-
ing that two locations are closer if many movements happen between them. To compute network efficiency in
our case we use the reciprocal of weights on links to obtain the shortest path distance among couples of nodes.
Gini index. The Gini index is a classic example of a synthetic indicator used for measuring inequality of
social and economic conditions. The Gini index can be defined starting from the Gini absolute mean difference
39 of a generic vector y with n elements, that can be written as:
1
n n
=
n2
|yi − yj | (3)
i=1 j=1
The relative mean difference is consequently defined as �/µy where µy = n−1 ni=1 yi . Thus, the relative
mean difference equals the absolute mean difference divided by the mean of the vector y. The Gini index g is
one-half of the Gini relative mean difference.
�
g=
2µy (4)
Values of g ∼ 1 signal that the considered vector displays high inequality in the distribution of its entries,
while values of g ∼ 0 signal a tendency towards equality.
Percolation process and node persistence. To measure the extent to which a node resists to percolation
process, we define the following quantity as node persistence. Consider a graph G with nodes V = {v1 , . . . , vk }
and edges E = {e1 , . . . , eh }. Let S : E � → R+ be a function that assign a finite positive real number wl , l ∈ 1 . . . h
to each edges e1 , . . . , eh of the network. For instance, S can be the function that assigns each edge its weight or its
position in the edge ranking for a certain metric, e.g edge betweenness. More simply, S can be seen as a function
that assigns a removal order to the edges. Consider the finite set W = [w1 , . . . , wn+1 ] of the distinct values taken
by wl , with w1 < w2 < · · · < wn+1. Suppose that we run a percolation process that consists of sequentially delet-
ing edges according to the values assigned by S to each edge in increasing order, that is, in the first iteration we
Scientific Reports | (2021) 11:13141 | https://doi.org/10.1038/s41598-021-92399-2 8
Vol:.(1234567890)www.nature.com/scientificreports/
delete all the edges with wl less or equal than w1, in the second iteration we delete all the edges with weights less
or equal than w2 and so on until the last iteration, n + 1, where we delete all the edges in the network.
Notice that there is no loss of generality in considering only increasing order, since the S function can be
arbitrarily defined.
Thus, at iteration i, we delete all the edges with wl less or equal than wi . Consider now a node vj ∈ V. At each
step of the process, vj may or may not be part of the LWCC of the network G. Clearly, if vj does not belong to the
LWCC of G at step i, it will not be in the LWCC of G at step i + 1, i + 2, . . . , n + 1. Defining Mvj as the maximum
number of iterations i such that vj belongs to the LWCC of G, the persistence of node vj respect to the ordering
induced by function S is defined as:
M vj
ρ= (5)
n
That is, if the whole process takes n + 1 iterations to disconnect the whole network, the persistence of a node vj
respect to the function S is defined as the maximum number of iterations for which vj is connected to the LWCC
over the maximum number of iteration for which there are connected nodes in the network.
Notice that several instances of the function S and several edge removal strategies can be considered to model
different percolation processes. We tried several removal strategies based on different edge features such as
weight, geographical distance, and edge betweenness. Since our goal is to mimic the disruption of the countries’
mobility networks, we focus on the one that better approximates the networks’ connectedness over time, which
turned out to be increasing edge weight (Supplementary Information 1).
Correlation of economic and demographic indicators with nodes persistence.
Data availibility
For what concerns Facebook human mobility, all data are provided under an academic license agreement with
Facebook through its “Data for Good” program (available at https://dataforgood.fb.com/tools/disease-preve
ntion-maps/). Facebook releases data upon request to nonprofit organization and academics. Economic data
have been obtained from Eurostat and are available at https://ec.europa.eu/eurostat/data/database.
Received: 8 November 2020; Accepted: 3 June 2021
References
1. Remuzzi, A. & Remuzzi, G. Covid-19 and Italy: What next?. Lancet 395, 1225 (2020).
2. Lai, S. et al. Effect of non-pharmaceutical interventions to contain COVID-19 in China (2020).
3. Klein, B. et al. Reshaping a nation: Mobility, commuting, and contact patterns during the COVID-19 outbreak (2020).
4. Pullano, G., Valdano, E., Scarpa, N., Rubrichi, S. & Colizza, V. Population mobility reductions during COVID-19 epidemic in
France under lockdown (2020).
5. Davies, N. G. et al. The effect of non-pharmaceutical interventions on COVID-19 cases, deaths and demand for hospital services
in the UK: A modelling study. medRxiv 5(7), e375–e385 (2020).
6. Chinazzi, M. et al. The effect of travel restrictions on the spread of the 2019 novel coronavirus (COVID-19) outbreak. Science 368,
395–400 (2020).
7. Kraemer, M. U. et al. The effect of human mobility and control measures on the COVID-19 epidemic in China. Science 368, 493–497
(2020).
8. Oliver, N. et al. Mobile phone data for informing public health actions across the COVID-19 pandemic life cycle (2020).
9. Gatto, M. et al. Spread and dynamics of the COVID-19 epidemic in Italy: Effects of emergency containment measures. Proc. Natl.
Acad. Sci. 20, 20 (2020).
10. Atkeson, A. What will be the economic impact of COVID-19 in the US? Rough estimates of disease scenarios (Tech. Rep, National
Bureau of Economic Research, 2020).
11. Anderson, R. M., Heesterbeek, H., Klinkenberg, D. & Hollingsworth, T. D. How will country-based mitigation measures influence
the course of the COVID-19 epidemic?. Lancet 395, 931–934 (2020).
12. McKibbin, W. J. & Fernando, R. The global macroeconomic impacts of COVID-19: Seven scenarios (2020).
13. Gonzalez, M. C., Hidalgo, C. A. & Barabasi, A.-L. Understanding individual human mobility patterns. Nature 453, 779–782 (2008).
14. Dong, Z., Chen, Y.-C. & Dobra, A. A statistical framework for measuring the temporal stability of human mobility patterns. J.
Appl. Stat. 20, 1–19 (2020).
15. Eubank, S. et al. Controlling epidemics in realistic urban social networks. Nature 429, 25 (2004).
16. Buckee, C. O. et al. Aggregated mobility data could help fight COVID-19. Science https://doi.org/10.1126/s cience.abb8021 (2020).
https://science.sciencemag.org/content/early/2020/03/20/science.abb8021.full.pdf.
17. Brockmann, D., Hufnagel, L. & Geisel, T. The scaling laws of human travel. Nature 439, 462–465 (2006).
18. Havlin, S. & Ben-Avraham, D. Diffusion in disordered media. Adv. Phys. 51, 187–292 (2002).
19. Song, C., Koren, T., Wang, P. & Barabási, A.-L. Modelling the scaling properties of human mobility. Nat. Phys. 6, 818–823 (2010).
20. Song, C., Qu, Z., Blumm, N. & Barabási, A.-L. Limits of predictability in human mobility. Science 327, 1018–1021 (2010).
21. Barbosa, H. et al. Human mobility: Models and applications. Phys. Rep. 734, 1–74 (2018).
22. Bagrow, J. P., Wang, D. & Barabási, A.-L. Collective response of human populations to large-scale emergencies. PLoS One 6, e17680.
https://doi.org/10.1371/journal.pone.0017680 (2011).
23. Lu, X., Bengtsson, L. & Holme, P. Predictability of population displacement after the 2010 Haiti earthquake. Proc. Natl. Acad. Sci.
109, 11576–11581. https://doi.org/10.1073/pnas.1203882109 (2012).
24. Wang, Q. & Taylor, J. E. Quantifying human mobility perturbation and resilience in hurricane sandy. PLoS One 9, e112608. https://
doi.org/10.1371/journal.pone.0112608 (2014).
25. Wang, Q. & Taylor, J. E. Patterns and limitations of urban human mobility resilience under the influence of multiple types of natural
disaster. PLoS One 11, e0147299. https://doi.org/10.1371/journal.pone.0147299 (2016).
26. Martín, Y., Li, Z. & Cutter, S. L. Leveraging twitter to gauge evacuation compliance: Spatiotemporal analysis of hurricane Matthew.
PLoS One 12, e0181701. https://doi.org/10.1371/journal.pone.0181701 (2017).
Scientific Reports | (2021) 11:13141 | https://doi.org/10.1038/s41598-021-92399-2 9
Vol.:(0123456789)www.nature.com/scientificreports/
27. Wellenius, G. A. et al. Impacts of state-level policies on social distancing in the United States using aggregated mobility data during
the COVID-19 pandemic. arXiv:2004.10172 (arXiv preprint) (2020).
28. M Herren, C., K Brownwright, T., Y Liu, E., El Amiri, N., & Majumder, M. S. Democracy and mobility: A preliminary analysis of
global adherence to non-pharmaceutical interventions for COVID-19. Brownwright, Tenley and Y. Liu, Erin and El Amiri, Nisrine
and Majumder, Maimuna, Democracy and Mobility: A Preliminary Analysis of Global Adherence to Non-Pharmaceutical Interven-
tions for COVID-19 (April 7, 2020) (2020).
29. Bonaccorsi, G. et al. Economic and social consequences of human mobility restrictions under COVID-19. Proc. Natl. Acad. Sci.
https://doi.org/10.1073/pnas.2007658117 (2020). https://www.pnas.org/content/early/2020/06/17/2007658117.full.pdf.
30. Kraemer, M. U. et al. Mapping global variation in human mobility. Nat. Human Behav. 20, 1–11 (2020).
31. Maas, P. et al. Facebook disaster maps: Aggregate insights for crisis response and recovery. In Proceedings of the 16th International
Conference on Information Systems for Crisis Response and Management (ISCRAM), Valencia, Spain. 2019 (2019).
32. Li, D. et al. Percolation transition in dynamical traffic network with evolving critical bottlenecks. Proc. Natl. Acad. Sci. 112, 669–672
(2015).
33. Latora, V. & Marchiori, M. Efficient behavior of small-world networks. Phy. Rev. Lett. 87, 198701 (2001).
34. Gini, C. Measurement of inequality of incomes. Econ. J. 31, 124–126 (1921).
35. Essam, J. W. Percolation theory. Rep. Progress Phys. 43, 833 (1980).
36. Voronoi, G. Nouvelles applications des paramètres continus à la théorie des formes quadratiques. deuxième mémoire. Recherches
sur les parallélloèdres primitifs. J. Reine Angew. Math. 1908, 198–287 (1908).
37. Bellingeri, M., Bevacqua, D., Scotognella, F., Alfieri, R. & Cassi, D. A comparative analysis of link removal strategies in real complex
weighted networks. Sci. Rep. 10, 1–15 (2020).
38. Zhou, S. & Mondragón, R. J. The rich-club phenomenon in the internet topology. IEEE Commun. Lett. 8, 180–182 (2004).
39. Kendall, M. G. & Stuart, A. The Advanced Theory of Statistics, Distribution Theory Vol. 1 (Hafner Publishing Company, 1958).
Author contributions
Author contributions: A.G., M.C., A.S., G.B., F.P. and W.Q. designed research; A.G., M.C., A.S., G.B. and W.Q.
performed the research; A.G., M.C., A.S., G.B., F.P., A.L.S., F.P., and W.Q. wrote the paper; A.G., M.C., G.B., F.P.,
A.L.S., collected the data.
Competing interests
The authors declare no competing interests.
Additional information
Supplementary Information The online version contains supplementary material available at https://doi.org/
10.1038/s41598-021-92399-2.
Correspondence and requests for materials should be addressed to A.G.
Reprints and permissions information is available at www.nature.com/reprints.
Publisher’s note Springer Nature remains neutral with regard to jurisdictional claims in published maps and
institutional affiliations.
Open Access This article is licensed under a Creative Commons Attribution 4.0 International
License, which permits use, sharing, adaptation, distribution and reproduction in any medium or
format, as long as you give appropriate credit to the original author(s) and the source, provide a link to the
Creative Commons licence, and indicate if changes were made. The images or other third party material in this
article are included in the article’s Creative Commons licence, unless indicated otherwise in a credit line to the
material. If material is not included in the article’s Creative Commons licence and your intended use is not
permitted by statutory regulation or exceeds the permitted use, you will need to obtain permission directly from
the copyright holder. To view a copy of this licence, visit http://creativecommons.org/licenses/by/4.0/.
© The Author(s) 2021
Scientific Reports | (2021) 11:13141 | https://doi.org/10.1038/s41598-021-92399-2 10
Vol:.(1234567890)You can also read