Beetle Species-Area Relationships and Extinction Rates in Protected Areas - MDPI
←
→
Page content transcription
If your browser does not render page correctly, please read the page content below

insects
Article
Beetle Species–Area Relationships and Extinction
Rates in Protected Areas
Simone Fattorini
 Department of Life, Health and Environmental Sciences, University of L’Aquila, 67100 L’Aquila, Italy;
 simone.fattorini@univaq.it

 Received: 21 August 2020; Accepted: 17 September 2020; Published: 21 September 2020

 Simple Summary: Larger areas tend to host more species. This general ecological pattern (known as
 the species–area relationship, SAR) can be used to calculate expected extinction rates following area
 (habitat) loss. Here, using data from Italian reserves, SAR-based extinction rates are calculated for
 beetle groups with different ecology: terrestrial predators, aquatic predators, dung feeders, herbivores,
 and detritivores. Reserve area was an important predictor of species richness in all cases. However,
 also other factors besides area were important correlates of species richness. For some groups, species
 richness tends to decline with elevation and/or northwards. Extinction rates are higher for dung
 beetles, due to their dependence on large grazing areas, and detritivores, due to their low dispersal
 capabilities, which reduce their ability to reach new places when environmental conditions became
 less favorable. The lower extinction rates predicted for other groups can be explained by their higher
 dispersal ability. Extinction rates by area loss are always relatively low. This means that, in reserves
 with few species, many extinctions might be unnoticed.

 Abstract: The species–area relationship (SAR, i.e., the increase in species richness with area) is one
 of the most general ecological patterns. SARs can be used to calculate expected extinction rates
 following area (habitat) loss. Here, using data from Italian reserves, extinction rates were calculated
 for beetle groups with different feeding habits: Carabidae (terrestrial predators), Hydradephaga
 (aquatic predators), coprophagous Scarabaeoidea (dung feeders), phytophagous Scarabaeoidea
 (herbivores), and Tenebrionidae (detritivores). The importance of other factors besides area (namely
 latitude and elevation) was investigated. Reserve area was recovered as an important predictor of
 species richness in all cases. For Carabidae, Hydradephaga, and Tenebrionidae, elevation exerted
 a negative influence, whereas latitude had a negative influence on coprophagous Scarabaeoidea
 and Tenebrionidae, as a consequence of current and historical biogeographical factors. Extinction rates
 were higher for dung beetles, due to their dependence on large grazing areas, and Tenebrionidae, due to
 their low dispersal capabilities. The lower extinction rates predicted for Carabidae, phytophagous
 Scarabaeoidea, and Hydradephaga can be explained by their higher dispersal power. If other variables
 besides area are considered, extinction rates became more similar among groups. Extinction rates by
 area loss are always relatively low. Thus, in reserves with few species, many local extinctions might
 be unnoticed.

 Keywords: species–area relationship; elevational gradient; latitudinal gradient; reserves; biological
 conservation; extinction rates; Coleoptera; Mediterranean; Italy

1. Introduction
    The species–area relationship (SAR, i.e., the increase in species richness with area) is an almost
ubiquitous ecological pattern [1]. There is increasing interest in how the SAR can be used for
conservation purposes, including the selection of biodiversity hotspots [2–4], the identification of

Insects 2020, 11, 646; doi:10.3390/insects11090646                                www.mdpi.com/journal/insects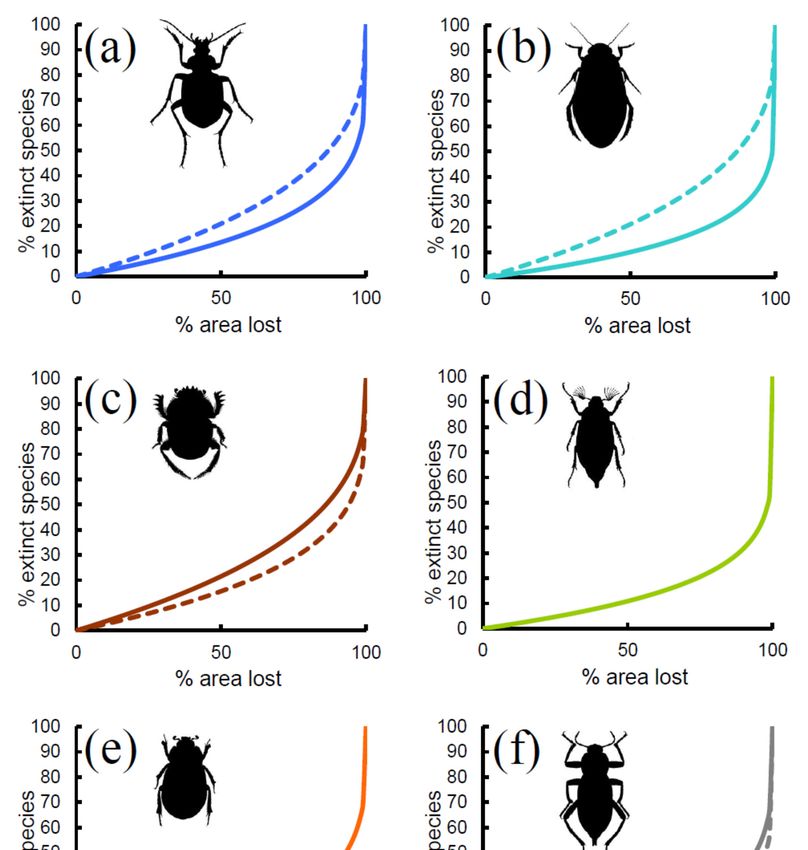
Insects 2020, 11, 646                                                                                  2 of 18

the best size and shape of natural areas [5–8], and the prediction of species extinction [9,10]. There is a
debate about how accurate species extinction rates based on the SAR are [10]. Although some analyses
suggest that SAR-based extinction rates are overestimated, empirical data indicate that the SAR
probably underestimates, not overestimates species extinctions [9,10].
      The basic idea in the use of the SAR to predict species loss is that a reduction in area size implies a
reduction in species number. Thus, the same function which is used to model the SAR can be used,
in a reverse way, to predict species loss. Empirical evidence largely supports that, at least for isolates,
most systems are adequately modelled by the power function (1):

                                                  S = cAz                                                 (1)

where S is the species number, A is area, and c and z are fitting parameters [11,12]. The power function
is frequently applied in its linearized (log-log) form using decimal logarithms (2):

                                        log(S) = log(c) + z log (A)                                       (2)

     In this form, c is the expected number of species per area unit, and z is the slope of the function [13].
     The use of the SAR to predict species extinction is based on the assumption that if the original
area A0 is reduced to A1 , the original number of species S0 is expected to decline to S1 , according to
the following Equation (3) [10]:
                                            S1 = S0 (A1 /A0 )z                                            (3)

      Using this approach, it is possible to predict extinction rates in isolated blocks of fragmented
habitats, including protected areas, following area loss [14–16].
      The Italian peninsula is located in the center of the Mediterranean Basin, one of the world’s
hotspots of biodiversity [8,17,18], showing exceptionally high levels of diversity for a variety of plant
and animal taxa [19,20]. At the same time, due to the profound, millenary impacts on the wilderness of
this area, the Mediterranean biodiversity has been strongly influenced by the human presence, and it
is currently under many threats [21,22].
      According to the last official report, in Italy there are some 900 protected areas, occupying a
terrestrial surface of about three million hectares (about 11% of the country) [23], plus about other
400 areas that benefit from some form of protection, for a further 430,000 hectares [24]. The number
and size of protected areas is, however, under continuous change.
      Biodiversity knowledge for most of the Italian protected areas is extremely poor, especially
for invertebrates. However, for at least some groups, there is information about the number of
species present in some reserves. In particular, thanks to the interest of professional and amateur
entomologists, some beetle groups are among the few invertebrates for which it is possible to gather
reliable values of species richness for sets of Italian reserves. Beetles are the most diversified group
of living organisms, constituting about 40% of all described insect species and 25% of all known
life-forms [25,26]. Beetles occur in most terrestrial and freshwater habitats and are ecologically
extremely diversified, which makes these insects very useful in comparative analyses: for example,
with reference to their trophic habits, dispersal capabilities, and ecological preferences.
      In this paper, I used data on beetle groups characterized by very different ecology (terrestrial
predators, aquatic predators, dung feeders, herbivores, and terrestrial detritivores) from Italian reserves
to investigate how extinction rates based on the use of the SAR vary according to the beetle’s ecology.

2. Materials and Methods
    I collected literature data on species richness for Carabidae, Hydradephaga, Scarabaeoidea,
and Tenebrionidae from Italian reserves. Carabidae are a family of mainly terrestrial predators [27],
whereas Hydradephaga are a group of families (Gyrinidae, Haliplidae, Noteridae, Dytiscidae,
Hygrobiidae for the Italian fauna) of freshwater predators [28,29]. Scarabaeoidea, as intended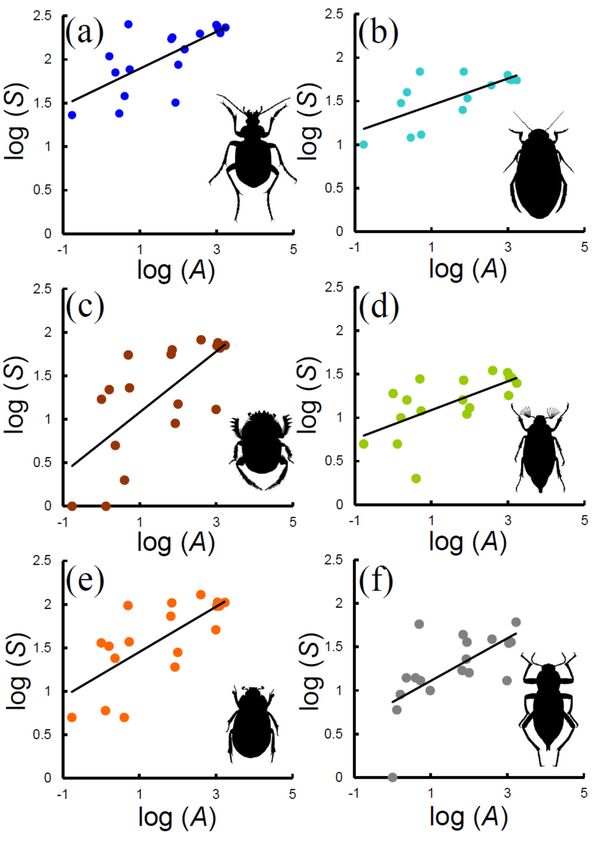
Insects 2020, 11, 646                                                                                              3 of 18

Insects 2020, 11,                                                                                               3 of 18
here, include Trogidae, Bolboceratidae, Geotrupidae, Hybosoridae, Ochodaeidae, Glaphyridae,
 Scarabaeidae
and    Scarabaeidae  (including    Aphodiinae,
                          (including    Aphodiinae,  Scarabaeinae,
                                                         Scarabaeinae,  Orphninae,
                                                                           Orphninae,  Melolonthinae,
                                                                                          Melolonthinae,Rutelinae,
                                                                                                              Rutelinae,
 Dynastinae, and Cetoniinae), but not Lucanidae [30]. The Scarabaeoidea include species with a wide
Dynastinae, and Cetoniinae), but not Lucanidae [30]. The Scarabaeoidea include species with a
 spectrum of feeding habits, but most of the species are either coprophagous (dung beetles) or
wide spectrum of feeding habits, but most of the species are either coprophagous (dung beetles) or
 phytophagous [30]. For this reason, I conducted analyses for the whole group and for the
phytophagous [30]. For this reason, I conducted analyses for the whole group and for the coprophagous
 coprophagous and phytophagous species separately (the whole group analyses included more
and phytophagous species separately (the whole group analyses included more species than the sum
 species than the sum of coprophagous and phytophagous because of the presence of species that did
of coprophagous and phytophagous because of the presence of species that did not belong to these two
 not belong to these two categories, for example mycetophagous species). Finally, Tenebrionidae are
categories, for example mycetophagous species). Finally, Tenebrionidae are essentially saprophagous
 essentially saprophagous insects [27]. Although the Alleculinae (formerly considered a separate
insects [27]. Although the Alleculinae (formerly considered a separate family) fall within the tenebrionid
 family) fall within the tenebrionid cladogenesis, I did not consider them in the analysis because of
cladogenesis, I did not consider them in the analysis because of their extremely different and highly
 their extremely different and highly derived ecological characteristics (they are the only flower
derived
 visiting ecological
           tenebrionids  characteristics
                            and, contrary (they   are the
                                             to most      only flowerthey
                                                       tenebrionids,    visiting tenebrionids
                                                                            are flying  insects)and,
                                                                                                  [31].contrary  to most
                                                                                                        Additionally,
tenebrionids,      they   are flying  insects)   [31]. Additionally,    for most  reserves,    there
 for most reserves, there is no information on alleculines. I also omitted the genus Lagria (another is no information
on   alleculines.
 flower   visiting Itenebrionid)
                       also omittedand the the
                                            genus   Lagria
                                                 genus       (another flower
                                                         Myrmechixenus,        visiting
                                                                            since        tenebrionid)
                                                                                   its distribution   is and
                                                                                                         very the genus
                                                                                                               poorly
Myrmechixenus,
 known. I also omittedsince its distributionspecies
                             synanthropic      is very[31].
                                                        poorly known. I also omitted synanthropic species [31].
       Overall,
       Overall, I collected data from 23 Italian reserves(18
                 I  collected  data from   23  Italian reserves   (18reserves
                                                                      reservesfor
                                                                               forCarabidae
                                                                                    Carabidae[32–45],
                                                                                                 [32–45],14
                                                                                                          14reserves
                                                                                                             reservesfor
Hydradephaga
 for Hydradephaga     [32,33,35,46–50],  18 reserves
                           [32,33,35,46–50],            for Scarabaeoidea
                                                18 reserves                  [32,33,35,37,49,51–59],
                                                               for Scarabaeoidea                        and 18and
                                                                                    [32,33,35,37,49,51–59],     reserves
                                                                                                                     18
for  Tenebrionidae       [32,33,35,37,54,60–71]     (Figure   1). Contiguous    reserves   were   considered
 reserves for Tenebrionidae [32,33,35,37,54,60–71] (Figure 1). Contiguous reserves were considered to          to  a  be a
single   reserve.     Values   of species   richness   for  the  various
 a be a single reserve. Values of species richness for the various beetle beetle  groups    in  each reserve  are  given
                                                                                           in each reserve are given
in
 in Table
    Table 1.1.

      Figure 1. Location
      Figure     Locationofof
                            thethe
                                 23 23
                                    Italian reserves
                                       Italian       considered
                                               reserves         in this
                                                         considered   instudy. Reserve
                                                                         this study.   names are
                                                                                     Reserve     given
                                                                                             names     in given
                                                                                                     are  Table in
      1.
      Table 1.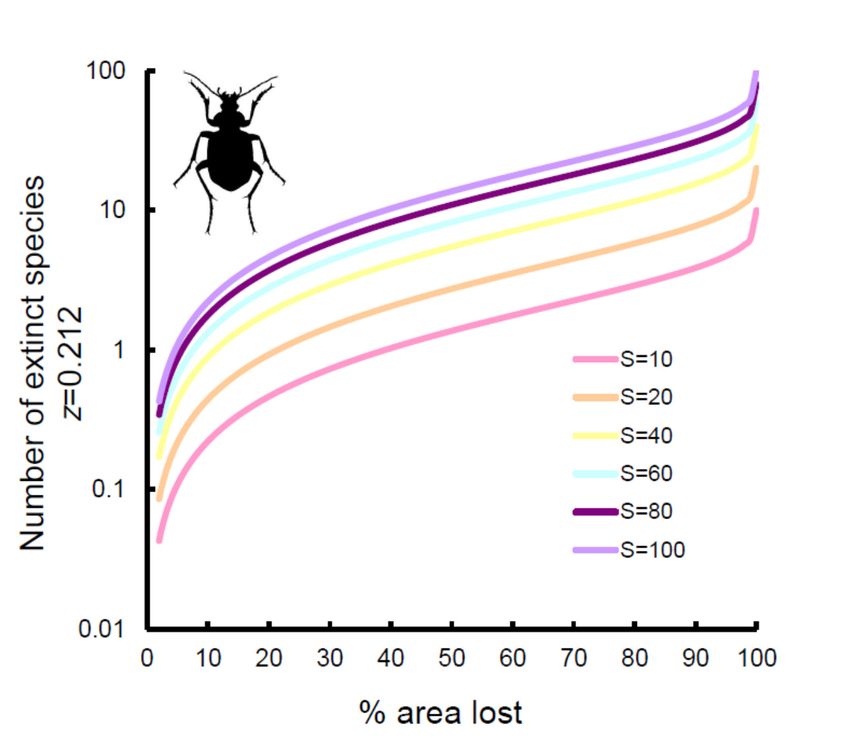
Insects 2020, 11, 646                                                                                                  4 of 18

      Table 1. Number of species for various beetle groups in Italian reserves. Res: Reserve number 1
      (reserves are numbered as in Figure 1); Lat: Latitude (decimal degrees); Lon: Longitude (decimal
      degrees); Area: reserve size (km2 ); Min: Minimum elevation (m); Max: Maximum elevation (m); Range:
      Elevational range (m); Mean: Mean elevation (m). Beetle groups: Ca: Carabidae; Hy: Hydradephaga;
      Co: coprophagous Scarabaeoidea; Ph: phytophagous Scarabaeoidea; Sc: all Scarabaeoidea; Te:
      Tenebrionidae. For reserve 8, elevational data without parentheses refer to Carabidae sampling points,
      and those in parentheses to Hydradephaga sampling points.

          Res     Lat    Lon     Area     Min      Max      Range Mean         Ca     Hy     Co     Ph     Sc     Te
           1     46.03   8.48     146      400     2200   1820 1116.5         131       -      -      -      -     -
           2     46.02   11.98     1       225      233      8    229           -       -     16     19     36    1
           3     45.31   8.93     983      116      300    184    208         249      63     12     33     51    13
           4     45.20   10.74    2.3       22       26      4     24          71      40      4     16     24    14
           5     45.04   11.24    1.3        7       15      8     14           -       -      0      5      6     6
           6     44.49   9.42     0.17    1326     1350     24   1330.5        23      10      0      5     5      -
           7     44.40   10.02    2.9     1330     1470    140   1406.5        24      12      -      -      -     -
                                           550     1200    650    868
           8     43.83   11.73   368.5                                        198      48      -      -     -      -
                                          (350)    (1450) (1106) (753.5)
           9     42.40   11.21     4        0         3      3    1.5          38       1      1      2     5     14
          10     42.16   13.82    100      300      400    100    350          87       -     14     13    28     16
          11     41.98   12.67    5.4       50      120     70     85          77      13     22     12    37     13
          12     41.93   15.11    9.6        0        1      1    0.5           -       -      -      -     -     10
          13     41.81   13.79   1040      700     2249   1549 1474.5         243       -     69     18    95      -
          14     41.81   15.85   1700       0       950    950    456         233      55     70     25    105    61
          15     41.70   12.38    70        0        70     70     35         179      69     62     27    104    44
          16     41.34   13.04    88        0       541    541   270.5          -      34      -      -     -     36
          17     40.95   15.63    66       650     1326    676    988         172      25     55     16    73     17
          18     40.82   14.43   84.8      200     1281   1081 740.5           32       -      8     11    19     23
          19     40.59   15.75    1.6      764      770      6    767         109      30     21     10    33      9
          20     40.18   16.70     5        0         6      6      3         253      69     54     28    97     58
          21     39.97   16.21   1100      800     2000   1200   1482         220      56     75     29    106    35
          22     39.32   16.58   1250     1000     1900    900   1425         201      55     65     29    96     36
          23     37.89   14.00   399.4     400     1979   1579 1189.5           -       -     81     35    129    39
      1 Reserve names: 1: Val Grande National Park; 2: Vincheto di Celarda Nature Reserve; 3: Ticino Regional Park;
      4: Bosco Fontana Nature Reserve; 5: Isola Boscone Nature Reserve; 6: Agoraie Nature Reserve; 7: Guadine Pradaccio
      Nature Reserve; 8: Foreste Casentinesi National Park; 9: Burano Nature Reserve; 10: Pescara Spring Nature Reserve
      and adjacent areas in the Valle Peligna; 11: Inviolata Archeological and Nature Park; 12: Foce Saccione Site of
      Community Importance; 13: Abruzzo, Latium and Molise National Park; 14: Gargano National Park and Isola
      Varano Nature Reserve; 15: Castelporziano Presidential Estate and Castelfusano Urban Park; 16: Circeo National
      Park; 17: Vulture Natural Park; 18: Vesuvius National Park; 19: Pantano di Pignola Reserve; 20: Policoro Reserve;
      21: Pollino National Park; 22: Sila National Park; 23: Madonie Regional Natural Park.

     For reserve areas, where possible, I referred to the official size. Some study areas did not
correspond exactly to the borders of a reserve. This occurred when a study area was only a part of
a larger reserve (reserve 22), when the study area was the sum of contiguous reserves (reserves 14
and 15), or when the study area included adjacent areas (reserves 10, 13, 23). In such cases, I used as
the size of the study area the surface reported in the reference used to extract the faunal data; if not
given, I calculated this surface from the maps provided by the authors of the faunal studies.
     The selected reserves ranged from 0.17 to 1700 km2 , thus spanning for four orders of magnitude.
This avoided the risk of the SAR appearing to be linear because of sampling a small range
of areas [72]. Reserves were distributed throughout the Italian peninsula and Sicily to fully
encompass the Italian latitudinal gradient. Reserves were also representative of coastal, internal plain,
and montane landscapes.
Insects 2020, 11, 646                                                                                 5 of 18

      SARs were first modelled using the linearized version of the power function (Equation (2)) with
log10 . Values of c and z for the SAR of the various groups were compared using Analysis of Covariance
(ANCOVA) [13]. z-values of SARs were used to calculate the expected number of species lost with
increasing area loss using Equation (3).
      Although this is the standard procedure to infer potential species loss due to area reduction,
the number of species is not controlled only by area. Even when area is the most important determinant
of species richness, other variables may exert a relevant role. Elevation is an important macroecological
variable that influences species richness [73]. To take into account the role of elevation, for each area,
I considered various measures of elevation: minimum, maximum, average, and range. Elevational
range was considered as a proxy of environmental variability. Mean elevation was intended to reflect
the overall orographic physiognomy of a given area, whereas minimum and maximum elevations
were introduced because extreme values are clearly distinctive of coastal and montane areas.
      When elevation of sampling sites was reported in the examined faunal studies, their values
were used to calculate minimum elevation, maximum elevation, elevational range (maximum minus
minimum) and mean elevation for the study areas (reserve 1 [43], reserves 6 and 7 [74], reserve 14 [75],
reserve 18 [76], reserve 21 [77], reserve 22 [78]). For reserve 8, I used elevation of sampling points
reported by Lestes [36] for Carabidae and by Rocchi and Mascagni [50] for Hydradephaga. For reserve
5, I referred to the minimum, maximum, and mean values reported by the authors of the faunal
study [54]. For reserve 23, I calculated the average elevation using minimum and maximum values as
given by Aliquò and Leo [60], integrated with topographic maps. In other cases, I calculated these
values from topographic maps.
      Due to the peculiar, north–south orientation of Italy, study areas are distributed along a latitudinal
gradient. It is well known that species richness of most taxa shows a distinct latitudinal pattern,
decreasing (in the northern hemisphere) from south to north [79–83]. This might influence the SAR by
negatively affecting species richness in northern areas. For this reason, I also considered the latitude
(measured in decimal degrees) of the reserve centroid as a further correlate. All variables were
log10 -transformed prior to analyses; a log10 (x+1) transformation was used to manage zero values for
coprophagous Scarabaeoidea (because of the presence of a reserve with no species) and minimum
elevation (for coastal areas with a minimum elevation of 0 m).
      To evaluate the relative importance of elevation (minimum, maximum, mean, and range)
and latitude in determining species richness besides reserve area, I used a multimodel selection
procedure in which all variables were tested individually and in all their possible combinations. Then,
models were ordered by decreasing values of the small-sample corrected Akaike Information Criterion
(AICc), and the model with the lowest AICc was selected as the best model; alternative models with
∆AIC values ≤ 2 were considered as equally supported [84]. When the best fit model included other
variables than area, the coefficient of area in the multiple model was used as a z-value for the estimation
of species loss in equation 3. In practice, this approach consists in predicting species loss by area
reduction, holding stable the influence of all other variables with an exponent z that, however, takes into
account their influence in species richness. This is reasonable in ecological terms, since the surface of a
certain study area suitable for a certain group of species can be reduced by habitat fragmentation, loss,
or alteration, whereas its geographical position and orography remain unchanged.
      All analyses were conducted in R version 3.5 [85]. Multimodel selection was performed using
the library MuMIn [86].

3. Results
     The power function modelled SARs of the various groups with very similar goodness of fit
(Figure 2, Table 2). z-values, which indicate the rate at which species accumulate with area, did not
vary significantly between groups (ANCOVA: F = 1.536, P = 0.200). By contrast, ANCOVA indicated
an overall significance difference between c-values (F = 18.72, P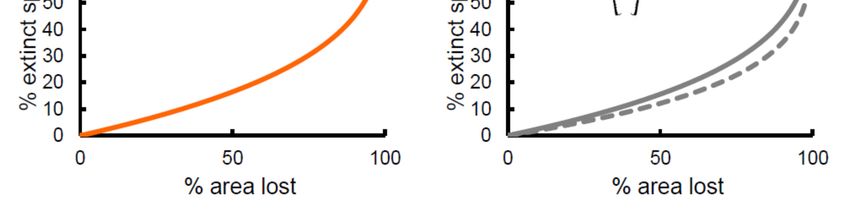
Insects 2020, 11, 646                                                                                                                                  6 of 18

in c-values were not significant in pairwise ANCOVAs): Carabidae (48 species) < Hydradephaga (20)
< phytophagous Scarabaeoidea (8) ~ Tenebrionidae (7) ~ coprophagous Scarabaeoidea (5).

      Table 2. Species–area relationships (SARs) for beetles in Italian reserves. SARs were modelled using
      the linearized version of the power function with decimal logarithms: log(S) = log(c) + z log (A), where
      S is the species number, A is area, and c and z are fitting parameters. SE: standard error, t = Student’s t,
      p = probability, R2 = goodness of fit.

     Beetle Group, R2 Values, and Estimated Parameters                                    Estimate ± SE                        t                 p
                     Carabidae (R2 = 0.50)
                             log(c)                                                          1.68 ± 0.11                 15.65
Insects 2020, 11, 6 of 18
differences in c-values were not significant in pairwise ANCOVAs): Carabidae (48 species) <
Hydradephaga (20) < phytophagous Scarabaeoidea (8) ~ Tenebrionidae (7) ~ coprophagous
Insects 2020, 11, 646 7 of 18
Scarabaeoidea (5).
Figure 2. Species–area relationships (SARs) for various beetle groups in Italian reserves: (a) Carabidae,
(b)Figure
Hydradephaga, (c) coprophagous
2. Species–area Scarabaeoidea,
relationships (SARs) for (d) phytophagous
various Scarabaeoidea,
beetle groups in Italian(e)reserves:
total (a)
Scarabaeoidea, (f) Tenebrionidae. Decimal logarithms are used.
Carabidae, (b) Hydradephaga, (c) coprophagous Scarabaeoidea, (d) phytophagous Scarabaeoidea, (e)
total Scarabaeoidea, (f) Tenebrionidae. Decimal logarithms are used.
Table 2. Species–area relationships (SARs) for beetles in Italian reserves. SARs were modelled using
the linearized version of the power function with decimal logarithms: log(S) = log(c) + z log (A), whereInsects 2020, 11, 646 8 of 18
For Carabidae, two equally supported models (∆AICc = 1.13) were selected as the best fit models:
the first model included area (positively) and elevational range (negatively, but not significantly);
the second model included only area (positively). For Hydradephaga, the best fit model included area
(positively) and elevational range (negatively). For coprophagous Scarabaeoidea, the best fit model
included area (positively) and latitude (negatively). For coprophagous and all Scarabaeoidea, the best
fit models included only area (positively). Finally, for Tenebrionidae, the best fit model included area
(positively), latitude (negatively), and minimum elevation (negatively).
Predicted rates of species extinction based on the z-values of the power function (Figure 3,
solid lines) showed similar patterns among groups, with small proportions of extinct species until
the fraction of lost area was very large. The most sensitive group was the coprophagous Scarabaeoidea,
for which a loss of 25% of area would lead to the local extinction of about 9% of the species (13% of
species with 33% of area lost, and 21% with 50% of area lost, respectively). Tenebrionidae would lose
about 7% of species if 25% of area was lost (9% of species with 33% of area lost, and 15% with 50% of
area lost, respectively). Total Scarabaeoidea showed a very similar trend. Carabidae would lose about
6% of species if 25% of area was lost (8% of species with 33% of area lost, and 13% with 50% of area
lost, respectively). Phytophagous Scarabaeoidea would lose about 5% of species if 25% of area was
lost (6% of species with 33% of area lost, and 11% with 50% of area lost, respectively), and a virtually
identical pattern was found for the Hydradephaga. Thus, sensitivity to extinction by area reduction
increased in the order: coprophagous Scarabaeoidea < Tenebrionidae < Carabidae < phytophagous
Scarabaeoidea < Hydradephaga.
If the coefficient for area obtained from the multiple regression models was used (Figure 3,
dashed lines), extinction rates increased substantially for Carabidae and Hydradephaga, with virtually
identical trends (9% of species with 25% of area lost, 12% of species with 33% of area lost, and 21%
with 50% of area lost, respectively). By contrast, extinction rates decreased slightly for coprophagous
Scarabaeoidea (7% of species with 25% of area lost, 9% of species with 33% of area lost, and 15% with
50% of area lost, respectively) and Tenebrionidae (5% of species with 25% of area lost, 7% of species
with 33% of area lost, and 12% with 50% of area lost, respectively). However, because of the relatively
small number of species occurring in each reserve, extinction might be difficult to detect. As shown in
Figure 4 for Carabidae (other groups had virtually identical patterns; the use of z-values from multiple
model also did not change the patterns; see Figure S1), with ten species, an area loss of more than
25% is necessary to observe one extinction, whereas with 100 species, a loss of 3% is sufficient to
have one extinction. A reduction of 33% of area would still translate to the loss of one species in a
reserve containing 10 species, 5 species in a reserve with 40 species, and 13 species in a reserve with
100 species. This suggests that extinctions might be hardly detectable, even for a very large loss of area,
if the reserve is small and contains few species.Insects 2020, 11, 646 9 of 18
Insects 2020, 11, 9 of 18
Figure 3. Extinction rates (% of extinct species) expected on the basis of area loss (% of area lost)
Figure 3. Extinction
for various rates (%
beetle groups in of extinct
Italian species)(a)
reserves: expected on the
Carabidae, (b)basis of area loss (%
Hydradephaga, (c)ofcoprophagous
area lost) for
various beetle groups
Scarabaeoidea, in Italian reserves:
(d) phytophagous (a) Carabidae,
Scarabaeoidea, (b) Hydradephaga,
(e) total Scarabaeoidea, (c) coprophagous
(f) Tenebrionidae. Solid
Scarabaeoidea,
lines: expected (d)
ratesphytophagous Scarabaeoidea,
from the species–area (e) total
relationship. Scarabaeoidea,
Dashed (f) Tenebrionidae.
lines: expected Solid
rates from multiple
lines: expected
regression rates from the species–area relationship. Dashed lines: expected rates from multiple
models.
regression models.
If the coefficient for area obtained from the multiple regression models was used (Figure 3,
dashed lines), extinction rates increased substantially for Carabidae and Hydradephaga, with
virtually identical trends (9% of species with 25% of area lost, 12% of species with 33% of area lost,
and 21% with 50% of area lost, respectively). By contrast, extinction rates decreased slightly forone species in a reserve containing 10 species, 5 species in a reserve with 40 species, and 13 species
a reserve with 100 species. This suggests that extinctions might be hardly detectable, even for a ve
large loss of area, if the reserve is small and contains few species.
Insects 2020, 11, 646 10 of 18
Figure 4. Number of extinct species expected on the basis of area loss (% of area lost) for the Carabidae
of Italian reserves
Figure 4. Number for areas
of extinct hypothetically
species expected hosting
on the10,basis
20, 40, of
60,area
80, and 100(%
loss species.
of area Curves were
lost) for the Carabidae
calculated using z = 0.212, as obtained from the power function of the species–area relationship. Use of
of Italian reserves for areas hypothetically hosting 10, 20, 40, 60, 80, and 100 species. Curves were
z-values from multiple models did not change the pattern. Note the log-scale for the y-axis.
calculated using z = 0.212, as obtained from the power function of the species–area relationship. Use
4. Discussion
of z-values from multiple models did not change the pattern. Note the log-scale for the y-axis.
The z-values of the power function SARs found in this study (z = 0.15–0.35) were perfectly in
the range typically found for isolates (z = 0.2–0.4; [11,12]). The c-values indicate that Carabidae had much
4. Discussion
more species per area unit than any other group. The second group with the highest number of species
per area unit is the Hydradephaga. Phytophagous and coprophagous Scarabaeoidea and Tenebrionidae
The z-values of the
have similar power
c-values, muchfunction
lower thanSARs
those forfound in this
Carabidae study (z = 0.15–0.35)
and Hydradephaga. were perfectly in th
It is an unexpected
range typically
result found for isolates
that predators have more (z species
= 0.2–0.4; [11,12]).
than dung The
feeders, c-values
herbivores, andindicate thatHowever,
detritivores. Carabidae had muc
it is known that c-values reflect species dispersal abilities, being larger for groups with higher
more species per area unit than any other group. The second group with the highest number
dispersal abilities [13]. Thus, it is possible that the high number of species per area unit in Carabidae
species perandarea unit is the
Hydradephaga Hydradephaga.
reflect Phytophagous
their higher dispersal abilities. Carabidsand coprophagous
are known Scarabaeoidea an
to have, in general,
Tenebrionidae have similar
high dispersal c-values,
capabilities, especiallymuch lower than
the macropterous formsthose
[87–89].for Carabidae
Similarly, and Hydradephaga. It
many Hydradephaga
are known to fly for long distances and move between waterbodies, which is essential for animals that
an unexpected result that predators have more species than dung feeders, herbivores, an
must survive in lentic waterbodies subject to seasonal drought [90]. By contrast, the small number
detritivores.
of However, it is per
tenebrionid species known that
area unit canc-values
be related reflect species
to the typically lowdispersal abilities,
dispersal power being larger f
of these
groups with higher
mainly dispersal
flightless abilities
beetles [91–93]. The [13]. Thus,
small value it is possible
of species richness perthat
areathe
unit high number of species p
of phytophagous
Scarabaeoidea can be interpreted as a result that some species are associated with some plants or forms
area unit in Carabidae and Hydradephaga reflect their higher dispersal abilities. Carabids are know
of vegetation, and hence high values of species richness can be found only in complex landscapes.
to have, in Coprophagous
general, high dispersaldepend
Scarabaeoidea capabilities, especially
on the presence of dung,the macropterous
which is in turn typicallyforms [87–89]. Similarl
associated
many Hydradephaga
with the presence areofknown to means
cattle; this fly forthat
long
largedistances
grazing areas and
aremove
neededbetween waterbodies,
to host a rich fauna. which
The importance of area for both coprophagous and phytophagous Scarabaeoidea is further shown by
essential for animals that must survive in lentic waterbodies subject to seasonal drought [90]. B
contrast, the small number of tenebrionid species per area unit can be related to the typically lo
dispersal power of these mainly flightless beetles [91–93]. The small value of species richness per areInsects 2020, 11, 646 11 of 18
the fact that this variable overwhelms the contribution of all other tested variables, being the only one
retained in the multimodel selection procedure.
For Hydradephaga and possibly Carabidae, in addition to area, an important contribution in
explaining species richness is given by the elevational range, which, however, exerts a negative
influence. Elevational range is usually considered as a measure of environmental heterogeneity,
because it is correlated with variation in temperature, precipitation, humidity, wind speed, evaporation,
and insolation, and altitude is often found to be an important variable in explaining species numbers
on islands, in some cases ranking only second to, or even ahead of, island area [73]. On the contrary,
in the present research, elevational range had a negative influence, albeit only in the case of
Hydradephaga and possibly Carabidae. This may be interpreted as a consequence of the fact
that, in a mainland context, a large elevational gradient implies that most of the study area is at
high altitudes. Since, in general, richness tends to decrease with elevation [94–96], the negative
influence of elevational range may be a reflection of this general trend. Moreover, in the specific case of
the Hydradephaga, the negative impact of the elevational range on species richness may be explained
by the fact that, with increasing elevation, lentic waters became rare. Elevation exerted a negative
influence also on Tenebrionidae, but, in this case, the variable retained in the multiple model was
minimum elevation. The negative impact of minimum elevation on species richness can be explained
by the fact that many tenebrionids are associated with coastal areas [97].
In accordance with the general impoverishment of species richness with increasing latitude
observed for many taxa in the northern hemisphere [79–83], latitude had a negative influence on
Tenebrionidae and coprophagous Scarabaeoidea. This can be explained with reference to both current
climatic factors and biogeographical history. Tenebrionidae are mainly thermophilic animals, including
many groups associated with hot and arid environments [27,97], and their species richness in Europe
tends to decrease northwards due to the joint effect of current climatic factors and post glaciation
incomplete recolonization [98–100]. In accordance with the general latitudinal pattern of biodiversity
in Europe, tenebrionid richness in Italy is known to increase southwards [16], in response to variations
in rainfall and temperatures, and in consequence of the refugial role played by Southern Italy during
the Pleistocene [101]. There is no previous study on the latitudinal gradient of dung beetles in Europe or
in Italy, but studies on dung beetle communities in Europe and North America [102–104] indicate that
northern communities have fewer species than the southern ones. The increase in dung beetle richness
with decreasing latitude in Italy can be explained by both historical reasons (i.e., the refugial role of
southern areas during Pleistocene glaciations) and current climate (for example, while Aphodiini are
able to colonize even cold areas, most Scarabaeinae are thermophilic animals) and land use (extensive
grazing in southern Italian regions).
Extinction rates as predicted by the SAR are highest for dung beetles, which is consistent
with their dependence on dung, which, in turn, is mainly associated with the presence of large
grazing areas. Actually, dung beetles were the insect group which experienced the highest documented
extinction rate in the city of Rome as a consequence of the loss of grazing lands due to urbanization [105].
The second most sensitive group was the Tenebrionidae, probably due to their low dispersal capabilities,
which reduce their possibility of colonizing new areas when environmental conditions become less
favorable. A previous study focused on these insects revealed that the geophilous tenebrionids,
which are typically flightless, have higher extinction rates than the xylophilous ones [16]. Moreover,
Tenebrionidae include many saproxylic beetles, which are particularly sensitive to the loss of forest
vegetation [106,107]. The comparatively low extinction rates predicted for Carabidae, phytophagous
Scarabaeoidea and Hydradephaga can be explained by their higher dispersal power, which reduces
habitat confinement and hence makes them less sensitive to area loss, despite their dependence
on other animals as food (Carabidae), plants (phytophagous Scarabaeoidea), or specific biotopes
(lentic water for Hydradephaga). If other variables besides area are considered in multiple models,
however, the extinction rates expected by area loss became more similar among groups, suggesting
that differences in extinction rates are largely due to the influence of other factors than area. IncludingInsects 2020, 11, 646 12 of 18
the effect of latitude in multiple models reduces the expected extinction rates for Tenebrionidae
and coprophagous Scarabaeoidea, which highlights a prominent role of the southern areas for their
conservation in Italy. In other words, for these beetles, area loss is expected to act more dramatically
in southern areas. By contrast, for Carabidae and Hydradephaga, the inclusion of elevational range
increased the extinction risk, which suggests that lowland areas are those that most contribute to
the conservation of these beetles. Finally, the extinction rates expected by area loss are always relatively
low. Thus, in small areas hosting relatively few species, a very small number of species will be
lost, even if they represent a large proportion of the considered fauna. This means that, because of
difficulties in obtaining complete species lists and in monitoring all species, in small reserves, with few
species, the number of possible extinctions might be too small to be detected, and extinctions might
remain unnoticed.
5. Conclusions
Reserve area was an important predictor of species richness in all investigated beetle groups,
which is consistent with the almost ubiquitous pattern known as the species–area relationship
(SAR). For Carabidae, Hydradephaga, and Tenebrionidae, elevation exerted a negative influence—a
possible reflection of the general decline in species richness with altitude commonly observed in
many taxa. In accordance with the general impoverishment of species richness northwards, latitude
had a negative influence on coprophagous Scarabaeoidea and Tenebrionidae, as a result of current
and past biogeographical factors (that is, more favorable climatic conditions in southern areas and their
role as Pleistocene refuges). SAR-based extinction rates are highest for dung beetles, consistently
with their dependence on large grazing areas, and for Tenebrionidae, because of their low dispersal
capabilities. The relatively lower extinction rates predicted for Carabidae, phytophagous Scarabaeoidea,
and Hydradephaga can be explained by their higher dispersal power. Thus, both ecological needs
and dispersal abilities emerge as important determinants of SAR-based extinction rates. If other
variables besides area are considered, extinction rates become more similar among groups. Because of
the overall low extinction rates, extinctions might be too few to be easily detected in reserves with
few species. This should be carefully considered when comparing SAR-based extinction rates with
empirical data.
Supplementary Materials: The following are available online at http://www.mdpi.com/2075-4450/11/9/646/s1,
Figure S1: number of extinct species expected on the basis of area loss (% of area lost) for various groups of beetles
in Italian reserves for areas hosting 10, 20, 40, 60, 80, and 100 species. Curves were calculated using z-values
obtained from the power function of the species–area relationship and from multiple models. Note the log-scale
for the y-axis. (a) and (b) Carabidae; (c) and (d) Hydradephaga; (e) and (f) coprophagous Scarabaeoidea;
(g) phytophagous Scarabaeoidea; (h) total Scarabaeoidea; (i) and (j) Tenebrionidae. Panels (a), (c), (e), (g), (h),
and (i) refer to z-values obtained from the power function. Panels (b), (d), (f), and (j) refer to z-values obtained
from multiple models.
Funding: This research was partially funded by the University of L’Aquila, Department of Life, Health
and Environmental Sciences, FFO 2020, “Analisi multi-taxa della struttura di comunità animali, vegetali e
microbiche in alta quota”.
Acknowledgments: Thanks are due to C. Mantoni for her assistance in preparing Figure 1, to L. Di Biase for
her assistance with references, and to three anonymous reviewers for their comments on a previous version of
this paper.
Conflicts of Interest: The author declares no conflict of interest. The funder had no role in the design of the study;
in the collection, analyses, or interpretation of data; in the writing of the manuscript, or in the decision to publish
the results.
References
1. Matthews, T.; Triantis, K.; Whittaker, R. (Eds.) The Species-Area Relationship: Theory and Application (Ecology,
Biodiversity and Conservation); Cambridge University Press: Cambridge, UK, 2020; pp. 1–481.
2. Fattorini, S. Detecting biodiversity hotspots by species-area relationships: A case study of Mediterranean
beetles. Conserv. Biol. 2006, 20, 1169–1180. [CrossRef] [PubMed]Insects 2020, 11, 646 13 of 18
3. Mazel, F.; Guilhaumon, F.; Mouquet, N.; Dvictor, V.; Gravel, D.; Renaud, J.; Cianciaruso, M.V.; Loyola, R.;
Diniz-Filho, J.A.F.; Mouillot, D.; et al. Global hotspots of multifaceted mammal diversity. Glob. Ecol. Biogeogr.
2014, 23, 836–847. [CrossRef] [PubMed]
4. Fattorini, S. The Identification of Biodiversity Hotspots Using the Species–Area Relationship.
In The Species-Area Relationship: Theory and Application (Ecology, Biodiversity and Conservation); Matthews, T.,
Triantis, K., Whittaker, R., Eds.; Cambridge University Press: Cambridge, UK, 2020; pp. 321–344.
5. Desmet, P.; Cowling, R. Using the species–area relationship to set baseline targets for conservation. Ecol. Soc.
2004, 9, 11. [CrossRef]
6. Fattorini, S. The use of cumulative area curves in biological conservation: A cautionary note. Acta Oecol.
2010, 36, 255–258. [CrossRef]
7. Fattorini, S. Urban biodiversity hotspots are not related to the structure of green spaces: A case study of
tenebrionid beetles from Rome, Italy. Urban Ecosyst. 2014, 17, 1033–1045. [CrossRef]
8. Cox, R.L.; Underwood, E.C. The importance of conserving biodiversity outside of protected areas in
Mediterranean ecosystems. PLoS ONE 2011, 6, e14508. [CrossRef] [PubMed]
9. Fattorini, S.; Borges, P.V.A. Species–area relationships underestimate extinction rates. Acta Oecol. 2012, 40,
27–30. [CrossRef]
10. Fattorini, S.; Matthews, T.; Ulrich, W. Using the Species–Area Relationship to Predict Extinctions
Resulting from Habitat Loss. In The Species-Area Relationship: Theory and Application (Ecology, Biodiversity
and Conservation); Matthews, T., Triantis, K., Whittaker, R., Eds.; Cambridge University Press: Cambridge,
UK, 2020; pp. 345–367.
11. Triantis, K.A.; Guilhaumon, F.; Whittaker, R.J. The island species–area relationship: Biology and statistics.
J. Biogeogr. 2012, 39, 215–231. [CrossRef]
12. Matthews, T.J.; Guilhaumon, F.; Triantis, K.A.; Borregaard, M.K.; Whittaker, R.J. On the form of species–area
relationships in habitat islands and true islands. Glob. Ecol. Biogeogr. 2016, 25, 847–858. [CrossRef]
13. Fattorini, S.; Borges, P.V.A.; Dapporto, L.; Strona, G. What can the parameters of the species–area relationship
(SAR) tell us? Insights from Mediterranean islands. J. Biogeogr. 2017, 44, 1018–1028. [CrossRef]
14. Báldi, A.; Vörös, J. Extinction debt of Hungarian reserves: A historical perspective. Basic Appl. Ecol. 2006, 7,
289–295. [CrossRef]
15. Benedick, S.; Hill, J.K.; Mustaffa, N.; Chey, V.K.; Maryati, M.; Searle, J.B.; Schilthuizen, M.; Hamer, K.C. Impacts
of rain forest fragmentation on butterflies in northern Borneo: Species richness, turnover and the value of
small fragments. J. Appl. Ecol. 2006, 43, 967–977. [CrossRef]
16. Fattorini, S. Conservation Biogeography of Tenebrionid Beetles: Insights from Italian Reserves. Diversity
2020, 12, 348. [CrossRef]
17. Médail, F.; Quézel, P. Biodiversity Hotspots in the Mediterranean Basin: Setting Global Conservation
Priorities. Conserv. Biol. 1999, 13, 1510–1513. [CrossRef]
18. Myers, N.; Mittermeier, R.A.; Mittermeier, C.G.; da Fonseca, G.A.B.; Kent, J. Biodiversity hotspots for
conservation priorities. Nature 2000, 403, 853–858. [CrossRef]
19. Ruffo, S.; Stoch, F. (Eds.) Checklist and Distribution of the Italian Fauna. 10,000 Terrestrial and Inland Water
Species. 2 Serie, Sez. Scienze Della Vita; Memorie del Museo Civico di Storia Naturale di Verona: Verona, Italy,
2006; Volume 17, pp. 1–303.
20. Blasi, C.; Biondi, E. La flora in Italia; Ministero dell’Ambiente e della Tutela del Territorio e del Mare, Sapienza
Università Editrice: Rome, Italy, 2017; pp. 1–704.
21. Blondel, J.; Aronson, J. Biology and Wildlife of the Mediterranean Region; Oxford University Press: Oxford, UK,
1999; pp. 1–328.
22. Underwood, E.C.; Viers, J.H.; Klausmeyer, K.R.; Cox, R.L.; Shaw, M.R. Threats and biodiversity in
the mediterranean biome. Divers. Distrib. 2009, 15, 188–197. [CrossRef]
23. Ministero Dell’ambiente e Della Tutela del Territorio e del Mare. VI Elenco Ufficiale delle Aree Protette (EUAP).
Supplemento Ordinario alla “Gazzetta Ufficiale” No. 125 31/05/2010–Serie Generale; Ministero dell’Ambiente e
della Tutela del Territorio e del Mare: Roma, Italy, 2010.
24. Blasi, C.; Boitani, L.; La Posta, S.; Manes, F.; Marchetti, M. Stato della Biodiversità in Italia; Palombi Editori:
Roma, Italy, 2005; pp. 1–468.Insects 2020, 11, 646 14 of 18
25. Hunt, T.; Bergsten, J.; Levkanicova, Z.; Papadopoulou, A.; St. John, O.; Wild, R.; Hammond, P.M.; Ahrens, D.;
Balke, M.; Caterino, M.S.; et al. A comprehensive phylogeny of beetles reveals the evolutionary origins of a
superradiation. Science 2007, 318, 1913–1916. [CrossRef]
26. Powell, J.; Coleoptera, A. Encyclopedia of Insects, 2nd ed.; Resh, H.V., Cardé, T.R., Eds.; Academic Press:
New York, NY, USA, 2009; p. 199.
27. Dajoz, R. Les Coléoptères Carabides et Ténébrionidés; Lavoisier: Paris, France, 2002; pp. 1–522.
28. Rocchi, S. Insecta Coleoptera Hydradephaga. In Checklist and Distribution of the Italian Fauna. 10,000 Terrestrial
and Inland Water Species. 2 Serie, Sez. Scienze Della Vita; Ruffo, S., Stoch, F., Eds.; Memorie del Museo Civico di
Storia Naturale di Verona: Verona, Italy, 2006; Volume 17, pp. 165–166.
29. Baca, S.M.; Alexander, A.; Gustafson, G.T.; Short, A.E.Z. Ultraconserved elements show utility in phylogenetic
inference of Adephaga (Coleoptera) and suggest paraphyly of ‘Hydradephaga’. Syst. Entomol. 2017, 42,
786–795. [CrossRef]
30. Carpaneto, G.M.; Piattella, E.; Valerio, L. Insecta Coleoptera Scarabaeoidea. In Checklist and Distribution
of the Italian Fauna. 10,000 Terrestrial and Inland Water Species. 2 Serie, Sez. Scienze Della Vita; Ruffo, S.,
Stoch, F., Eds.; Memorie del Museo Civico di Storia Naturale di Verona: Verona, Italy, 2006; Volume 17,
pp. 193–196.
31. Fattorini, S.; Mantoni, C.; Audisio, P.; Biondi, M. Taxonomic variation in levels of endemism: A case study of
Italian tenebrionid beetles. Insect Conserv. Divers. 2019, 12, 351–361. [CrossRef]
32. Angelini, F. Contribution to the knowledge of beetles (Insecta Coleoptera) of some protected areas of Apulia,
Basilicata and Calabria (Italy). Biodivers. J. 2020, 11, 85–254. [CrossRef]
33. Crucitti, P.; Brocchieri, D.; Bubbico, F.; Castelluccio, P.; Cervoni, F.; Di Russo, E.; Emiliani, F.; Giardini, M.;
Pulvirenti, E. Checklist di alcuni gruppi selezionati dell’entomofauna del Parco Naturale Archeologico
dell’Inviolata (Guidonia Montecelio, Roma): XlI contributo allo studio della biodiversità della Campagna
Romana a nord-est di Roma. Boll. Soc. Ent. Ital. 2019, 151, 65–92. [CrossRef]
34. Fattorini, S.; Vigna Taglianti, A. Use of taxonomic and chorological diversity to highlight the conservation
value of insect communities in a Mediterranean coastal area: The carabid beetles (Coleoptera, Carabidae) of
Castelporziano (Central Italy). Rend. Lincei Sci. Fis. 2015, 26, 625–641. [CrossRef]
35. Furlanetto, D. Atlante della Biodiversità nel Parco Ticino—Edizione 2002. Elenchi Sistematici (Monografie);
Consorzio Parco Lombardo della Valle del Ticino: Milan, Italy, 2002; p. 406.
36. Lestes–Associazione di Ricerca e Studio nelle Scienze Naturali (2004) Relazione Finale della Ricerca
Sui Coleotteri Carabidi del Parco Nazionale delle Foreste Casentinesi, Monte Falterona e Campigna.
Available online: https://www.parcoforestecasentinesi.it/sites/default/files/images/cartella_ricerca/carabidi.
pdf (accessed on 20 June 2020).
37. Lucarelli, E.; Chelazzi, L.; Colombini, I.; Fallaci, M.; Mascagni, A. La coleotterofauna del tombolo antistante
la laguna di Burano (GR): Lista e zonazioni delle specie raccolte durante un intero anno di campionamenti.
Boll. Assoc. Romana Entomol. 1993, 47, 7–34.
38. Vigna Taglianti, A. Coleotteri Carabidi del Parco Nazionale d’Abruzzo (Coleoptera Adephaga, Carabidae).
In Progetto Biodiversità, Liste Preliminari Degli Organismi viventi del Parco Nazionale d’Abruzzo; Tassi, F., Ed.;
Ente Autonomo Parco Nazionale d’Abruzzo: Roma, Italy, 1995; Volume 1, p. 32.
39. Vigna Taglianti, A. Coleoptera Carabidae (Insecta). In Ricerche sulla Valle Peligna (Italia Centrale, Abruzzo).
Quaderni di Provincia oggi, 23/II; Osella, B.G., Biondi, M., Di Marco, C., Riti, M., Eds.; Amministrazione
Provinciale de L’Aquila: L’Aquila, Italy, 1997; Volume 2, pp. 301–334.
40. Vigna Taglianti, A. Carabidae (Coleoptera). In Invertebrati di una foresta della Pianura Padana, Bosco della
Fontana, Secondo Contributo, Conservazione Habitat Invertebrati; Cerretti, P., Hardersen, S., Mason, F., Nardi, G.,
Tisato, M., Zapparoli, M., Eds.; Cierre Grafica Editore: Verona, Italy, 2004; Volume 3, pp. 51–63.
41. Vigna Taglianti, A. I Coleotteri Carabidi (Coleoptera: Carabidae). In Artropodi del Parco Nazionale del Vesuvio:
Ricerche preliminari. Conservazione Habitat Invertebrati; Nardi, G., Vomero, V., Eds.; Cierre edizioni: Verona,
Italy, 2007; Volume 4, pp. 99–112.
42. Vigna Taglianti, A. I Carabidi delle Riserve Naturali “Agoraie di Sopra e Moggetto” (Liguria, Genova) e
“Guadine Pradaccio” (Emilia–Romagna, Parma) (Coleoptera, Carabidae). Boll. Assoc. Romana Entomol. 2009,
64, 99–127.
43. Vigna Taglianti, A.; Audisio, P.; De Felici, S. I Coleotteri Carabidi del Parco Nazionale della Val Grande
(Verbania, Piemonte). Rivista Piemontese di Storia Naturale 1999, 19, 193–245.Insects 2020, 11, 646 15 of 18
44. Vigna Taglianti, A.; Bonavita, P.; Di Giulio, A.; Todini, A.; Maltzeff, P. I Carabidi della Tenuta Presidenziale di
Castelporziano (Coleoptera, Carabidae). Boll. Assoc. Romana Entomol. 2001, 56, 115–173.
45. Vigna Taglianti, A.; Bonavita, P.; Maltzeff, P. I Carabidi della Tenuta Presidenziale di Castelporziano. Addenda
(Coleoptera, Carabidae). Boll. Assoc. Romana Entomol. 2007, 62, 101–103.
46. Nardi, G. Adephagous water beetles: Faunistics, ecology and conservation (Coleoptera, Gyrinidae, Haliplidae,
Noteridae, Dytiscidae). In Invertebrati di una Foresta della Pianura Padana, Bosco della Fontana, Secondo Contributo,
Conservazione Habitat Invertebrati; Cerretti, P., Hardersen, S., Mason, F., Nardi, G., Tisato, M., Zapparoli, M.,
Eds.; Cierre Grafica Editore: Verona, Italy, 2004; Volume 3, pp. 65–115.
47. Nardi, G. Dati preliminari sui coleotteri idroadefagi del Parco Nazionale del Circeo. In Habitat, Flora e Fauna
del Parco Nazionale del Circeo; Zerunian, S., Ed.; Uff. Gestione Beni ex ASFD di Sabaudia–Parco Nazionale del
Circeo: Latina, Italy, 2005; pp. 151–178.
48. Nardi, G.; Maltzeff, P. Gli Idroadefagi della Tenuta Presidenziale di Castelporziano (Coleoptera, Gyrinidae,
Haliplidae, Noiteridae, Hygrobiidae, Dytiscidae). Boll. Assoc. Romana Entomol. 2001, 56, 175–232.
49. Nardi, G.; Cornacchia, P.; Canepari, C.; Colonnelli, E.; Liberti, G.; Mascagni, A.; Piattella, E.; Rocchi, S.; Zoia, S.
Note sui Coleotteri delle Riserve Naturali “Agoraie di Sopra e Moggetto” (Liguria, Genova) e “Guadine
Pradaccio” (Emilia-Romagna, Parma). (Coleoptera). Boll. Assoc. Romana Entomol. 2009, 64, 183–280.
50. Rocchi, S.; Mascagni, A. Coleotterofauna acquatica e semiacquatica del Parco Nazionale delle Foreste
Casentinesi, Monte Falterona e Campigna (Insecta Coleoptera Hydradephaga, Hydraenidae, Hydrophiloidea,
Dryopoidea). Quaderno di Studi e Notizie di Storia Naturale della Romagna Cesena 2005, 21, 1–32.
51. Carpaneto, G.M.; Migliaccio, E.; Piattella, E. Coleotteri Lamellicorni del Parco Nazionale d’Abruzzo.
In Progetto Biodiversità, Liste Preliminari Degli Organismi Viventi del Parco Nazionale d’Abruzzo; Tassi, F., Ed.;
Ente Autonomo Parco Nazionale d’Abruzzo: Roma, Italy, 1996; Volume 1, p. 29.
52. Carpaneto, G.M.; Maltzeff, P.; Piattella, E.; Pontuale, G. I Coleotteri lamellicorni della tenuta presidenziale di
Casteporziano e delle aree limitrofe (Coleoptera, Lamellicornia). Boll. Assoc. Romana Entomol. 1998, 52, 9–54.
53. Carpaneto, G.M.; Maltzeff, P.; Piattella, E.; Facchinelli, L. Nuovi reperti di Coleotteri Lamellicorni della
Tenuta Presidenziale di Castelporziano e delle aree limitrofe (Coleoptera, Lamellicornia). Boll. Assoc. Romana
Entomol. 2001, 56, 311–329.
54. Hardersen, S.; Toni, I.; Cornacchia, P.; Curletti, G.; Leo, P.; Nardi, G.; Penati, F.; Piattella, E.; Platia, G. Survey
of selected beetle families in a floodplain remnant in northern Italy. Bull. Insectol. 2012, 65, 199–207.
55. Lapiana, F.; Sparacio, I. I Coleotteri Lamellicorni delle Madonie (Sicilia) (Insecta Coleoptera Lucanoidea et
Scarabaeoidea). Nat. Sicil. 2006, 30, 227–292.
56. Marotta, O.; Andreetti, A.; Osella, G. Coleoptera Lucanoidea & Scarabaeoidea. In Ricerche sulla Valle Peligna
(Italia Centrale, Abruzzo). Quaderni di Provincia Oggi, 23/II; Osella, B.G., Biondi, M., Di Marco, C., Riti, M., Eds.;
Amministrazione Provinciale de L’Aquila: L’Aquila, Italy, 1997; pp. 363–377.
57. Piattella, E. Coleoptera, Scarabaeoidea (Aphodiidae, Cetoniidae, Melolonthidae, Scarabaeidae). In Invertebrati
di una Foresta della Pianura Padana, Bosco della Fontana, Secondo Contributo, Conservazione Habitat Invertebrati;
Cerretti, P., Hardersen, S., Mason, F., Nardi, G., Tisato, M., Zapparoli, M., Eds.; Cierre Grafica Editore: Verona,
Italy, 2004; Volume 3, pp. 278–280.
58. Piattella, E. I Coleotteri Lamellicorni del Parco e considerazioni sul popolamento dell’area partenopea
(Coleoptera: Lucanidae, Aphodiidae, Orphnidae, Scarabaeidae, Melolonthidae, Rutelidae e Cetoniidae).
In Artropodi del Parco Nazionale del Vesuvio: Ricerche preliminari. Conservazione Habitat Invertebrati; Nardi, G.,
Vomero, V., Eds.; Cierre Edizioni: Verona, Italy, 2007; Volume 4, pp. 147–163.
59. Piattella, E. Contribution to the knowledge of scarab beetles of Vincheto di Celarda Nature Reserve (Coleoptera:
Scarabaeoidea). In Research on the Natural Heritage of the Reserves Vincheto di Celarda and Val Tovanella (Belluno
Province, Italy). Conservation of Two Protected Areas in the Context of a Life Project. Quaderni Conservazione Habitat
Invertebrati; Handersen, S., Mason, F., Viola, F., Campedel, D., Lasen, C., Cassol, M., Eds.; Arti grafiche Fiorini:
Verona, Italy, 2009; Volume 5, pp. 117–124.
60. Aliquò, V.; Leo, P. I Coleotteri Tenebrionidi delle Madonie (Sicilia). Nat. Sicil. 1996, 4, 281–304.
61. Andreetti, A.; Di Gaetano, B.; Di Marco, C.; Osella, G.; Riti, M. Coleoptera Tenebrionidae (Insecta). In Ricerche
sulla Valle Peligna (Italia Centrale, Abruzzo). Quaderni di Provincia oggi, 23/II; Osella, B.G., Biondi, M., Di Marco, C.,
Riti, M., Eds.; Amministrazione provinciale de L’Aquila: L’Aquila, Italy, 1997; Volume 2, pp. 425–443.
62. Cavanna, C. Parte II. Catalogo dogli animali raccolti al Vulture, al Pollino ed in altri luoghi dell’Italia
meridionale e centrale. Boll. Soc. Ent. Ital. 1882, 14, 31–87.Insects 2020, 11, 646 16 of 18
63. Chelazzi, L.; DeMatthaeis, E.; Colombini, I.; Fallaci, M.; Bandini, V.; Tozzi, C. Abundance, zonation
and ecological indices of a coleopteran community from a sandy beach-dune ecosystem of the southern
Adriatic coast, Italy. Vie Milieu 2005, 55, 127–141.
64. Fattorini, S. The Tenebrionidae (Coleoptera) of a Tyrrhenian coastal area: Diversity and zoogeographical
composition. Biogeographia 2002, 23, 103–126. [CrossRef]
65. Fattorini, S. I Coleotteri Tenebrionidi del Parco Nazionale del Circeo (Italia Centrale) (Coleoptera,
Tenebrionidae). Boll. Assoc. Romana Entomol. 2005, 60, 47–104.
66. Fattorini, S. The tenebrionid beetles of Mt Vesuvius: Species assemblages and biogeographic kinetics on an
active volcano (Coleoptera Tenebrionidae). In Artropodi del Parco Nazionale del Vesuvio: Ricerche Preliminari.
Conservazione Habitat Invertebrati; Nardi, G., Vomero, V., Eds.; Cierre Edizioni: Verona, Italy, 2007; Volume 4,
pp. 221–243.
67. Fattorini, S.; Maltzeff, P.; Salvati, L. Use of insect distribution across landscape-soil units to assess conservation
priorities in a Mediterranean coastal reserve: The tenebrionid beetles of Castelporziano (Central Italy).
Rend. Lincei-Sci. Fis. 2015, 26, 353–366. [CrossRef]
68. Fattorini, S.; Romiti, F.; Carpaneto, G.M.; Poeta, G.; Bergamaschi, D. I Coleotteri Tenebrionidi del Sito
d’Importanza Comunitaria “Foce Saccione—Bonifica Ramitelli” (Molise) (Coleoptera Tenebrionidae). Boll. Soc.
Ent. Ital. 2016, 148, 57–62. [CrossRef]
69. Gatti, E. Ricerche sull’entomofauna della Riserva Naturale Vincheto di Celarda–(BL) Collana Verde, 86; Ministero
dell’Agricoltura e delle Foreste: Rome, Italy, 1991; p. 200.
70. Scupola, A. Tenebrionidae. In Invertebrati di una Foresta della Pianura Padana. Bosco della Fontana. Centro
Nazionale per lo Studio e la Conservazione della Biodiversià Forestale Bosco della Fontana; Mason, F., Cerretti, P.,
Tagliapietra, A., Speight, M.C.D., Zapparoli, M., Eds.; Gianluigi Arcari Editore: Mantova, Italy, 2002; p. 93.
71. Scupola, A. Coleoptera, Tenebrionidae (excluding Alleculinae, Lagriinae). In Invertebrati di una Foresta
della Pianura Padana, Bosco della Fontana, Secondo Contributo, Conservazione Habitat Invertebrati; Cerretti, P.,
Hardersen, S., Mason, F., Nardi, G., Tisato, M., Zapparoli, M., Eds.; Cierre Grafica Editore: Verona, Italy, 2004;
Volume 3, p. 285.
72. Connor, E.F.; McCoy, E.D. The statistics and biology of the species–area relationship. Am. Nat. 1979, 113,
791–833. [CrossRef]
73. Fattorini, S.; Dapporto, L.; Strona, G.; Borges, P.V.A. Calling for a new strategy to measure environmental
(habitat) diversity in Island Biogeography: A case study of Mediterranean tenebrionids (Coleoptera:
Tenebrionidae). Fragm. Entomol. 2015, 47, 1–14. [CrossRef]
74. Spada, L.; Bardiani, M.; Nardi, G. Artropodi delle Riserve Naturali “Agoraie di Sopra e Moggetto” (Liguria,
Genova) e “Guadine Pradaccio” (Emilia-Romagna, Parma). Introduzione. Boll. Assoc. Romana Entomol. 2009,
64, 3–32.
75. Angelini, F. Coleotterofauna del Promontorio del Gargano (Coleoptera). Atti Mus. Civ. Stor. Nat. Grosseto
1987, 11/12, 5–84.
76. Nardi, G.; Vomero, V. Introduzione. In Artropodi del Parco Nazionale del Vesuvio: Ricerche preliminari.
Conservazione Habitat Invertebrati; Nardi, G., Vomero, V., Eds.; Cierre edizioni: Verona, Italy, 2007; pp. 15–28.
77. Angelini, F. Coleotterofauna del Massiccio del Pollino (Basilicata-Calabria) (Coleoptera). Entomologica 1986,
21, 37–125.
78. Angelini, F. Coleotterofauna dell’Altipiano della Sila (Calabria, Italia) (Coleoptera). Mem. Soc. Entomol. Ital.
1991, 70, 171–254.
79. Ashton, K.G. Are ecological and evolutionary rules being dismissed prematurely? Divers. Distrib. 2001, 7,
289–295. [CrossRef]
80. Fattorini, S. Testing the latitudinal gradient: A narrow-scale analysis of tenebrionid richness (Coleoptera,
Tenebrionidae) in the Aegean archipelago (Greece). Ital. J. Zool. 2006, 73, 203–211. [CrossRef]
81. Whittaker, R.J.; Nogues-Bravo, D.; Araujo, M.B. Geographical gradients of species richness: A test of the water
energy conjecture of Hawkins et al. (2003) using European data for five taxa. Global Ecol. Biogeogr. 2007, 16,
76–89. [CrossRef]
82. Baselga, A. Determinants of species richness, endemism and turnover in European longhorn beetles.
Ecography 2008, 31, 263–271. [CrossRef]
83. Schuldt, A.; Assmann, T. Environmental and historical effects on richness and endemism patterns of carabid
beetles in the western Palaearctic. Ecography 2009, 32, 705–714. [CrossRef]You can also read