Optimization of Reactor Temperature for Continuous Anaerobic Digestion of Cow Manure: Bangladesh Perspective - NTNU Open
←
→
Page content transcription
If your browser does not render page correctly, please read the page content below
sustainability

Article
Optimization of Reactor Temperature for Continuous
Anaerobic Digestion of Cow Manure:
Bangladesh Perspective
Rajesh Nandi 1 , Chayan Kumer Saha 1, * , Shiplu Sarker 2 , Md. Sanaul Huda 1 and
Md. Monjurul Alam 1
 1    Department of Farm Power and Machinery, Bangladesh Agricultural University,
      Mymensingh 2202, Bangladesh; rajesh@bau.edu.bd (R.N.); saanul.ndc1106069@gmail.com (M.S.H.);
      mmalam.bau@gmail.com (M.M.A.)
 2    Department of Manufacturing and Civil Engineering, Norwegian University of Science and Technology,
      2815 Gjøvik, Norway; shiplu.sarker@ntnu.no
 *    Correspondence: cksaha@bau.edu.bd

 Received: 28 September 2020; Accepted: 20 October 2020; Published: 22 October 2020

 Abstract: Converting organic waste into energy through anaerobic digestion is gaining popularity
 day by day. The reactor temperature is considered as one of the most vital factors for the digestion
 process. An experiment was conducted in the Biogas Laboratory of Green Energy Knowledge Hub at
 Bangladesh Agricultural University (BAU) to examine the influence of temperature on anaerobic
 digestion of cow-dung. Laboratory-scale continuous stirred tank reactors with a working volume of
 15 L were operated for a 30-day retention time. The reactors were set at 20 ◦ C, 25 ◦ C, 30 ◦ C, 35 ◦ C, 40 ◦ C
 and 45 ◦ C, respectively to determine the effect of temperature on anaerobic digestion performance.
 Different parameters like total solids, volatile solids, pH, volatile fatty acids, ammonia nitrogen, total
 nitrogen, biogas production rate and methane concentration were examined. Among all the reactors,
 the reactor at 40 ◦ C temperature produced maximum biogas (312.43 L/kg VS) and methane yields
 (209.70 L/kg VS), followed by the reactors at 35 ◦ C and 30 ◦ C, respectively. Statistical analysis of the
 obtained experimental results using Minitab® (State College, PA, USA) showed that the optimum
 process performance in terms of methane yield and volatile solid degradation is achieved at a reactor
 temperature of 35.82 ◦ C.

 Keywords: anaerobic digestion; cow-dung; temperature; biogas production; optimization

1. Introduction
      Global energy demand is increasing greatly due to a higher population growth rate and rapid
industrialization [1–3]. Current energy demand is mostly met by non-renewable energy sources.
With the overuse of these limited non-renewable energy sources, the world is now facing an energy
crisis. Non-renewable energy sources are also responsible for greenhouse gas (GHG) emissions. It is
thus necessary to search for new sustainable as well as renewable energy sources to meet future
energy demand.
      Bangladesh is a country of around 162 million people with ~1.1% growth of population annually.
Per capita energy generation in Bangladesh is 426 kWh [4], which perhaps is very low. Currently, the
country has a power generation capacity of ~20,000 MWe, only 1.37% of which comes from renewable
sources [5]. It is estimated that the country would require circa 34,000 MWe by the year 2030 to fulfil its
demand [6]. Around 58% of the country’s electricity comes from natural gas [5]. Energy consumption
in Bangladesh mostly depends on imported fossil fuels and the country has limited proven natural gas
reserves. Moreover, fuel prices are increasing swiftly and gas reserves are declining at an increasing

Sustainability 2020, 12, 8772; doi:10.3390/su12218772                        www.mdpi.com/journal/sustainability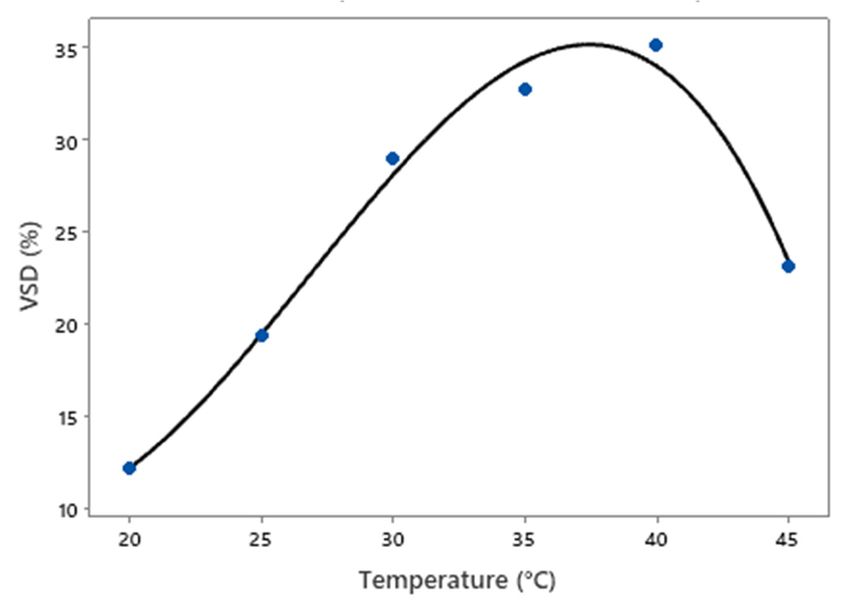
Sustainability 2020, 12, 8772                                                                      2 of 19

rate. Bangladesh has been looking for alternative energy sources. The government of Bangladesh
has planned to generate 10% of its total power generation from renewable energy sources by 2020 [7].
Biogas is a prospective alternative source of energy in Bangladesh. According to the Bangladesh
Bureau of Statistics (BBS), the cattle population of the country is around 24 million [8], which produce
around 240 million kg of cow-dung daily.
      The anaerobic digestion (AD) of the organic materials by microorganisms at anoxic environment
produces biogas. Biogas contains 48–65% (v/v) methane and 36–41% (v/v) CO2 ,
Sustainability 2020, 12, 8772 3 of 19
temperature
Sustainability in12,
2020, order toPEER
x FOR maximize
REVIEWmethane yield and volatile solid degradation efficiency by using
3 of 19a
best-fit regression model in Minitab® .
2. Materials and Methods
2. Materials and Methods
2.1. Experimental Site
2.1. Experimental Site
The experiment was conducted at the Biogas Laboratory of GEKH (Green Energy Knowledge
The experiment was conducted at the Biogas Laboratory of GEKH (Green Energy Knowledge
Hub), Department of Farm Power & Machinery, Bangladesh Agricultural University, Mymensingh.
Hub), Department of Farm Power & Machinery, Bangladesh Agricultural University, Mymensingh.
Cow manure was used as a substrate in this experiment. Raw cow-dung was collected from the dairy
Cow manure was used as a substrate in this experiment. Raw cow-dung was collected from the dairy
farm of Bangladesh Agricultural University. After collection, the substrate was stored between −5
farm of Bangladesh Agricultural University. After collection, the substrate was stored between −5 and
and −10 °C in a freezer. Prior to AD, the cow-dung was defrosted to a normal room temperature.
−10 ◦ C in a freezer. Prior to AD, the cow-dung was defrosted to a normal room temperature.
2.2. Experimental Setup
2.2. Experimental Setup
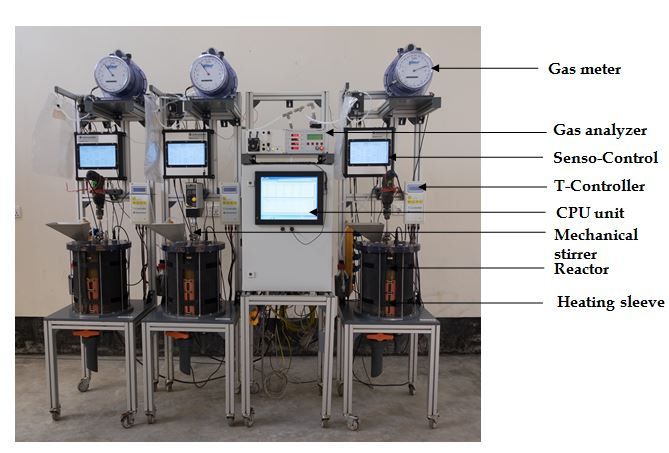
For the experiment, a test rig was set-up with 3 identical CSTR (BTP2-control, UIT, Dresden,
For the experiment, a test rig was set-up with 3 identical CSTR (BTP2-control, UIT, Dresden,
Germany) units (Figure 1) and a central control unit. Each of the CSTR units was equipped with a
Germany) units (Figure 1) and a central control unit. Each of the CSTR units was equipped with a CSTR
CSTR reactor, a gas drum (TG 05; 0.5 L per turn of the hand, Measurement range: 1–60 L, reading
reactor, a gas drum (TG 05; 0.5 L per turn of the hand, Measurement range: 1–60 L, reading accuracy
accuracy 0.002 L, measurement accuracy: ±0.2%), a polyvinyl fluoride gas bag (10 L), a heating control
0.002 L, measurement accuracy: ±0.2%), a polyvinyl fluoride gas bag (10 L), a heating control unit and
unit and an agitator system composed of a propeller shaped stirrer coupled with an agitator shaft
an agitator system composed of a propeller shaped stirrer coupled with an agitator shaft and an electric
and an electric stirrer motor (10–500 rpm). The three reactor units were each connected with a
stirrer motor (10–500 rpm). The three reactor units were each connected with a separate SENSO control
separate SENSO control module, serving operational parameters control, agitator shaft’s height
module, serving operational parameters control, agitator shaft’s height control and data acquisition
control and data acquisition and their record. The reactor tank consisted of a glass tube, which was
and their record. The reactor tank consisted of a glass tube, which was fixed at the bottom on a raised
fixed at the bottom on a raised steel platform that was joined with flanges at the top through flat seal
steel platform that was joined with flanges at the top through flat seal rods. The capacity of each reactor
rods. The capacity of each reactor was 17.2 L with working volume of 15 L. The heating element of
was 17.2 L with working volume of 15 L. The heating element of the CSTR consisted of a heating mat
the CSTR consisted of a heating mat which was attached to the outside surface of the glass tube. The
which was attached to the outside surface of the glass tube. The heating mat was controlled by a
heating mat was controlled by a built-in temperature controller (T-controller, temperature
built-in temperature controller (T-controller, temperature consistency: ± 0.1 ◦ C), which simultaneously
consistency: ± 0.1 °C), which simultaneously measures the temperatures of the heating mat, substrate
measures the temperatures of the heating mat, substrate and biogas. The signals generated in the
and biogas. The signals generated in the temperature controller were transferred through RS-485
temperature controller were transferred through RS-485 interface to the SENSO control module for
interface to the SENSO control module for display and record. In order to prevent heat loss, an
display and record. In order to prevent heat loss, an insulating mat surrounding the glass tube was
insulating mat surrounding the glass tube was installed using a hook-and-loop tape.
installed using a hook-and-loop tape.
Experimentset-up
Figure1.1.Experiment
Figure set-upwith
withthree
threecontinuously
continuouslystirred
stirredtank
tankreactors
reactors (CSTRs).
(CSTRs).
The produced
The produced biogas
biogas from
from the
thereactors
reactorswas
wasfirst
firstremoved
removed from
frommoisture byby
moisture passing through
passing a gas
through a
washing
gas bottle
washing and and
bottle thenthen
was was
supplied to the
supplied togas
thedrum metermeter
gas drum or gasorbag
gasfor
bagcollection. The gas
for collection. Thedrum
gas
metermeter
drum operates continuously
operates in real-time
continuously and measures
in real-time the quantity
and measures of the produced
the quantity biogas biogas
of the produced within
within the reactor and is interconnected with the SENSO control for data logging. The gas bag was
used for the temporary storage of the generated biogas in each reactor. The gas bag was connected
with each reactor via a control valve. The biogas temperature measurement was made in the
connected tube of the gas bag near the control valve. The temperature was measured by aSustainability 2020, 12, 8772 4 of 19
the reactor and is interconnected with the SENSO control for data logging. The gas bag was used for
the temporary storage of the generated biogas in each reactor. The gas bag was connected with each
reactor via a control valve. The biogas temperature measurement was made in the connected tube of
the gas bag near the control valve. The temperature was measured by a temperature sensor (measuring
range: 0–60 ◦ C, accuracy: ±0.2 ◦ C), which was mounted with a T-piece connector. According to the
chosen settings at the SENSO control, the gas bag was emptied periodically, during which time the
biogas quality was measured by using a gas analyzer (SSM 6000, Pronovza Analysentechnik GmbH &
Co., Berlin, Germany). The biogas flow through the gas analyzer was regulated by a control valve via
the central control unit.
The central control unit consists of a rack with plastic sheets and fixtures and houses the gas
analyzing unit, a pressure sensor and an ethernet-switch. The pressure sensor is located in the
gas supply line from reactor to the gas analyzer and monitors the emptying of the gas bag during
gas analysis by regulating an integrated exhaust pump. The central control module serves the
control of biogas quality measurement of all the reactor units in a multiplex mode (e.g., simultaneous
measurement of multiple parameters at a time), and the measured data of all the reactor units are
stored in the SENSO module.
2.3. Experimental Procedure
Considering the ambient temperature variation in Bangladesh, the experiment was carried out
at reactor temperatures of 20, 25, 30, 35, 40 and 45 ◦ C, respectively in two rounds. In the first round
three reactors were set at 20, 25 and 30 ◦ C, while in the second round the same three reactors were
set at 35, 40 and 45 ◦ C, respectively. Inoculum for the experiment was collected from the digestate
of a previous experiment conducted at the same laboratory. Each reactor was filled with 14.5 L of
inoculum and set at selected temperature. Each day, feeding of the reactors was done manually with
500 mL mixture of raw cow-dung and water with a mixing ratio of 1:1. The digestate corresponding
to the same amount of feeding was withdrawn per day, keeping the operational HRT to be constant
at 30 days. The digester contents were mixed mechanically for 24 h per day at the agitator speed
of 60 rpm. Stirring helps to prevent crust formation and keeps a uniform temperature distribution
throughout the reactor load [30]. The biogas yield was measured by the gas drum and was recorded
once daily. The pH value, temperature and biogas flow rate were measured automatically and saved in
a database in a 15 min interval for the whole duration of the experiment. The total solids (TS) content,
volatile solids (VS) content, dissolved VFA concentration, ammonia nitrogen concentration and total
nitrogen concentration were determined weekly by analyzing the samples of digestate for each reactor,
as described below.
2.4. Analytical Methods
Total solids were measured by following the standard [31], where a known amount of sample
was dried in a heating oven (UN 30, Memmert, Schwabach, Germany) at 105 ◦ C for 24 h. The volatile
solids were determined by combusting the sample remained after drying in a muffle furnace (LE
14/11/ B 150, Nabertherm, Lilienthal, Germany) at 550 ◦ C for 5 h [31]. The difference in weight
before and after the combustion represents the amount of volatile solids. The mass that remained
after the combustion represents the ash content. The pH-value of digestate was determined
using a calibrated pH/Conductometer (914 pH/Conductometer, Metrohm, Herisau, Switzerland).
The VFA was determined after diluting a certain amount of sample using a Titrator (848 Titrino plus,
Metrohm, Switzerland). A model proposed by Møller and Ward [32] was used to calculate the VFA.
Total ammonium nitrogen (TAN) and total nitrogen (TN) were determined using photometric kits
(Spectroquant kit, Merck, Burlington, MA, USA). For the measurement of TAN, a 1 g sample was
diluted with water 50 times. Then, 0.10 mL of pretreated sample was taken into a reaction cell and 1
dose of NH4 -1 and 150 mg of NH4 -2 were added and mixed. The reaction cell was allowed to be stable
for 15 min and then the sample was measured by a photometer (NOVA 60, Memmert, Schwabach,Sustainability 2020, 12, 8772 5 of 19
Germany). For the measurement of TN, a 1 g sample was taken into an empty cell and subsequently it
was diluted with water 10 times. After the dilution, 150 mg N-1K and 6 drops N-2K were added to it.
Then, the cell was kept inside a thermo-reactor (TR 420, Merck, Darmstadt, Germany) at 120 ◦ C for
60 min. After withdrawing from the reactor, the cell was allowed to cool. Later, 1 mL of pretreated
sample was taken into a reaction cell and 1 mL N3-K was mixed with it. The mixture was then set
aside for 10 min to become stable. Finally, the total nitrogen was measured using the photometer.
The biogas volume was measured by the gas drum meter and was recalculated to Normal
Temperature and Pressure (NTP), while the biogas composition (e.g., percent volume of CH4 , CO2 ,
and H2 S) was determined automatically by using the integrated gas analyzer.
2.5. Calculation and Statistical Analysis
The carbon to nitrogen ratio (C/N) was determined according to Waskman [33] using Equation (2).
C VS (%)
= (2)
N 1.76 × TN (%)
After collecting all the data, statistical analysis was performed. Significant differences between
treatments were determined by conducting ANOVA (Analysis of Variance) using IBM SPSS Statistics 20.
2.6. Optimization
Optimum input settings are required to maximize the methane yield and volatile solid degradation.
Best-fit regression equations and standard forms of regression models were analyzed for optimization
of temperature using Minitab® 19.
3. Results and Discussions
3.1. Substrate Characteristics
During the experiment, feedstock characteristics were measured. Table 1 represents the properties
of cow-dung used in the experiment. The TS and VS content of raw cow-dung were 17.30% and
14.51%, respectively. After mixing with water, the TS and VS contents were reduced to 8.65% and
7.26%, respectively. The pH was found to be 7.08, which is similar to the rate found in a past study
by Abubakar and Ismail [34], e.g., 7.1–7.4. The C/N ratio was found to be 26. Rahman et al. [35]
determined that the optimum C/N ratio for biogas production lies between 25 and 30, while other
researchers such as Giovanna et al. [36] reported a wider range (e.g., 9–50). Gao et al. [37] determined
the C/N ratio of cow-dung to be 17.24 during their study on co-digestion of cow-dung with maize
straw and vegetable waste in China. In contrast, Yadav et al. [38] reported a higher C/N value of 50.2
for the characteristics of mixed cow-dung and biogas plant slurry in India. These differences in the
C/N ratio of cow-dung may be due to the different cattle feeding characteristics in different countries.
Due to these differences, the potential of biogas production from cow-dung in Bangladesh may differ
from other countries.
Table 1. Characteristics of cow-dung.
Parameter Value
TS (%) 17.30 ± 0.08
VS (%) 14. 51 ± 0.09
pH 7.08 ± 0.03
VFA (g/L) 4.03 ± 0.05
Alkalinity (g/L) 0.04 ± 0.00
NH4 -N (g/L) 1.66 ± 0.03
Total Nitrogen (g/L) 3.16 ± 0.01
C/N ratio 26.02 ± 0.22Sustainability2020,
Sustainability 2020,12,
12,8772
x FOR PEER REVIEW 66of
of19
19
3.2. Effect of Temperature on pH
3.2. Effect of Temperature on pH
Variation of pH at different temperatures is presented in Figure 2. Fatty acids are formed in the
Variation
hydrolysis andofacidogenesis
pH at different temperatures
stage. If the amounts is presented
of VFA are in Figure
higher,2.they
Fattyreduce
acids are
the formed
pH and in inthe
the
hydrolysis
worst caseand acidogenesis
scenario stage.the
also collapse If the amounts
system due to of VFA are higher, they
the disturbances reduce the
in activities of pH and in and
acetogens the
worst case scenario
methanogens alsovariation
[39]. The collapseofthe thesystem
pH during due theto the disturbances
digestion processinwas activities of acetogens
monitored and
continuously.
methanogens
The average pH [39].atThe variation
20, 25, 30, 35,of40theand pH 45during the digestion
°C temperatures process
were was monitored
6.16, 6.28, continuously.
6.44, 6.45, 6.45 and 6.13,
The average pH ◦ C temperatures were 6.16, 6.28, 6.44, 6.45, 6.45 and
respectively. Theatvalues
20, 25,of30,pH 35,at4030,and 3545and 40 °C were relatively higher and stable over the
6.13, respectively.
experimental TheOn
period. values of pH
the other at 30,
hand, 35 and
a low pH was40 ◦ C were relatively
observed at 20 andhigher
25 °C. and
At 45stable
°C, pHover the
started
experimental period.after
On day
the other ◦ C. At 45 ◦ C, pH started
decreasing swiftly 4 andhand,
dropped a low topH was
5.75. Dueobserved at 20 in
to this drop and 25 the
pH, biogas production in
decreasing
the reactorswiftly after day[10].
also reduced 4 andThedropped
pH atto455.75. °C Due to this
started drop in pH,
to recover fromthedaybiogas production
19 and reachedin6.57,
the
reactor also ◦
resulting inreduced
improved [10]. The pH at 45activity
methanogens’ C startedandtothusrecover
in anfrom day 19 and
improved reached
biogas yield 6.57, resulting
at that in
point. As
improved methanogens’
the substrate in AD was activity
converted andintothus in anand
biogas improved biogas CO
the resulting yield at that
2 from point.
biogas As thewith
reacted substrate
water
in
to AD was converted
produce bicarbonate, intothe
biogas
leveland
of pH the inresulting
the reactorCO2 was
frominfluenced.
biogas reacted with water
Generally, whentotheproduce
pH is
bicarbonate,
influenced, the the microbial
level of pH in the reactor
metabolism wasaffected.
is also influenced. Generally,
Rahman et al. when the pH isainfluenced,
[40] observed low pH at lowthe
microbial metabolism
temperatures, when isthe alsoconversion
affected. Rahmanrate ofetorganic
al. [40] observed a lowbiogas
matter into pH at low
wastemperatures,
low. Also, awhen high
the conversion
hydrolysis raterate of organic to
contributed matter into biogas
reducing pH due wastolow. Also, a high
an increased hydrolysis
level of VFA,rate andcontributed
thus caused to
reducing
lowered pH AD due to an increased
efficiency level and
[41]. Vangase of VFA, and thus
Bartlett caused lowered
[42] observed a dropAD efficiency
in pH at high[41]. Vangase
temperature
and
when Bartlett [42] observed
they studied a drop
the effect in pH temperatures
of various at high temperature on the when
AD of they studied
Laminaria the effect of various
digitata.
temperatures on the AD of Laminaria digitata.
6.7 at 20 ⁰C at 25 ⁰C at 30 ⁰C
at 35 ⁰C at 40 ⁰C at 45 ⁰C
6.5
6.3
pH
6.1
5.9
5.7
0 5 10 15 20 25 30
Time (day)
Figure 2. Variation of the pH at different temperatures (each data point here represents the average of
Figure 2. Variation of the pH at different temperatures (each data point here represents the average
triplicate experiment).
of triplicate experiment.).
3.3. Effect of Temperature on VFA
3.3. Effect of Temperature on VFA
Variation of VFAs at different temperatures are presented in Figure 3. Production of VFAs varied
among Variation
differentof VFAs at different
temperatures. temperatures
The VFA are presented
values showed in Figure
a decreasing trend 3.
asProduction of VFAs
the temperature varied
increased
among different
◦ ◦ temperatures. The VFA values showed a ◦decreasing
from 20 C to 40 C. High levels of VFAs were observed at 45 C. The highest accumulation of VFAs trend as the temperature
increased
(5.34 g/L) wasfromobserved
20 °C to 40 °C. High
during the levels of VFAs
third week were
of the observed atat45
experiment 45°C.
◦ C,The highest
which mayaccumulation
be due to a
of VFAs
higher (5.34
rate of g/L) was observed
hydrolysis during the
or acidogenesis third
[43]. week
This highofvalue
the experiment
of VFA reducedat 45 °C,
thewhich
pH andmayactivity
be due
to a higher rate of hydrolysis or acidogenesis [43]. This high value of VFA reduced
of methanogenic bacteria, as a result of which biogas production reduced greatly. From week 3 and the pH and activity
of methanogenic
onwards, bacteria,
VFA formation at as
45 a◦ C
result of which
started biogas
decreasing, production
causing pH to reduced
increase and greatly. From week
ultimately 3 and
to increase
onwards, VFA formation at 45 °C started decreasing, causing pH to
methane production. VFA was produced during hydrolysis and acedogenesis stages by acid formingincrease and ultimately to
increase methane production. VFA was produced during hydrolysis and
bacteria. This VFA was then converted into biogas by using methanogens in a stable AD process.acedogenesis stages by acid
forming
In bacteria.
this study, This VFAofwas
accumulation VFAthen
at lowconverted into biogas
temperatures might be bydue
using methanogens
to reduced in a activity
metabolic stable ADof
process. In this study, accumulation of VFA at low temperatures might be
methanogens at a low temperature. Sneath et al. [44] showed that the value of VFA should be less due to reduced metabolic
activity of methanogens at a low temperature. Sneath et al. [44] showed that the value of VFA shouldSustainability 2020, 12, 8772 7 of 19
Sustainability 2020, 12, x FOR PEER REVIEW 7 of 19
be less
than than
2 g/L for2the
g/Lsmooth
for the operation
smooth operation ofHansson
of the AD. the AD. [45]
Hansson [45] higher
observed observed higher
levels levels
of VFA andoflower
VFA
and lower
biogas biogas production
production under a thermophilic
under a thermophilic condition
condition as comparedas to
compared to a mesophilic
a mesophilic condition. condition.
8
at 20 ⁰C at 25 ⁰C
7 at 30 ⁰C at 35 ⁰C
at 40 ⁰C at 45 ⁰C
6
5
VFA (g/L) 4
3
2
1
0
0 1 2 3 4
Time (week)
Figure
Figure 3. Variation of volatile fatty acids (VFAs) at different temperatures
3. Variation temperatures (each
(each data
data point
point here
here
represents
represents the
the average
average of
of aa triplicate
triplicate experiment).
experiment.).
3.4. Effect of Temperature on TS and VS Degradation
3.4. Effect of Temperature on TS and VS Degradation
Total solid degradation (TSD) and volatile solid degradation (VSD) are important factors
Total solid degradation (TSD) and volatile solid degradation (VSD) are important factors
influencing the AD performance. The TSD and VSD values of the substrate during the experiment are
influencing the AD performance. The TSD and VSD values of the substrate during the experiment
presented in Figure 4. The values of TS and VS in the digested manure in all experiments were less
are presented in Figure 4. The values of TS and VS in the digested manure in all experiments were
often compared to non-digested cow manure (Table 2), as organic contents are utilized to produce
less often compared to non-digested cow manure (Table 2), as organic contents are utilized to
biogas through AD. The average TSD at 20, 25, 30, 35, 40 and 45 ◦ C temperatures were 8.99%, 16.91%,
produce biogas through AD. The average TSD at 20, 25, 30, 35, 40 and 45 °C temperatures were 8.99%,
26.16%, 30%, 31.19% and 21.45%, respectively. The highest TSD efficiency was found for the reactor at
16.91%, 26.16%, 30%, 31.19% and 21.45%, respectively. The highest TSD efficiency was found for the
40 ◦ C and the lowest was obtained for the reactor at 20 ◦ C. The average VSD at reactor temperatures
reactor at 40 °C and the lowest was obtained for the reactor at 20 °C. The average VSD at reactor
of 20, 25, 30, 35, 40 and 45 ◦ C were 12.16%, 19.37%, 28.96%, 32.74%, 35.12% and 23.15% respectively.
temperatures of 20, 25, 30, 35, 40 and 45 °C were 12.16%, 19.37%, 28.96%, 32.74%, 35.12% and 23.15%
The results showed that the TSD and VSD increased from 20 to 40 ◦ C and then decreased at reactor
respectively. The results showed that the TSD and VSD increased from 20 to 40 °C and then decreased
temperature of 45 ◦ C. Leven et al. [16] found that the degradation capacity at mesophilic temperature
at reactor temperature of 45 °C. Leven et al. [16] found that the degradation capacity at mesophilic
was higher than that of thermophilic temperature during their investigation on the effect of temperature
temperature was higher than that of thermophilic temperature during their investigation on the effect
to different bacterial communities for the AD of organic household waste. At a mesophilic condition,
of temperature to different bacterial communities for the AD of organic household waste. At a
a higher degree of microbial diversity was observed, and this might have resulted in an enhanced
mesophilic condition, a higher degree of microbial diversity was observed, and this might have
degradation efficiency [16]. Wang and Wan [46] observed that the degradation efficiency of organic
resulted in an enhanced degradation efficiency [16]. Wang and Wan [46] observed that the
compounds increased with increasing temperatures from 20 ◦ C to 40 ◦ C. However, the degradation
degradation efficiency of organic compounds increased with increasing temperatures from 20 °C to
efficiency started and continued to decline as the temperature increased further from 40 ◦ C to 45 ◦ C.
40 °C. However, the degradation efficiency started and continued to decline as the temperature
increased further from 40 °C to 45 °C.Sustainability2020,
Sustainability 2020,12,
12,8772
x FOR PEER REVIEW 8 8ofof1919
40
TSD VSD
Degdradation efficiency (%) 35
30
25
20
15
10
5
0
20 25 30 35 40 45
Temperature (⁰C)
Figure 4. Degradation efficiency over the digestion period (each data point here represents the average
Figure 4. Degradation efficiency over the digestion period (each data point here represents the
of a triplicate experiment.).
average of a triplicate experiment.).
Table 2. Digestate characteristics.
Table 2. Digestate characteristics.
Parameter 20 ◦ C 25 ◦ C 30 ◦ C 35 ◦ C 40 ◦ C 45 ◦ C
Parameter 20 °C 25 °C 30 °C 35 °C 40 °C 45 °C
TS (%) 7.87 ± 0.18 7.19 ± 0.20 6.39 ± 0.19 6.06 ± 0.31 5.95 ± 0.27 6.80 ± 0.39
VS (%) TS (%) 7.87
6.37 ± 0.10 ± 0.18 7.19 ±
5.84 ± 0.13 0.20 6.39 ±
5.16 ± 0.800.19 6.06 ± 0.31
4.89 ± 0.30 5.95 ± 0.27
4.72 ± 0.23 6.80 ± 0.39
5.58 ± 0.40
VS
VFA (g/L) (%) 6.37
3.61 ± 0.22 ± 0.10 5.84 ±
2.20 ± 0.16 0.13 5.16 ±
1.33 ± 0.190.80 4.89 ± 0.30
1.10 ± 0.12 4.72 ± 0.23
1.03 ± 0.08 5.58
3.02 0.40
± ± 1.75
NH4 -NVFA
(g/L)(g/L)2.45 ±3.61
0.07± 0.22 2.092.20 ± 0.16 1.091.33
± 0.09 ± 0.19 0.94
± 0.05 1.10
± ±0.03
0.12 1.03 ±
0.88 ± 0.08
0.03 3.02 ± 1.75
0.91 ± 0.05
NH4-N (g/L) 2.45 ± 0.07 2.09 ± 0.09 1.09 ± 0.05 0.94 ± 0.03 0.88 ± 0.03 0.91 ± 0.05
3.5. Effect of Temperature on Ammonia-Nitrogen
3.5. Effect of Temperature on Ammonia-Nitrogen
Total ammonia-nitrogen (TAN) is a crucial parameter for determining the stability of the digestion
Total ammonia-nitrogen (TAN) is a crucial parameter for determining the stability of the
process. Generally, a too high value of TAN indicates process instability, leading to inhibition [10].
digestion process. Generally, a too high value of TAN indicates process instability, leading to
During the experiment, the TAN of digestate was measured and shown in Figure 5. Production of
inhibition [10]. During the experiment, the TAN of digestate was measured and shown in Figure 5.
ammonia nitrogen decreased with the increase in the temperature up to 40 ◦ C. At 20 ◦ C and 25 ◦ C, the
Production of ammonia nitrogen decreased with the increase in the temperature up to 40 °C. At 20
average TAN was between 2 and 2.5 g/L, while at 30 ◦ C, 35 ◦ C, 40 ◦ C and 45 ◦ C, the values of average
°C and 25 °C, the average TAN was between 2 and 2.5 g/L, while at 30 °C, 35 °C, 40 °C and 45 °C, the
TAN ranged between 0.85 and 1.16 g/L. Concentrations of TAN greater than 1.5 g/L are normally
values of average TAN ranged between 0.85 and 1.16 g/L. Concentrations of TAN greater than 1.5
considered to be inhibitory for AD [47]. During the experiment, high levels of ammonium at lower
g/L are normally considered to be inhibitory for AD [47]. During the experiment, high levels of
temperatures (20 ◦ C and 25 ◦ C) can correlate with a lower biogas yield, which however was not
ammonium at lower temperatures (20 °C and 25 °C) can correlate with a lower biogas yield, which
confirmed in the present case.
however was not confirmed in the present case.Sustainability 2020, 12, 8772 9 of 19
Sustainability 2020, 12, x FOR PEER REVIEW 9 of 19
3.5
at 20 at 25 at 30
3 at 35 at 40 at 45
2.5
NH4-N 2
1.5
1
0.5
0 1 2 3 4
Time (week)
Figure
Figure 5. NH44-N
5. NH -N concentration
concentration at
at different
different temperatures
temperatures (each
(each data
data point
point here
here represents
represents the
the average
average
of a triplicate experiment).
of a triplicate experiment.).
3.6. Effect of Temperature on Biogas Yield and Composition
3.6. Effect of Temperature on Biogas Yield and Composition
The daily biogas yield from the AD of cow-dung at different temperatures is shown in Figure 6.
The daily biogas yield from the AD of cow-dung at different temperatures is shown in Figure 6.
Variations in biogas generation were observed as the reactor temperature was varied. Average
Variations in biogas generation were observed as the reactor temperature was varied. Average biogas
biogas production at 20, 25, 30, 35, 40 and 45 ◦ C was 26.44 (±7.01) L/kg VS, 101.80 (±7.62) L/kg VS,
production at 20, 25, 30, 35, 40 and 45 °C was 26.44 (±7.01) L/kg VS, 101.80 (±7.62) L/kg VS, 230.28
230.28 (±47.03) L/kg VS, 289.09 (±22.59) L/kg VS, 312.43 (±25.41) L/kg VS and 142.4 (±116.8) L/kg
(±47.03) L/kg VS, 289.09 (±22.59) L/kg VS, 312.43 (±25.41) L/kg VS and 142.4 (±116.8) L/kg VS,
VS, respectively. The reactor at 40 ◦ C produced the highest amount of biogas. The second-best
respectively. The reactor at 40 °C produced the highest amount of biogas. The second-best
performance was obtained at 35 ◦ C which produced 7.47% less biogas than that of at 40 ◦ C, followed
performance was obtained at 35 °C which produced 7.47% less biogas than that of at 40 °C, followed
by the reactor at 30 ◦ C (26.29% less), 45 ◦ C (54.42% less), 25 ◦ C (67.42% less) and 20 ◦ C (91.54%
by the reactor at 30 °C (26.29% less), 45 °C (54.42% less), 25 °C (67.42% less) and 20 °C (91.54% less),
less), respectively. The result of an ANOVA test showed that biogas production at 35 and 40 ◦ C was
respectively. The result of an ANOVA test showed that biogas production at 35 and 40 °C was
significantly higher than at 20, 25, 30 and 45 ◦ C, but the difference among these temperatures was not
significantly higher than at 20, 25, 30 and 45 °C, but the difference among these temperatures was not
significant (Table 3). At lower temperatures (20 ◦ C and 25 ◦ C) the metabolic activity of microorganisms
significant (Table 3). At lower temperatures (20 °C and 25 °C) the metabolic activity of
is generally ineffective and consequently the biogas production for these temperatures was found to
microorganisms is generally ineffective and consequently the biogas production for these
be low. From Figure 6, it is evident that the reactor at 45 ◦ C showed better performance than other
temperatures was found to be low. From Figure 6, it is evident that the reactor at 45 °C showed better
reactors until day 4. After day 4, the biogas production at 45 ◦ C started decreasing, which may have
performance than other reactors until day 4. After day 4, the biogas production at 45 °C started
been due to the drop in pH and increase in VFA (Figures 2 and 3). However, after day 21, biogas
decreasing, which may have been due to the drop in pH and increase in VFA (Figures 2 and 3).
production at the same operational temperature started increasing, which was possibly due to the
However, after day 21, biogas production at the same operational temperature started increasing,
improvement in methanogenesis caused by the increased pH and decreased VFA. In contrast, at
which was possibly due to the improvement in methanogenesis caused by the increased pH and
35 ◦ C and 40 ◦ C, the average biogas production for the majority of the period remained stable due
decreased VFA. In contrast, at 35 °C and 40 °C, the average biogas production for the majority of the
to the favorable levels of pH and VFA for methanogens activity. In fact, among all the temperature
period remained stable due to the favorable levels of pH and VFA for methanogens activity. In fact,
investigated, at 40 ◦ C the maximum biogas production was achieved. The experimental results here
among all the temperature investigated, at 40 °C the maximum biogas production was achieved. The
coincide with the preceding studies that obtained a higher biogas yield with an increase in temperature
experimental results here coincide with the preceding studies that obtained a higher biogas yield
within mesophilic conditions than that of within the thermophilic conditions [40,48–50]. Vanegas and
with an increase in temperature within mesophilic conditions than that of within the thermophilic
Bartlett [42] found a higher biogas yield at 35 ◦ C than at 45 ◦ C for AD of Laminaria digitata. Pfeffer [51]
conditions [40,48–50]. Vanegas and Bartlett [42] found a higher biogas yield at 35 °C than at 45 °C for
studied the AD of household solid waste at temperatures between 35 ◦ C and 60 ◦ C and found the
AD of Laminaria digitata. Pfeffer [51] studied the AD of household solid waste at temperatures
two optima: one at 40 ◦ C and another at 60 ◦ C. Franqueto et al. [52] observed the maximum biogas
between 35 °C and 60 °C and found the two optima: one at 40 °C and another at 60 °C. Franqueto et
yield at 40 ◦ C when they examined anaerobic co-digestion of animal waste with agricultural residue at
al. [52] observed the maximum biogas yield at 40 °C when they examined anaerobic co-digestion of
varying temperatures (e.g., 36 ◦ C to 60 ◦ C). Membere and Sallis [53] found the biogas yield to be at its
animal waste with agricultural residue at varying temperatures (e.g., 36 °C to 60 °C). Membere and
maximum at 35 ◦ C when conducting an experiment at different temperatures (e.g., 25 ◦ C, 30 ◦ C, 35 ◦ C
Sallis [53] found the biogas yield to be at its maximum at 35 °C when conducting an experiment at
and 55 ◦ C). The methane concentration was however much higher at 55 ◦ C compared to the rest of
different temperatures (e.g., 25 °C, 30 °C, 35 °C and 55 °C). The methane concentration was however
the temperatures. The study suggested that thermophilic temperature has a significant influence on
much higher at 55 °C compared to the rest of the temperatures. The study suggested that thermophilic
acclimatization, as methanogens require more time to adapt under this condition.
temperature has a significant influence on acclimatization, as methanogens require more time to
adapt under this condition.Sustainability 2020, 12, 8772 10 of 19
Sustainability 2020, 12, x FOR PEER REVIEW 10 of 19
500
Daily biogas yield (L/kg VS) 450 at 20 ⁰C at 25 ⁰C at 30 ⁰C
at 35 ⁰C at 40 ⁰C at 45 ⁰C
400
350
300
250
200
150
100
50
0
0 5 10 15 20 25 30
Time (day)
Figure 6. Biogas production profiles at different temperatures.
Figure 6. Biogas production profiles at different temperatures.
Table 3. Changes in biogas volume, methane composition and pH at different temperatures.
Table 3. Changes in biogas volume, methane composition and pH at different temperatures.
Temperature Biogas Volume (L/kg VS) CH4 CH4
pH
(◦ C) (Mean
Biogas ± Volume
SD) (%) (L/kg VS)
Temperature CH4 CH4
20 (°C) 26.44(L/kg VS)
± 7.01 a
(%)± 0.87
55.63 a ± 3.88 a
14.70VS)
(L/kg
pH ± 0.04 a
6.16
25 (Mean
101.80 ± 7.62± SD)
b 57.16 ± 0.94 b 58.20 ± 4.55 b 6.28 ± 0.04 b
30 20 230.2826.44 ± 7.01c a
± 47.03 55.63 ± 0.87
66.37 ± 1.40a c 14.70 ± 3.88
153.05 a
± 32.11 c 6.166.44
± 0.04 a
± 0.03 a
25 101.80 d
± 7.62 57.16 ± 0.94 c 58.20 ± 4.55 d ± 0.03 a
35 289.09 ± 22.59 b
67.05 ± 0.8b
193.78 ± 14.54 6.286.45
b ± 0.04 b
40 d 67.16 ± 1.55 c d ± 0.02 a
30 230.28
312.43 ± 47.03
± 25.41 c 66.37 ± 1.40 c 153.05
209.70 ± 16.23 6.446.45
± 32.11 c ± 0.03 a
45 142.4 ± 116.8 e d ± 82.3 e b
35 289.09 ± 22.59 d 61.83± ±
67.05 0.86.74
c 193.7894.6
± 14.54 d 6.456.13 ± 0.30
± 0.03 a
p-value 40 312.43 ± 25.41 d 67.16 ± 1.55 c 209.70 ± 16.23 d 6.45 ± 0.02 a
0.000 0.000 0.000 0.000
(temperature) 45 142.4 ± 116.8 e 61.83 ± 6.74 d 94.6 ± 82.3 e 6.13 ± 0.30 b
p-value(time)
p-value (temperature) 0.872
0.000 0.513
0.000 0.0000.848 0.0000.398
a–e Within each column, different letters indicate a significantly increased difference (p < 0.05).
p-value(time) 0.872 0.513 0.848 0.398
a–c Within each column, different letters indicate a significantly increased difference (p < 0.05).
Biogas compositions at different temperatures are presented in Figure 7. The methane, carbon
dioxideBiogas
and compositions
hydrogen sulfide at different temperatures
concentrations generatedare presented
during AD in Figure 7. The methane,
were measured. carbon
The average
dioxide and hydrogen sulfide concentrations generated during AD were
methane concentration of the biogas throughout the experiment at 20, 25, 30, 35, 40 and 45 C was 55.63measured. ◦The average
methane 57.16
(±0.87%), concentration
(±0.94%),of the (±1.40%),
66.37 biogas throughout
67.05 (±0.8%), the experiment
67.16 (±1.55%) at 20,
and25, 30,(±6.74%),
61.83 35, 40 and 45 °C was
respectively.
55.63
The (±0.87%),
results showed57.16that(±0.94%),
the methane 66.37 (±1.40%), 67.05
concentration was (±0.8%),
low at lower67.16temperatures
(±1.55%) and ◦ C and
(2061.83 25 ◦ C).
(±6.74%),
respectively.
The The results showed
methane concentration at 30 ◦that
C, 35the◦ Cmethane
and 40 ◦ C concentration
did not varywas low at lower
considerably, buttemperatures
a wide range (20 of
°Cvariation
its and 25 °C). wasThe methane
observed ◦
at concentration
45 C (Table 3). at During
30 °C, 35 the°Cstart-up
and 40 °C did not
period, thevary considerably,
methane concentration but a
at 45 ◦range
wide C wasofhigh
its variation
but afterwas dayobserved at 45decreasing
4, it started °C (Table 3). and During
reachedtheastart-up
minimum period,
levelthe onmethane
day 16.
concentration
The high level ofatmethane
45 °C was high but after
concentration day the
during 4, itstart-up
started period
decreasing and reached
was possibly due toa minimum
the acceleratedlevel
on day 16.that
hydrolysis Thecontributed
high level of to methane
enhancedconcentration during the
acidogenesis followed by start-up
effective period was possibly
methanogenesis [54].due
Afterto
the accelerated hydrolysis that contributed to enhanced acidogenesis
day 20, the methane concentration started increasing again and the methane concentration at 45 C followed by ◦
effective
methanogenesis
was much higher than [54]. other
Afterreactors
day 20,over the the
methane concentration
last 5 days started which
of the experiment, increasing
mightagain and the
be attributed
methane
to a shift inconcentration
the microbial at community
45 °C was much as thehigher
reactorthan other reactors
recovered from theover the of
period lastinstability
5 days of[55]. the
experiment, which might be attributed to a shift in the microbial community
The concentration of CH4 in the biogas largely depends on pH, as it controls the speciation of the as the reactor recovered
from the period
carbonate systemofandinstability [55].ofThe
the release CO2concentration
. When the pH ofisCH 4 indue
high the biogas largely
to the high depends
alkalinity on pH, in
resulting as
it controls
from the speciation
NH3 release, of the
the biogas carbonate shifts
composition system andtoward
more the release
CH4of COAlso,
[56]. 2. When the pH to
according is high due to
Bushwell’s
the high alkalinity
equation resulting
for theoretical in from
biogas yieldNH 3 release,
[57], the biogas
the oxidation composition
state shifts more
of the biomass toward
influences theCH 4 [56].
biogas
Also, according
composition to Bushwell’s
by driving equationoffor
the proportion theoretical
released biogasMethane
methane. yield [57], the oxidation
concentration 40 ◦ Cofwas
at state the
biomass influences the biogas composition by driving the proportion of released
higher than at other temperatures due to the neutral and stable pH over the course of the experiment, methane. Methane
concentration at 40 °C was higher than at other temperatures due to the neutral and stable pH over
the course of the experiment, which maintained the stability of the system. High concentrations ofSustainability 2020, 12, x FOR PEER REVIEW 11 of 19
Sustainability 2020, 12, 8772 11 of 19
CO2 were observed at lower temperatures (20 °C and 25 °C). Carbon dioxide concentrations at 30 °C,
35 °C and
which 40 °C were
maintained thelow and almost
stability of the constant
system. over
Highthe experimentalofperiod,
concentrations but atobserved
CO2 were 45 °C, higher CO2
at lower
concentrations were
◦ observed
◦ from day 7 to 23 due to the low pH. The
◦ concentration
◦
temperatures (20 C and 25 C). Carbon dioxide concentrations at 30 C, 35 C and 40 C were low ◦of hydrogen
sulfide
and wasconstant
almost very low. Forthe
over allexperimental
temperature period,
conditions,
but values of higher
at 45 ◦ C, hydrogen
CO2sulfide were observed
concentrations were
ranging from 0 to 98 ppm. The high value of H2S can reduce the methanation process by poisoning
observed from day 7 to 23 due to the low pH. The concentration of hydrogen sulfide was very low.
the cell activity. Chynoweth and Isaacson [58] reported that H2S concentrations greater than 6% can
For all temperature conditions, values of hydrogen sulfide were observed ranging from 0 to 98 ppm.
limit methanogenesis. In this study, the concentrations of H2S at all temperatures were within the
The high value of H2 S can reduce the methanation process by poisoning the cell activity. Chynoweth
safe operational range.
and Isaacson [58] reported that H S concentrations greater than 6% can limit methanogenesis. In this
2
study, the concentrations of H2 S at all temperatures were within the safe operational range.
80
at 20 ⁰C at 25 ⁰C at 30 ⁰C
at 35 ⁰C at 40 ⁰C at 45 ⁰C
75
Methane content (%)
70
65
60
55
50
45
0 5 10 15 20 25 30
Time (day)
(a)
55
at 20 ⁰C at 25 ⁰C at 30 ⁰C
50 at 35 ⁰C at 40 ⁰C at 45 ⁰C
45
40
CO2
35
30
25
20
0 5 10 15 20 25 30
Time (day)
(b)
Figure 7. Cont.Sustainability 2020, 12, x FOR PEER REVIEW 12 of 19
Sustainability 2020, 12, 8772 12 of 19
120
at 20 ⁰C at 25 ⁰C
100
at 30 ⁰C at 35 ⁰C
80 at 40 ⁰C at 45 ⁰C
H2S, ppm
60
40
20
0
0 5 10 15 20 25 30
Time (day)
(c)
Figure7.7. (a)
Figure (a) Methane,
Methane, (b)
(b) CO
CO22 and (c) H22S content at different temperatures.
3.7.
3.7. Effect
Effect of
of Temperature
Temperatureon
onMethane
MethaneYield
Yield
Daily
Daily methane
methane production
production at at different
different reactor
reactor temperatures
temperatures is is shown
shown in in Figure
Figure8.8. The The average
average
methane production at 20, 25, 30, 35, 40 and 45 ◦ C were 14.70 L/kg VS (±3.88), 58.20 L/kg VS (±4.55),
methane production at 20, 25, 30, 35, 40 and 45 °C were 14.70 L/kg VS (±3.88), 58.20 L/kg VS (±4.55),
153.05
153.05 L/kg
L/kg VSVS(±32.11),
(±32.11), 193.78
193.78 L/kgL/kg VS VS (±14.54),
(±14.54), 209.70
209.70 L/kgL/kg VSVS (±16.23)
(±16.23) andand 94.63
94.63 (±82.3)
(±82.3) L/kgL/kg VS,
VS,
respectively (Table 3). The highest volume of methane was produced at 40 ◦ C. The reactor at 20, 25,
respectively (Table 3). The highest volume of methane was produced at 40 °C. The reactor at 20, 25,
30, ◦ C temperatures produced 92.99%, 72.24%, 27.01%, 7.59% and 54.89% less methane in
30, 35
35 and
and 45
45 °C temperatures produced 92.99%, 72.24%, 27.01%, 7.59% and 54.89% less methane in
comparison to the reactor at at 40
40°C.◦ C. Results of ANOVA revealed that a significantly greater volume
comparison to the reactor Results of ANOVA revealed that a significantly greater volume of
of methane was generated ◦ and 40 ◦ C than that of at 20 ◦ C, 25 ◦ C, 30 ◦ C and 45 ◦ C (Table 3),
methane was generated at at
3535°C C and 40 °C than that of at 20 °C, 25 °C, 30 °C and 45 °C (Table 3),
respectively.
respectively.No Nosignificant
significantdifference
difference in in
methane
methane yield waswas
yield found
foundbetween
betweenthe temperatures
the temperatures at 35atand
35
40 ◦ C. Chen [59] also obtained maximum methane yield at 40 ◦ C during the investigation on influence
and 40 °C. Chen [59] also obtained maximum methane yield at 40 °C during the investigation on
of differentofparameters
influence on the anaerobic
different parameters on the fermentation of micro-algae.
anaerobic fermentation Artsupho Artsupho
of micro-algae. et al. [60] observed
et al. [60]
higher
observed methane
higher yield
methane at ayield
higher at atemperature
higher temperaturein the mesophilic region.region.
in the mesophilic Vangas and Bartlett
Vangas [42]
and Bartlett
showed that a mesophilic condition produced more biogas and methane
[42] showed that a mesophilic condition produced more biogas and methane than both thermophilic than both thermophilic and
psychrophilic
and psychrophilic conditions.
conditions. Hobson
Hobson et al. [61][61]
et al. found
found a linear
a linearcorrelation
correlationbetween
betweenbiogas biogasyield yield and
and
temperature from 25 ◦ C to 44 ◦ C when they investigated piggery and poultry wastes AD. Rahman
temperature from 25 °C to 44 °C when they investigated piggery and poultry wastes AD. Rahman et
et ◦ C to 45 ◦ C when examining the
al.al. [40]
[40] showed
showed that
that thethe methane
methane production
production improved
improved from
from 35 35
°C to 45 °C when examining the co-
co-digestion performance
digestion performance of of poultry
poultry droppings
droppings with
with sugar
sugar mill
mill press
press mud.
mud. Varel
Varel etetal.al.[62]
[62]observed
observeda
ahigher
highermethane
methaneyield yieldatat35 35°C◦ C than at 55 ◦ C when they examined the bio-methane potentiality of
than at 55 °C when they examined the bio-methane potentiality of
Spirulina
Spirulina Maxima.
Maxima. Their Their study
study suggested
suggested that that low
low nutrients,
nutrients, aa low
low C/N
C/N ratio
ratio or
or toxic
toxic compounds
compounds that that
were ◦
weregenerated
generatedduringduringthe thedigestion
digestionat at5555 °CC were
were responsible
responsible for for low
low methane
methane production.
production. PreviousPrevious
studies
studies[39,63]
[39,63]on onanaerobic
anaerobicdigestion
digestionsuggested
suggested that
thatthethe
drop
dropin methane
in methane yield is directly
yield is directly linked to the
linked to
sensitivity of the methanogens to the accumulation of inhibitory
the sensitivity of the methanogens to the accumulation of inhibitory components such as ammoniacomponents such as ammonia and
H 2 S [63]
and or VFA
H2S [63] or VFA [39].[39].
In the present
In the presentstudy, we observed
study, we observed a high level
a high of VFA
level of VFA accumulated
accumulated (Figure
(Figure3)
for a short period in the reactor at 45 ◦ C, which in turn reduced the pH of the system and ultimately
3) for a short period in the reactor at 45 °C, which in turn reduced the pH of the system and ultimately
hampered
hampered the the activity
activity and and growth
growth of of methanogens.
methanogens. As As aa result,
result, the
the biogas
biogas production
production in in that
that reactor
reactor
was reduced. Similarly, at lower temperatures (20 ◦ C and 25 ◦ C) metabolic activity of methanogens
was reduced. Similarly, at lower temperatures (20 °C and 25 °C) metabolic activity of methanogens
was
was presumed
presumedto tobebelow,
low,which
whichconsequently
consequentlymight mighthave havereduced
reducedthe theproduction
productionofofmethane.
methane.Sustainability 2020,12,
Sustainability2020, 12,8772
x FOR PEER REVIEW 13
13of
of19
19
300
at 20 ⁰C at 25 ⁰C at 30 ⁰C
Daily methane yield (L/kg VS) at 35 ⁰C at 40 ⁰C at 45 ⁰C
250
200
150
100
50
0
0 5 10 15 20 25 30
Time (day)
Figure 8. Methane production profiles at different temperatures.
Figure 8. Methane production profiles at different temperatures.
3.8. Model Fitting and Optimization
3.8. Model Fitting and Optimization
In this study, the relationship between predictor and response variables was developed using
In thisanalysis.
regression study, the All relationship
independentbetween variablespredictor
were fittedandtoresponse variables
three different models:was linear,
developed using
quadratic
regression
and analysis. All
cubic models. Theindependent
summary ofvariables were fitted
model statistics is to three different
presented in Table models: linear, quadratic
4. Temperature was
considered as a predictor/independent variable, while methane yield and VSD were consideredwas
and cubic models. The summary of model statistics is presented in Table 4. Temperature as
considered as a predictor/independent
response/dependent variables. The bestvariable, model was while methane
selected yield
on the andof
basis VSDthe were considered
highest as
coefficient
response/dependent
of regression (R2 ) and variables.
lowest value The best model was
of standard selected
error on the basis
of regression (S). of the highest
After applying coefficient
these two of
regression (R 2) and lowest value of standard error of regression (S). After applying these two
conditions, the cubic model (Figure 9) was found to be the best fit model. For methane yield and
conditions,
VSD, the cubic
the values of R2model
were (Figure
99.04% 9) and was found respectively.
98.84%, to be the best fitThemodel.
values Forofmethane yield and
S for specific VSD,
methane
the values
yield and VSD of Rwere
2 were12.04
99.04% andand 98.84%,
1.48, respectively.
respectively. The valuesequations
The regression of S for specific
obtained methane yield
using the and
cubic
VSD were 12.04 and 1.48, respectively. The regression equations obtained
model are shown in Table 5. These two equations were used in optimization of the temperature. using the cubic model are
shown
The in Tablewas
temperature 5. These
optimized twoforequations
maximum were usedyield
methane in optimization
and VSD using of the
theresponse
temperature. The
optimizer
temperature ® was optimized for maximum methane yield and VSD
◦
of Minitab . The optimum temperature was found to be 35.82 C, at which the maximum methane using the response optimizer of
Minitab ®. The optimum temperature was found to be 35.82 °C, at which the maximum methane yield
yield was 185.92 L/kg VS and maximum VSD was 32.83% (Figure 10), respectively. In optimization,
was 185.92desirability
composite L/kg VS and is anmaximum
important factorVSD was
which 32.83% (Figure
determines how10),wellrespectively. In optimization,
the input settings optimize
composite desirability is an important factor which determines how well
a group of responses. In this study, the composite desirability was found to be 0.92. A composite the input settings optimize
a group of responses. In this study, the composite desirability was found
desirability close to 1 indicates that the input settings were significantly optimized for maximizing to be 0.92. A composite
desirability
the responseclose to 1 indicates
variables. This result that thecontrast
is in input settings were significantly
with Rahman et al. [40], who optimized
obtained forthe
maximizing
optimum
the response variables. This
◦ result is in contrast with Rahman et al. [40],
reactor temperature as 44 C for anaerobic co-digestion of poultry droppings and sugar mill press who obtained the optimum
mud.
reactor temperature as 44 °C for anaerobic co-digestion of poultry droppings
In the current study, continuous stirring tank reactors were operated at six mesophilic temperatures and sugar mill press
mud. In the current
◦ study,
◦ continuous stirring tank reactors were
ranging from 20 C to 45 C. Thus, the difference in optimum temperature from the past study [40] operated at six mesophilic
temperatures
might be due toranging
differentfrom 20 °C characteristics
substrate to 45 °C. Thus,and thetheir
difference in optimum
co-digestion effect. temperature from the
past study [40] might be due to different substrate characteristics and their co-digestion effect.
Table 4. Model statistics.
Table 4. Model statistics.
Methane Yield (L/kg VS) VSD (%)
Methane Yield (L/kg VS) VSD (%)
Standard
Standard Error
Error of of Regression Standard
Regression Standard
ErrorError
of of Regression
Regression
Model
Model Regression (S) Coefficient2 (R2 ) Regression (S) Coefficient2(R2 )
Regression (S) Coefficient (R ) Regression (S) Coefficient (R )
Linear
Linear 68.36
68.36 37.97%
37.97% 7.37 7.37 42.49%
42.49%
Quadratic
Quadratic 36.79
36.79 86.53%
86.53% 3.26 3.26 91.55%
91.55%
Cubic
Cubic 12.04
12.04 99.04%
99.04% 1.48 1.48 98.84%
98.84%Sustainability 2020,12,
Sustainability2020, 12,8772
x FOR PEER REVIEW 14
14of
of19
19
(a)
(b)
Figure9.9. Regression
Figure Regressionpolynomial
polynomialcurve
curvefor
for(a)
(a)Methane
Methaneyield
yieldand
and(b)
(b)VSD.
VSD.
Table5.5.Best
Table Bestfit
fitregression
regressionequations
equationsusing
usingthe
thecubic
cubicmodel.
model.
Predictor
Predictor ResponseVariable
Response Variable Regression
Regression Equation
Equation
Methane
Methaneyield
yield(Y)
(Y) Y = 1020
Y =−1020
129.1−T129.1
+ 5.158 2 − 0.06102
T +T5.158 T3
T2 − 0.06102 T3
Temperature
Temperature (T) (T)
VSD
VSD VSD (%)
VSD (%) = −75.62
= 75.62 9.473−T9.473 T + 0.4195
+ 0.4195 2
T − 0.005216
2 T 3
T − 0.005216 T3Sustainability 2020, 12, 8772 15 of 19
Sustainability 2020, 12, x FOR PEER REVIEW 15 of 19
Sustainability 2020, 12, x FOR PEER REVIEW 15 of 19
Figure 10.
Figure 10. Optimization
Optimization plot.
plot.
Figure 10. Optimization plot.
3.9. Model Validation
3.9. Model Validation
The measured values were compared with predicted values obtained from the cubic model for
The measured
validation (Table 6).values
(Table 6). There were
were compared with predicted
few differences between values obtained
between measured
measured from thevalues
and predicted cubic of
model for
specific
validation (Table
methane yield and 6).
and VSDThere
VSD for were
for all few
all the differences
the temperatures between
temperatures that
that the measured
the reactor
reactor was and predicted
was tested.
tested. values of specific
methane yield and VSD for all the temperatures that the reactor was tested.
6. Comparison between measured and predicted
Table 6. predicted values
values of
of specific
specific methane
methane yields
yields and
and VSD.
VSD.
Table 6. Comparison between measured and predicted values of specific methane yields and VSD.
Methane Methane YieldVS)
Yield (L/kg (L/kg VS) VSDVSD(%) (%)
Temperature
◦ (°C) Methane
Actual YieldPredicted
(L/kg VS) Actual VSDPredicted
(%)
Temperature ( C) Actual Predicted Actual Predicted
Temperature
20 (°C) Actual
14.70 Predicted
13.04 Actual
12.16 Predicted
12.23
20 20
25 14.70 14.70
58.20 13.04
13.04
62.81 12.16
12.16
19.37 12.23
19.48 12.23
25 25 58.20 58.20 62.81
62.81 19.37
19.37 19.48 19.48
30 153.05 141.66 28.96 28.15
30 30 153.05 153.05 141.66
141.66 28.96
28.96 28.15 28.15
35 193.78 203.82 32.74 34.32
35 193.78 203.82 32.74 34.32
35
40 193.78 203.82 32.74 34.32
40 209.70 209.70 203.52
203.52 35.12
35.12 34.08 34.08
40
45 209.70 203.52 35.12 34.08
45 94.63 94.63 95.0095.00 23.15
23.15 23.51 23.51
45 94.63 95.00 23.15 23.51
4. Conclusions
4. Conclusions
4. Conclusions
Anaerobic digestion is a popular technology which converts organic matter into biogas through
Anaerobic digestion
Anaerobic digestion isis aa popular
popular technology
technology which
which converts
converts organic
organic matter
matter into
into biogas
biogas through
through
the enzyme-mediated activity of bacteria and archaea. AD performance at different temperatures was
the enzyme-mediated
the enzyme-mediated activity
activity ofof bacteria
bacteria and
and archaea.
archaea. AD
ADperformance
performance at atdifferent
different temperatures
temperatures was was
evaluated using cow-dung in CSTR reactors and the obtained results are summarized as follows:
evaluated using
evaluated using cow-dung
cow-dung in in CSTR
CSTR reactors
reactors and
and the
the obtained
obtained results
results are
are summarized
summarized as as follows:
follows:
The pH of the reactors at 30 °C, 35 °C and 40 °C was stable and favorable for biogas production.
◦ C, 35 ◦ C and 40 ◦ C was stable and favorable for biogas production.
ThepH
The pHofofthe
thereactors
reactors atat 30 °C,
However, at 45 °C
◦
the 30 pH was 35 °C
lowandand40 varied
°C was significantly.
stable and favorable
At lower for (20
biogas
°C production.
and 25 °C)
◦ C and 25 ◦ C)
However, at
However, at 45
45 °CC the
the pH pH waswas low
low and varied significantly. At lower
lower (20(20 °C
temperatures, pH values were stable for a majority of the time, but the average levelsand
and varied significantly. At were25lower
°C)
temperatures,
temperatures, pH
pH values
values were
were stable
stable for a majority
for a majority of the
of the time, but the average levels were lower
than those of at 30, 35 and 40 °C. Unstable and lower pHtime, butatthe
values average
digester levels were lower
temperatures of 20,
than those of at 30, 35 and 40 °C. Unstable and lower pH values at digester
25 ad 45 °C were found to be correlated with the higher levels of VFA accumulation, which temperatures of 20,
in
25 adwas
turn 45 °C were found
correlated withtothebedecreased
correlatedlevels
with of
thebiogas
higherproduction
levels of VFA accumulation, which in
turn was correlated with the decreased levels of biogas productionYou can also read