Carbon Footprint of Northern Rail - Research Report 09-02
←
→
Page content transcription
If your browser does not render page correctly, please read the page content below
Research Report 09-02                               1

                Carbon Footprint of Northern Rail

                                        Research Report
                                                  09-02
                                            CenSA and GHD
Research Report 09-02 2 © July 2009 Centre for Sustainability Accounting Innovation Centre Innovation Way York Science Park York, YO10 5DG United Kingdom E: info@censa.org.uk W: www.censa.org.uk Cover picture by courtesy of Northern Rail.
Research Report 09-02                                   3

                                        Research Report

                                                  July 2009

Carbon Footprint of Northern Rail

Available online at www.censa.org.uk.
Research Report 09-02 4
Contents
Contents .............................................................................................................................................4
Introduction.......................................................................................................................................5
Scope of this report .................................................................................................................................................... 5
Background ................................................................................................................................................................. 5
Methodology .....................................................................................................................................6
Overview of the Approach ....................................................................................................................................... 6
Terminology..............................................................................................................................................................................7
Data inputs................................................................................................................................................................................8
Scope of the analysis: what is included and what is excluded...........................................................................................8
The Issue of Responsibility and Double Counting ................................................................................................ 9
Results ..............................................................................................................................................10
Overview of Footprint ............................................................................................................................................. 10
GHG Protocol categories breakdown..................................................................................................................................10
Fuel, Network Rail and procurement breakdown.............................................................................................................11
Benchmark Performance ......................................................................................................................................... 11
Train Energy Use Footprint .................................................................................................................................... 15
Infrastructure Footprint........................................................................................................................................... 15
Procurement Footprint ............................................................................................................................................ 16
Conclusions and Recommendations ..........................................................................................18
General Recommendations..................................................................................................................................... 18
Scope 1 and 2 Emissions.......................................................................................................................................... 20
Reduce rolling stock emissions ............................................................................................................................................20
Influence the energy industry...............................................................................................................................................20
Improve quality of footprint data ........................................................................................................................................21
Incentivise energy savings ....................................................................................................................................................21
Scope 3 Emissions .................................................................................................................................................... 21
Influence the rail sector .........................................................................................................................................................21
Reduce supply chain emissions............................................................................................................................................22
Reduce the impact of business travel ..................................................................................................................................22
Conserve resources (consumables) ......................................................................................................................................22
Conserve resources (physical assets)...................................................................................................................................23
Transparency and Openness .................................................................................................................................. 23
Appendix A: Methodology...........................................................................................................23
Background.............................................................................................................................................................................23
Bottomline3 approach ............................................................................................................................................................24
Data inputs..............................................................................................................................................................................24
Calculation of electricity in Bottomline3 ..............................................................................................................................25
Appendix B: References................................................................................................................26Research Report 09-02 5 Introduction Scope of this report A greenhouse gas (GHG) footprint has been calculated for Northern Rail, including both the direct GHG emissions generated by Northern Rail’s trains and premises and those that are generated elsewhere in the production of energy, infrastructure, goods or services purchased by Northern Rail (supply chain emissions). This report provides an analysis of this footprint, and will be used to help Northern Rail develop an understanding of the structure of its footprint and develop improvement measures. In Northern Rail’s Environmental Sustainability Strategy published in 2008, there was a clear commitment to understand both the direct and indirect carbon emissions associated with Northern Rail. This full carbon footprint report meets this commitment. Background Businesses are increasingly aware of the issue of climate change and want to understand what this means for their company. It is generally accepted that the rail industry delivers mobility that has lower direct emissions per passenger kilometre than many other transport modes, most notably air and car travel. Rail travel has an important role to play in the move towards a low carbon economy for the UK, and Northern Rail is a key part of this. In order to maintain its position as a provider of low carbon mobility solutions, the railways must continue to enhance its environmental performance and seek continuing ways to reduce its carbon footprint, and play its part in encouraging other transportation sectors to reduce theirs. An important first step is to quantify the current GHG footprint, in order to identify opportunities for reduction, set appropriate targets and track progress. One of the main difficulties for any organisation in developing a credible GHG footprint is how to deal with embodied1, or supply chain, emissions (i.e. those emissions made by suppliers and suppliers of suppliers, etc. in the delivery of products and service to the organisation). As these emissions are difficult to measure, conventional footprints have excluded them, or only included a small minority, focusing instead on direct emissions and sometimes purchased electricity, which are easier to measure but often make up only a relatively small proportion of the overall footprint, particularly in service industries. These problems are overcome by the extended life-cycle approach adopted in this study, which is the first commercially available technique for capturing emissions made throughout the entire network of supply chains, respective of the country of production. 1 In this report we use the terms 'embodied' and 'embedded' as synonyms.
Research Report 09-02                                                                           6

Methodology

Overview of the Approach
The calculation model used in this project is based on an environmentally extended input-output
life-cycle analysis (EIO-LCA) at the national (UK) level, using official data from the Office of
National Statistics (ONS) “National (economic) Accounts” and ONS “Environmental Accounts”.
This means that all results all fully consistent with standard economic and environmental
accounting and fully comparable amongst each other. The sophisticated methodology is based on
10 years of scientific research which has been field-tested over five years, has been published in
numerous journal articles, and has been incorporated into a software tool named Bottomline 3
(www.bottomline3.co.uk).

The comprehensive nature of EIO-LCA means that the whole (UK) economy, including imports
and exports, are the system boundary, which is a major advantage when developing complete,
holistic GHG footprints. Conventional footprinting assessments introduce artificial boundaries to
GHG accounting, with this truncation of the system boundary often leading to significant
underestimations of the true impact. The EIO-LCA methodology used in this assessment
overcomes these truncation errors and – as the analysis shows – results in some enlightening
revelations regarding the ‘embodied’ carbon within rail transport.

This approach makes the assumption that Northern Rail’s individual suppliers and supply chains
are representative of their respective industry group classifications. Whilst this enables a
scientifically robust and replicable quantification of embedded1 emissions, the model results can
only be considered estimates and should not be mistaken for real measurements.

A detailed description of the methodology employed is provided in Appendix A.
Research Report 09-02                                                                                       7

Terminology

Table 1:    Terminology used in this report

Phrase             Definition

                 A measure of the exclusive total amount of greenhouse gas emissions that is directly
                 and indirectly caused by an activity or is accumulated over the life stages of a
                 product.
                 In this report, GHG include the three major contributors to climate change: carbon
GHG footprint    dioxide (CO2), methane (CH4) and nitrous oxide (N2O). CH4 and N2O are important
                 because they have a global warming potential greater than CO2 (21 and 310 times
Carbon footprint respectively (DEFRA 2007)). The combined global warming potential of CO , CH and
                                                                                             2    4
                 N2O is expressed in this report as a GHG footprint and is reported in CO2 equivalent
                 mass units (kg, t, kt CO2-e)
                 The term ‘GHG footprint’ and ‘carbon footprint’ have been used interchangeably in
                 this report.

                   Following the World Resources Institute (WRI) and the World Business Council for
                   Sustainable Development (WBCSD) Greenhouse Gas Protocol definitions (WRI and
                   WBCSD 2004) as well as DEFRA's "Draft guidance on how to measure and report your
Scope 1            greenhouse gas emissions" (DEFRA 2009), Scope 1 includes GHG emissions directly
emissions          occurring from sources that are owned or controlled by the organisation. This includes
                   emissions from gas oil burnt by trains for locomotive power, from natural gas burnt on
                   site and from fuel consumed by vehicles operated by Northern Rail personnel in the
                   course of business activities.

                   GHG emissions from the generation of purchased electricity consumed by the
Scope 2
                   organisation. Scope 2 emissions physically occur at the facility where electricity is
emissions
                   generated.

                   All other indirect GHG emissions that are a consequence of the activities of the
                   company, but occur from sources not owned or controlled by the company. In this
Scope 3            project we mainly assess upstream (i.e. manufacture and supply) Scope 3 emissions.
emissions          We exclude non-applicable downstream emissions (e.g. use/disposal of sold products)
                   and emissions resulting from the private activities of employees (which include travel
                   to and from work).

Direct emissions   On-site or internal emissions, directly equivalent to Scope 1.

Indirect           Off-site, external, embedded, upstream or downstream emissions. Equivalent to the
emissions          sum of Scope 2 and 3.

Embedded
                   Emissions associated with the manufacture and supply of a product or service
emissions
                   purchased by the organisation (also called supply chain emissions).
Embodied
                   In this report we use the terms 'embodied' and 'embedded' as synonyms.
emissions
Research Report 09-02 8
Data inputs
Two types of input data have been used in this assessment:
Expenditure data (from financial accounts)
Fuel used directly by Northern Rail (including gas for heating and gas oil for locomotive power)
Expenditure data (extracted from financial accounts) were provided for the 2007 and 2008 financial
years, giving the opportunity to create comparative footprints across two consecutive years. The
expenditure data allowed the embedded GHG emissions associated with the procurement of all
goods and services to be accounted, and included costs associated with the infrastructure
provision. The expenditure categories were taken from Northern Rail’s detailed profit and loss
account and were matched to the standard 76 sector categories in Bottomline 3.
Data for direct energy consumption included fossil fuels needed for heating and powering
vehicles. Consumption data on the fuel used by trains were provided for both years.
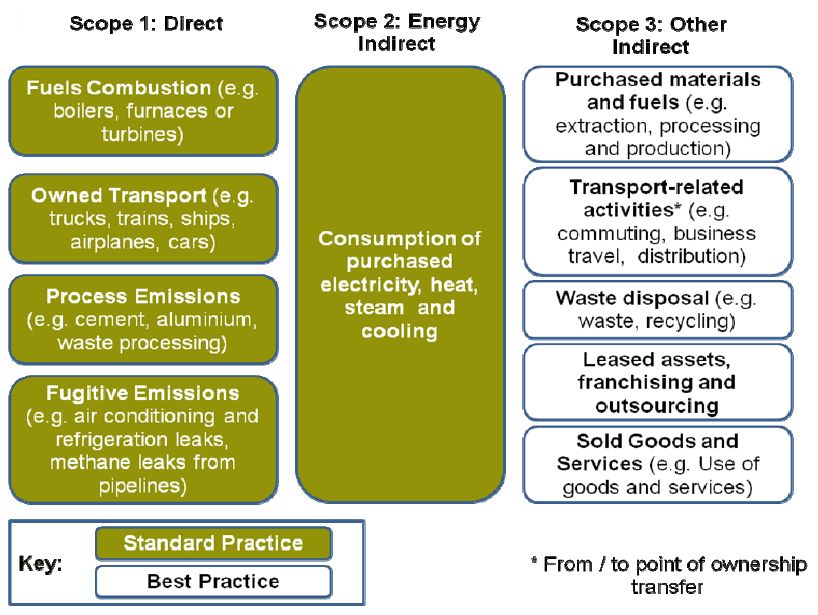
Scope of the analysis: what is included and what is excluded
The carbon footprint analysis in this report follows the 'Best Practice' procedure outlined in
DEFRA's "Draft guidance on how to measure and report your greenhouse gas emissions" from 5
June 2009 (DEFRA 2009). It is also consistent with the Greenhouse Gas Protocol Corporate
Accounting and Reporting Standard developed by the World Resources Institute and the World
Business Council for Sustainable Development (WRI and WBCSD 2004). Relevant emissions from
all Scopes 1, 2 and 3 are included. Some downstream Scope 3 emissions are not applicable as
Northern Rail only sells services to customers but not products. Therefore, there are no emissions
associated with the distribution, use and disposal of sold products. The emissions from using NR
trains ("sold services") are already included in Scope 1. Emissions from the disposal of waste and
waste water from direct operations of NR are included (via expenditure on refuse and sewage
services).Research Report 09-02 9
Figure 1: Scopes of carbon footprint emissions associated with the operations of a company
(DEFRA 2009, p.15)
In this project we exclude Scope 3 emissions associated with private activities of Northern Rail
employees which include travel to and from work; so employee commuting is excluded. Tax
spending is excluded as we consider the ways in which tax monies are spent to be outside of
Northern Rail’s influence, and the responsibility of government.
Every other item of expenditure by Northern Rail has been included in the analysis.
The Issue of Responsibility and Double Counting
The GHG footprint analysis presented in this report is based upon the full impacts associated with
Northern Rail’s operations, meaning that the full extent of GHG emissions embodied within the
supply chain. This does not imply that Northern Rail is legally responsible for the complete supply
chain emissions or even has the influence to reduce emissions along the supply chain.
Clearly, the direct emissions of one company are the indirect impacts of another company. For
example, a power plant operator reports direct GHG emissions based on on-site coal or gas
consumption, while purchasers of electricity report them as indirect emissions. Should both the
power plant operator and the electricity consumer report the full extent of emissions in the same
assessment, they will be double counted. The focus of this assessment, however, is not to develop aResearch Report 09-02 10
national total of GHG emissions, but rather to examine Northern Rail’s total footprint to
understand the contributing factors and develop ways in which it can be reduced. Therefore, the
approach of allocating full responsibility has been adopted as it provides a measure of the total
emissions associated with rail travel. For a further discussion of this issue please see Lenzen et al.
2007 and Wiedmann and Lenzen 2008.
Results
Overview of Footprint
The GHG footprint associated with Northern Rail for the 2007 financial year was just less than
300,000 t CO2-e. Over 96% of this was associated with carbon dioxide, with other greenhouse gas
emissions playing a relatively small role (around 4%). In 2008, the footprint had grown marginally
to 308,000 t CO2-e, an increase of 2.7%. Again, the results for 2008 were dominated by carbon
dioxide.
The results presented below are broken down by the GHG Protocol reporting categories and high-
level categories requested by Northern Rail (of Procurement, Train Use and Infrastructure).
GHG Protocol categories breakdown
Figure 1 below shows the results for the 2007 and 2008 financial years, organised by the categories
used within the Greenhouse Gas Protocol. Refer to Table 1 for definitions relating to Scope 1, 2 and
3 emissions.
Carbon Footprint - 2007 Carbon Footprint - 2008
30% Scope 1 (Gas Scope 1 (Gas Oil
32%
Oil for Trains) for Trains)
Scope 2 Scope 2
(Electricity (Electricity for
for Trains) Trains)
53%
Scope 3 Scope 3
58%
12%
15%
Figure 2: Northern Rail’s GHG Footprint (Scopes 1, 2 and 3)
Scope 1 emissions account for between 30 and 32% of the total emissions. These emissions are
almost entirely associated with the use of gas oil for train fuel. Scope 2 emissions (purchased
electricity) account for between 12 and 15% of total emissions. This is predominately electricity to
power trains. Scope 3 emissions account for between 53 and 58% of the total carbon footprint. This
includes all the embodied carbon along the supply chains of the products and services purchased
by Northern Rail.Research Report 09-02 11
Fuel, Network Rail and procurement breakdown
Figure 2 shows the results broken down by the following categories:
Carbon footprint of energy used to power trains (including both gas oil and electricity). These
include Scope 1 and Scope 2 emissions.
Carbon footprint of Northern Rail’s contribution towards railway infrastructure, provided by
Network Rail. These emissions are part of Scope 3 emissions.
Carbon footprint associated with all other expenditure by Northern Rail. These emissions are
Scope 2 and 3 emissions.
Carbon Footprint - 2008
Carbon Footprint - 2007
29% 31% Train Use - Gas Oil
29% Train Use - Gas Oil
32%
Train Use -
Train Use - Electricity
Electricity Infrastructure
Infrastructure
Procurement
Procurement
12%
14%
26%
27%
Figure 3: Carbon Footprint Broken Down by Activity
Out of the three categories, energy for trains is the most significant (~41%). However, by only
considering the energy use of trains, ~59% of the carbon footprint is not considered. The carbon
footprint of providing the infrastructure for trains is considerable, accounting for a further 28%2.
The remainder (31%) is associated with Northern Rail’s business expenditure required to operate
its trains. This incorporates the full range of business functions from hiring rolling stock and
printing timetables to maintaining the necessary corporate insurance.
Benchmark Performance
Benchmarking enables entities of disparate qualities to be compared against one another. The
performance of passenger railways is often benchmarked by comparing a performance indicator,
such as GHG emissions, on a per passenger kilometre basis (passenger km).
Northern Rail’s total GHG footprint increased between 2007 and 2008 by 2.7%, however it is also
noted that the total quantity of passenger journey (passenger km) also increased over this period.
Figure 4 below compares the benchmarked (or normalised) performance across the two years.
2 Please refer to the discussion regarding the carbon footprint associated with Network Rail later on in Section 3 of this
report. This value is not necessarily a representative indication of the carbon footprint associated with providing and
maintaining the infrastructure that Northern Rail requires to operate its services.Research Report 09-02 12
Conventionally, measures of GHG emissions per passenger km within the rail industry have been
based only on the emissions associated with the energy (i.e. diesel/gas oil and electricity) used to
power the trains. As highlighted above, this component only accounts for ~41% of Northern Rail’s
total footprint, when embodied emissions are also considered to provide a complete footprint.
Figure 4 compares different measures of the benchmarked GHG emission performance: firstly
when only train energy use is included; secondly with infrastructure embodied emissions added;
and lastly with all embodied emissions included. The first measure (train energy only) is the most
suitable for comparison against standard industry measures. Figure 4 is cumulative.
Complete Carbon Complete Carbon
Footprint Footprint
Fuel and Fuel and
Infrastructure Infrastructure
Train Energy Use Train Energy Use
- 50.00 100.00 150.00 200.00 250.00 300.00 0 50 100 150 200 250 300
CO2e (grams / pkm) CO2e (grams / pkm)
Figure 4: Comparison of different measures of emissions per passenger km
The average carbon footprint for train energy use was between 98 and 102 grams CO2-e/passenger
km3. The variation between the two years is within error margins, indicating that it is reasonable to
conclude that there was no or little change in the train energy-based footprint of delivering one
passenger km by Northern Rail in 2007 and 2008. In Figure 5, the performance of Northern Rail is
compared to the direct CO2 emissions of other transport modes.
3 Two sources of energy are used to power trains operated by Northern Rail, these being gas oil and electricity. In this
analysis it is assumed that the electricity is provided by the national grid and therefore adopts the national fuel mix
for producing electricity. ONS Environmental Accounts data were employed to estimate the carbon output of gas oil.Research Report 09-02 13
Figure 5: Relative direct carbon dioxide emissions of rail compared to other modes
(DfT 2007, p. 113; updated figure to replace Figure 11.1 in the rail white paper
Delivering a Sustainable Railway and Figure 4.2 in the Rail Technical Strategy)
There is a notable decrease in the normalised carbon footprint associated with Northern Rail’s
infrastructure and procurement needs between 2007 and 2008, resulting in a reduced impact per
passenger km. This is discussed in greater detail later in this Section.
To support the result above, a benchmark relating to the carbon footprint per £ spent by Northern
Rail has been presented below in Figure 6.Research Report 09-02 14
Figure 6: Northern Rail 2008 – Greenhouse Gas Emissions per £ spent (the spider diagram
shows the emission intensity of NR compared to that of the whole UK railway sector.
The red line shows the values for three GHGs as well as the total. The regular polygon
in the centre of the diagram (black line) shows the average emission intensity per £ of
the UK railway sector, allowing a benchmark comparison. GHG footprints lower than
the average are closer to the centre, while higher footprints are positioned closer to the
outside boundary ("the smaller the area encircled by the red line, the better").
The greenhouse gas emissions per £ spent for Northern Rail is between 20% and 40% higher than
the average impact of the rail sector spending a £. This is a comparison with any company that it
categorised as belonging to the "rail sector". This includes infrastructure (Network Rail), train
operating and other supporting companies.
In terms of comparability, the fact that the “complete” carbon footprint has been assessed is
important. Northern Rail is the first TOC to undertake this analysis and therefore cannot directly
compare the results with others. The analysis in this report should be seen as a vehicle to enable
Northern Rail to gain a greater understanding of the carbon emissions of their operations and not
for comparisons. The information above can be used to give an indication of how Northern Rail
compares with the average impacts of the sector.
The situation is changing fast and it will not be long before clear and complete comparisons of
carbon footprint are possible. Already the National Health Services, education sector and over 15
companies are using this approach.Research Report 09-02 15 Train Energy Use Footprint Traction energy for trains operated by Northern Rail is supplied by gas oil and electricity. The absolute GHG footprint associated with energy use for train operation was marginally over 143,000 t CO2-e. The use of gas oil was responsible for 69% of this, and the remainder was associated with the use of electricity. In order to estimate the emissions associated with the supply of electricity, it is standard practice to use DEFRA’s conversion factor, which is published as part of their guidance for businesses on GHG reporting. However, this figure underestimates the associated GHG emissions because it does not take into account the embodied emissions associated with generating electricity (instead, it only accounts for direct emissions occurring from the power plant). In reality, electricity generation relies on numerous supply chains, just like any other product or business. Therefore, in estimating the emissions associated with electricity given above, we have used the conversion factor that accounts for the full footprint (i.e. direct emissions plus embodied emissions), which is approximately 25% higher than the factor published by DEFRA. When making comparisons with other train operators’ estimates of emissions from electricity, this should be taken into account. For a further explanation of electricity conversion factors please refer to appendix A. Infrastructure Footprint The GHG footprint associated with Network Rail relates to Northern Rail’s ‘share’ of the GHG emissions associated with the provision, maintenance and operation of the rail infrastructure. Bottomline3 was used to calculate this footprint, using financial transactions to map economic activity and assign associated emissions. To enable this assessment, two additional assumptions were made: The fiscal transaction between Northern Rail and Network Rail is representative of the Northern Rails ‘share’ of the rail network. In other words, the amount that Northern Rail paid Network Rail is a true representation of the cost of providing the service that Network Rail provided Northern Rail; The allocation within Bottomline3 for the expenditure associated with Network Rail is allocated to the rail sector and therefore represents a carbon footprint associated with the sector average and not specifically Network Rail. In reality, it is expected that both of the above assumptions will result in some error, as discussed below: The amount that Northern Rail pays Network Rail is not directly governed by the service provided, but is a product of the gap in funding between Network Rail’s reasonable costs determined by the Office of Rail Regulation (ORR) and all its other forms of income outside of track access charges. This funding gap is then met by the Train Operator whose charges are determined in a number of ways described in the Network Statement; Bottomline3 uses complex economic models to estimate how expenditure propagates through an economy. In the case of Network Rail, a more accurate estimation of the carbon footprint would be derived if Network Rail’s expenditure was mapped based upon company financial
Research Report 09-02                                                                              16

   information, rather than allowing the model to map the expenditure as was done in this
   assessment.

It was beyond the scope of this assessment to complete a detailed assessment of Network Rail’s
GHG footprint, and it will only be possible to accurately estimate Northern Rail’s ‘share’ of the rail
infrastructure footprint if such an assessment is completed.

The GHG footprint associated with Network Rail in this assessment should therefore be seen as an
indication of the magnitude of the likely footprint, and it should be acknowledged that the
footprints calculated for train use and procurement are likely to be more accurate.

The ‘take home’ message of this portion of the assessment is that significant GHG emissions are
associated with the provision, maintenance and operation of the rail infrastructure. Many
traditional rail footprinting studies have not considered this significant contributor, and as such
should be viewed as underestimating the real emissions associated with rail travel.

Procurement Footprint
In terms of absolute impact between 2007 and 2008, there is no notable variation in the emissions,
accounting for 31% of the total GHG footprint in both years. The normalised emissions (i.e.
emissions per passenger km) indicate a reduction in emissions, suggesting that the reduction in the
normalised emissions is attributable to increased operational efficiency, largely realised through
increased passenger throughput while maintaining a similar expenditure profile.

Figure 7 below gives a detailed breakdown of the procurement categories. These 16 categories
make up 80% of the procurement footprint.

      Contracted in Train Painting
                 Schedule 8 TOC
                   WYPTE leases
  Contracted in Light Maintenance
 Cont in Interior carriage cleaning
    Commission Payable - Lennon
                Station lease LTC
                      Taxis - Staff
            Pension contributions
                         BT Police
              Buses - Emergency
       ISS Cleaning/Maint - Fixed
               Porterbrook leases
             Day to day materials
                 Buses - Planned
                     Angel leases

                                      -   5,000   10,000         15,000   20,000       25,000
                                                       GHG (tonnes)

Figure 7:      Breakdown of Northern Rail's Procurement Footprint
Research Report 09-02 17
The embodied energy in the construction of the rolling stock ("Angel leases") has by far the most
significant impact, accounting for 25% of the procurement footprint. This is followed by a number
of categories with a similar carbon footprint; these being the use of buses, day to day materials for
train maintenance as well as cleaning. Together these three categories account for a further 25%.
In terms of where the carbon footprint occurs along the supply chain, Figure 8 demonstrates the
“layers” in the supply chain for the total impact of Northern Rail. 'Layer 2' is representative of all
direct suppliers to Northern Rail, 'Layer 3' are the suppliers of those suppliers and so on.
120,000
100,000
80,000
CO2e (tonnes)
60,000
40,000
20,000
-
Direct Layer 2 Layer 3 Layer 4 Layer 5 Layer 6 Layer 7 Layer 8
Layers in the supply chain (groups of suppliers)
Figure 8: Carbon Footprint through the supply chain (production layers in the economy)
Over 55% of the total carbon footprint of Northern Rail occur either directly (onsite emissions) or
are associated with a direct supplier to Northern Rail.
Again, many traditional rail footprint analyses have not considered the full scale of emissions
embodied in procurement due to the introduction of artificial system boundaries. They should
therefore be viewed as underestimating the real emissions associated with rail travel.Research Report 09-02 18
Conclusions and Recommendations
Our conclusions and recommendations are set out below, with recommendations highlighted in
bold text. The issue of carbon and introducing mitigation strategies is not new to Northern Rail.
The added value of this report relates to the inclusion of scope 3 emissions for the first time.
Therefore, the majority of the recommendations focus on reducing scope 3 emissions.
Northern Rail already appreciates many of the key benefits to in reducing their GHG footprint.
There is a reputational benefit which can be used in marketing a company's goods and services. In
the case of Northern Rail this benefit already exists in part as rail is perceived to be an
‘environmentally friendly’ travel mode. The benefit from a marketing perspective that will accrue
if the recommendations within this report are followed is that Northern Rail will be able to report
improvements to their GHG emissions and the ability and scope to reduce these emissions is
increased by the assessment methodology used in this study. The marketing benefit of claiming
GHG reductions from the supply chain is well recognised in the retail sector and often the effort
required to adjust procurement strategies to achieve these reductions in not great.
Further benefits from GHG reduction actions are often realised on the bottom line. Many of the
suggested actions strive to use resources more efficiently, often leading to cost reduction. GHG
reduction strategies sometimes identify aspects that traditional ‘cost management’ has missed.
It should be noted that there is an issue in using the GHG footprint generated in this assessment as
the footprint is based upon a holistic approach, without the artificial imposition of system
boundaries. Other studies only consider a limited aspect of the total footprint. If utilising a
comparison of footprints within Corporate Reporting it is therefore important to compare data on
a ‘like for like’ basis. Using the data within this assessment, it is possible to generate a GHG
footprint that can be compared to other studies.
General Recommendations
A key benefit of quantifying the supply chain emissions is that this gives an insight into the areas
(other than its own direct emissions) where Northern Rail could exert influence on its supply
chains to reduce carbon emissions. We therefore recommend that Northern Rail:
Develop a prioritised action plan for reducing Northern Rail’s GHG footprint. We
suggest this involve a workshop process to identify potential reduction measures and
assess these against potential size of impact, potential cost, relative ease of
implementation and likelihood of success.
Measures to reduce supply chain emissions should be focused on GHG ‘hotspots’ within the
supply chains, in order to generate maximum reductions for least cost/effort. The information
provided in this report clearly acts a strong list to concentrate effort. Therefore:Research Report 09-02 19
The potential for reducing supply chain emissions should be investigated in more
detail to establish the GHG hotspots within the supply chains where Northern Rail
should focus its emission reduction efforts and where they have greatest influence.
Environmental improvement initiatives run the risk of being short term unless they are embedded
within business processes. Many organisations adopt an Environmental Management System
(EMS), which provides a mechanism for formalising environmental programmes and delivering
continuous improvement. Therefore we recommend that Northern Rail:
Embed the GHG reduction measures within business processes, for example under
Northern Rail’s existing Environmental Management System. However, this should
not be purely about process but must establish sound reduction targets.
In order to measure its progress in reducing its GHG footprint, Northern Rail will need to conduct
periodic reviews, involving a staged, iterative process. Such reviews will also enable Northern Rail
to ensure its priorities continue to be aligned to new developments, such as new technologies or
changing stakeholder expectations, for example. We therefore recommend that Northern Rail:
Undertake regular reviews on a one to two year basis to track the progress of
Northern Rail’s GHG footprint reduction programme and to highlight any new or
emerging priorities.
A secondary value to Northern Rail of this analysis is its ability to raise awareness of sustainability
issues throughout the organisation. Through robustly estimating the scale and nature of embodied
GHG emissions, the sustainability impacts of purchases not typically associated with climate
change in the mainstream media (such as professional services and pension schemes) can be
readily communicated to non-sustainability professionals. We therefore recommend that Northern
Rail’s sustainability team:
Use this report to raise awareness of Northern Rail’s wider sustainability impacts to
all staff, particularly those in senior roles whose decisions have the greatest impact.
This study did not take the entire Scope 3 emissions into account by not including staff
commuting. While it is clearly personal choice on how someone gets to work, Northern Rail can
influence individual decisions by considering home working policies, the position of offices and
incentive systems. Therefore:
Include the full Scope 3 emissions by considering the GHG footprint of staff
commuting.Research Report 09-02 20
Scope 1 and 2 Emissions
Reduce rolling stock emissions
The single biggest contributor to Northern Rail’s carbon footprint is the emissions associated with
powering trains (41% of total). Northern Rail are already aware of the significant opportunities for
improving the performance of the rolling stock. It is clear from the Environmental Sustainability
Strategy that Northern Rail have already undertaken a review and prioritised measures to
improve the efficiency of the rolling stock, a key step in reducing emissions. In addition to this
many of the recommendations that we would suggest are being considered. The list below outlines
these measures in relation to reducing the carbon footprint.
Review and prioritise measures to improve the efficiency of the rolling stock.
Measures that could be taken include:
Re - engineering the units, i.e. installing new engines. Modern designs can considerably improve
efficiency.
Implementing regenerative braking technology, a solution currently being implemented elsewhere
in the industry. Regenerative breaking involves recovering energy from trains during braking and
either returning this energy to the system, or in the case of diesel traction, charging batteries,
which then contribute to the energy used to power the train.
Driver training to increase fuel efficiency. This could also be linked in to work currently being
undertaken by RSSB on a speed management system to advise drivers on the optimum speed to
maximise fuel efficiency.
Investigating options for improving the efficiency of air conditioning units and lighting, etc. on
trains.
Consider the use of greener fuels (e.g. biodiesel). There is currently concern over the
impacts of some biofuel production on biodiversity and communities. However,
sustainable sources are available and a careful selection of previously appraised and
certified sources for biofuels could present an opportunity to significantly reduce
the fuel footprint.
Influence the energy industry
The rail sector is a large consumer of electricity and is in a strong position to influence the
electricity supply industry. We recommend that where possible Northern Rail:
Strongly support renewable energy for electricity generation. Whilst the reduced
emissions from green electricity tariffs cannot currently be claimed by consumers
under government guidelines4 and whilst there is significant variation in the
percentage of renewables that provide green energy tariffs, there are other ways to
4 Note this issue is currently being debated via consultation on the draft Carbon Reduction Commitment legislation, and
therefore may change depending on the outcome of the consultation. The statement is correct at the time of writing.Research Report 09-02 21
support renewable energy. Northern Rail could influence Network Rail’s future
decisions in relationship to the provision of electricity. The key factor is the retirement
of tradable quotas.
Improve quality of footprint data
Northern Rail should adopt a policy of continually improving the visibility and quality of its
carbon footprint data. We therefore recommend that Northern Rail:
Review footprinting data quality, and establish a continuous improvement action
plan, prioritizing the most significant absolute components of the overall footprint.
As a general starting point, this should include checking that fuel and energy
consumption data are based as far as possible on direct measurement (e.g. meter
readings) that relate solely to the fuel and energy consumption attributable to Northern
Rail.
Incentivise energy savings
In an ideal situation, energy users pay only for the energy they use, so each user is financially
incentivised to reduce energy use. However, it is common for this incentive to be lost, for example
due to flat rate payment arrangements, lack of link-up between procurement and energy
management roles, etc. To this end we recommend that Northern Rail:
Move to ensure they pay only for the fuel and energy used (based on metered
supply), and that the link between cost and energy use is clear.
Consider the use of smart electricity meters to identify real-time power use of
electrical appliances.
Scope 3 Emissions
Influence the rail sector
Significant emissions are associated with the provision of the rail infrastructure through Network
Rail. We therefore recommend that Northern Rail:
Encourage Network Rail to complete a GHG footprinting study incorporating a
detailed assessment of Scope 3 emissions. The findings of this assessment should be
incorporated in future footprinting studies completed by Northern Rail.
Encourage Network Rail to implement an emissions reduction strategy.
Encourage Network Rail to be proactive, open and transparent with regards to the
assessment and mitigation of GHG emissions.
Support a wider assessment across the UK Rail Sector.Research Report 09-02 22
Reduce supply chain emissions
All of Northern Rail’s expenditure has an associated embedded GHG footprint. The results of this
study show that these embedded emissions are a significant proportion of Northern Rail’s total
footprint. We recommend that Northern Rail:
Ensure embodied emissions are considered in all procurement decisions starting
with the “Big Hitters”.
Ask suppliers to:
- Provide information about GHG emission embedded in their products and services
- Explain any emissions reduction measures they have implemented
Move towards selecting suppliers based on their sustainability performance, key
aspects of which should be, in order of priority:
1: Lowest embedded GHG emissions
2: (Where there is no information on 1)
Highest level of maturity in GHG accounting and reduction
3: (Where there is no information on 1 or 2)
Strength of commitment to reducing GHG emissions
Reduce the impact of business travel
Business travel often accounts for a significant component of a carbon footprint, and is a key area
where reductions can be made through influencing employees’ behaviour. We therefore
recommend that Northern Rail:
Collate business travel information and use this to calculate the associated GHG
emissions.
Implement measures to reduce the amount of business travel undertaken, such as
promoting teleconferencing, car sharing, optimising single business trips to achieve
multiple objectives, and implementing video conferencing facilities.
Ensure that the GHG emissions associated with business travel are always
considered when selecting the mode of travel (e.g. rail, road, air) and recommend a
mode hierarchy to staff (e.g. rail before road, where possible).
Conserve resources (consumables)
By reducing its use of resources (e.g. water, paper, stationery, etc.), Northern Rail can reduce the
indirect emissions associated with the upstream manufacture and supply, and the downstream
processing (e.g. water treatment, waste disposal) of those resources. In addition, conserving
resources reduces costs. We therefore recommend that Northern Rail:
Measure the use of resources such as water, paper, stationery, etc.
Implement measures to reduce resource consumption, e.g. raising staff awareness,
fitting water conservation devices in toilet cisterns, setting printers to print doubleResearch Report 09-02 23
sided as default, moving towards paper-free offices, maximise the efficient use of
equipment and desk space etc.
Implement measures to reduce the downstream emissions associated with waste
processing, such as segregating and recycling waste.
Conserve resources (physical assets)
In our experience, there is often significant scope for reducing the use of resources associated with
an organisation’s physical assets, such as electrical equipment, vehicles, etc. The practice of asset
management within an organisation usually emerges gradually over time, and is rarely reviewed
and tailored to meet the core business objectives. Therefore, it is not uncommon to find that
organisations hold more assets than necessary or through focusing on managing operational rather
than capital budgets, fail to optimise the lifespan of existing assets. We therefore recommend that
Northern Rail:
Assess opportunities for improving the efficiency of the use of physical assets by
conducting an asset management review.
Transparency and Openness
We would strongly encourage Northern Rail to publicise these results both encouraging openness
and transparency. By commissioning this study, Northern Rail has proofed itself a leader in its
sector, a position which would be manifested by publishing this study. Therefore,
Make the report publicly available on the Northern Rail website (mirrored by
posting on the CenSA and GHD websites)
Submit emissions data to the Carbon Disclosure Project and answer the Supply
Chain questionnaire which refers to Scope 3 emissions. Consider participating in
CDP's Supply Chain Leadership Collaboration.
Appendix A: Methodology
Background
Methodologically, the task of calculating carbon footprints can be dealt with by employing one of
two approaches using a life-cycle perspective:
A bottom-up process analysis (PA)
A top-down environmental input-output (EIO) analysis.
The method of choice will often depend on the purpose of the enquiry and the availability of data
and resources. EIO analysis is generally considered superior for the establishment of carbon
footprints in holistic systems because it does not rely on the imposition of system boundaries and
can utilise readily available data. In this context a carbon footprint of industrial sectors, individualResearch Report 09-02 24
businesses, larger product groups, households, government, the average citizen or an average
member of a particular socio-economic group can easily be performed by input-output analysis.
On the other hand, PA has advantages when looking at micro-systems: a particular process, an
individual product or a relatively small group of individual products.
Bottomline3 approach
Every organisation has a complex web of suppliers and clients, each of which contribute their own
footprint to the total. In this work, in order to assess the total (cumulative) footprint, we have
adopted an extended input-output approach. The method is based on environmental input-output
analysis at the national (UK) level, using official data from the ONS National Accounts and
Environmental Accounts. This means that all results are fully consistent with standard accounting
and fully comparable amongst each other.
The Bottomline3 UK software employed in this project is based on a static, single-region, open,
basic-price, 76-sector industry-by-industry input-output model of the UK economy as of 2000,
augmented with a database of environmental, social and economic indicators from 2001. In
simplistic terms, the model uses the transactions of the organisation to simulate the effects that this
has throughout the wider economy. The model framework is described in Foran et al. 2005a with a
summary available in Foran et al. 2005b and a recent example application can be found in
Wiedmann et al. 2009. A short summary of the methodology can also be found in Wiedmann and
Lenzen 2008.5
The comprehensive nature of the input-output approach means that the whole UK economy –
including imports and excluding exports – are the system boundary, which is a major advantage to
a life-cycle analysis (LCA). Conventional LCAs are based on process analyses, meaning that only
on-site, most first-order, and some second-order impacts are considered. The truncation of the
system boundary in conventional LCA can lead to a significant underestimation of the true impact.
Using Bottomline3, the error caused by this truncation can be avoided. On the other hand, EIO is
limited by the number of sectors it can distinguish (currently 76 in Bottomline 3) and relies on
average values for prices and emissions per sector.
Data inputs
Two types of input data are required, financial accounts and on-site fuel use data. Financial
accounts include all expenditure and revenue data from one year, ideally as detailed as possible.
This includes spending on (purchasing of) equipment, materials, furniture, computers and food
but also services like business transport, insurance, banking & financing, legal advice and research.
Expenditure categories are mapped to the 76 standard input-output categories used in Bottomline 3.
Data for direct (on-site) energy consumption include fossil fuels needed for heating and vehicles
and are in physical units (e.g. kWh of gas).
5 Further details are available from http://www.isa.org.usyd.edu.au/publications/index.shtml and
http://www.isa.org.usyd.edu.au/research/tbltwo.shtml.Research Report 09-02 25
Calculation of electricity in Bottomline3
There is a constant change in the carbon impact per unit of electricity produced in the UK due to
variations in the fuels used in generating electricity to the National Grid. There is therefore some
variation in the impact factor used by different tools and models. DEFRA publish a factor as part
of their guidance for businesses on Greenhouse Gas reporting 6 . However, this factor is not
consistent with the methodology used for calculating Footprint. The methodology used in this
analysis ensures that all upstream impacts are accounted for and included within the analysis.
Electricity is no different from any other product and therefore all upstream impacts of electricity
generation are captured and included. In the DEFRA electricity emissions factor, only the impact
corresponding to the fuel required to generate the electricity is considered and therefore this
method does not consider the full impacts of electricity generation and indeed there is a
considerable carbon impact associated with the interaction of the electricity sector with other
sectors. When a full picture of the inputs to the electricity sector is taken into account, the carbon
footprint of one unit of electricity is approximately 25% higher than the DEFRA factor. For this
study, the conversion factor that accounts for the total carbon footprint has been used (rather than
the DEFRA factor) to ensure consistency throughout the report. In addition to the issue of
consistency, it is our understanding that Northern Rail wish to obtain an accurate understanding
of the Footprint of its operations and not an underestimate of impact. However, this does mean
that the factor for electricity is higher than other reports might suggest.
The variation in the DEFRA electricity factor and the factor used in this report has been shown
below in Figure 9, along with a projection on the likely impact of electricity.
120,000
100,000
80,000
DEFRA Electricity Calculation
CO2 (000t)
60,000
Input Ouput Electricity
Calculation
40,000
20,000
-
1992 1995 1998 2001 2004 2007 2010 2013 2016 2019
Figure 9: Comparison of emissions from UK electricity production over time
6 Defra (2005) Company Greenhouse Gas Emissions Reporting Guidelines, available from:
http://www.defra.gov.uk/environment/business/envrp/pdf/envrpgas-annexes.pdf [accessed March 2009]Research Report 09-02 26
Appendix B: References
British Standards, DEFRA, Carbon Trust (2008) PAS2050:2008 Specification for the assessment of the life cycle
greenhouse gas emissions of goods and services
DEFRA (2007) Guidelines to DEFRA’s GHG converson factors for company reporting DEFRA (2007) "Guidelines for
Company Reporting on Greenhouse Gas Emissions." Retrieved July 2007, from
http://www.defra.gov.uk/environment/business/envrp/index.htm.
DEFRA (2009) Draft guidance on how to measure and report your greenhouse gas emissions. 5 June 2009. UK
Department for Environment, Food and Rural Affairs, London.
DfT (2007) Delivering a Sustainable Railway. July 2007. Department for Transport, London.
Foran, B., Lenzen, M. and Dey, C. (2005a) Balancing Act: A triple bottom line analysis of the 135 sectors of the Australian
economy. CSIRO Technical report. CSIRO Resource Futures and The University of Sydney, Canberra, ACT,
Australia. http://www.cse.csiro.au/research/balancingact and http://www.isa.org.usyd.edu.au.
Foran, B., Lenzen, M., Dey, C. and Bilek, M. (2005b) Integrating sustainable chain management with triple bottom line
accounting. Ecological Economics 52(2): 143-157. http://dx.doi.org/10.1016/j.ecolecon.2004.06.024.
Lenzen, M., Murray, J., Sack, F. and Wiedmann, T. (2007) Shared producer and consumer responsibility - Theory and
practice. Ecological Economics 61(1): 27-42. http://dx.doi.org/10.1016/j.ecolecon.2006.05.018
WBCSD & WRI (2007) The Greenhouse Gas Protocol. A Corporate Accounting and Reporting System.
Wiedmann, T. and Lenzen, M. (2008) Unravelling the Impacts of Supply Chains - A New Triple-Bottom-Line Accounting
Approach and Software Tool. In: S. Schaltegger, M. Bennett, R. L. Burritt and C. Jasch, Environmental Management
Accounting for Cleaner Production, Chapter 4: 65-90, Springer, Dordrecht, NL > http://dx.doi.org/10.1007/978-1-
4020-8913-8_4, http://www.springer.com/978-1-4020-8912-1 .
Wiedmann, T., Lenzen, M. and Barrett, J. (2009) Companies on the Scale - Comparing and Benchmarking the
Sustainability Performance of Businesses. Journal of Industrial Ecology. http://dx.doi.org/10.1111/j.1530-
9290.2009.00125.x.
WRI and WBCSD (2004) The Greenhouse Gas Protocol - A Corporate Accounting and Reporting Standard. March 2004.
World Resources Institute (WRI) and World Business Council for Sustainable Development (WBCSD).
http://www.wbcsd.org/web/publications/ghg-protocol-revised.pdf.You can also read