AN IMPROVED NON-ENZYMATIC ELECTROCHEMICAL SENSOR AMPLIFIED WITH CUO NANOSTRUCTURES FOR SENSITIVE DETERMINATION OF URIC ACID
←
→
Page content transcription
If your browser does not render page correctly, please read the page content below
Open Chemistry 2021; 19: 481–491
Research Article
Jamil A. Buledi, Sidra Ameen, Saba A. Memon, Almas Fatima, Amber R. Solangi*,
Arfana Mallah, Fatemeh Karimi*, Salima Malakmohammadi, Shilpi Agarwal,
Vinod Kumar Gupta*
An improved non-enzymatic electrochemical
sensor amplified with CuO nanostructures for
sensitive determination of uric acid
https://doi.org/10.1515/chem-2021-0029 morphologies, and elemental composition of synthesized
received June 24, 2020; accepted November 21, 2020 nanostructures. The cyclic voltammetry (CV) was subjected
Abstract: This study displays the facile and fluent electro- to investigate the electrochemical performance of UA using
chemical determination of uric acid (UA) through excep- copper oxide nanostructures modified glassy carbon elec-
tional copper oxide nanostructures (CuO), as an effective trode CuO/GCE. The CV parameters were optimized at a
sensing probe. The copper oxide nanostructures were fabri- scan rate of 50 mV/s with −0.7 to 0.9 potential range, and
cated via an aqueous chemical growth method using sodium the UA response was investigated at 0.4 mV. PBS buffer of
hydroxide as a reducing agent, which massively hold hydro- pH 7.4 was exploited as a supporting electrolyte. The linear
xide source. Copper oxide nanostructures showed aston- dynamic range for UA was 0.001–351 mM with a very low
ishing electrocatalytic behavior in the detection of UA. limit of detection observed as 0.6 µM. The proposed sensor
Different characterization techniques such as XRD, FESEM, was successfully applied in urine samples for the detection
and EDS were exploited to determine crystalline nature, of UA with improved sensitivity and selectivity.
Keywords: copper oxide nanostructures, electrochemical
sensor, modified sensor, uric acid sensor
1 Introduction
* Corresponding author: Amber R. Solangi, National Centre of
Excellence in Analytical Chemistry, University of Sindh, 76080, The exceptional chemical and physical properties of
Jamshoro, Pakistan, e-mail: ambersolangi@gmail.com, nanomaterials make them a prominent aspirant to design
tel: +923322760143 an appropriate and improved sensing device, mainly
* Corresponding author: Fatemeh Karimi, Department of Chemical electrochemical and biosensors [1–7]. Various kinds
Engineering, Quchan University of Technology, Quchan, Iran,
of nanomaterials, e.g., metal and metal oxide nano-
e-mail: fkm024@gmail.com
* Corresponding author: Vinod Kumar Gupta, Center of Excellence
materials, viz, NiO, SnO, ZnO, Co3O4, MgO, semiconductor
for Advanced Materials Research, King Abdulaziz University, nanoparticles, as well as carbon- and silicon-based nano-
Jeddah, Saudi Arabia, e-mail: vinodfcy@gmail.com sized materials have been efficiently employed in construct-
Jamil A. Buledi, Saba A. Memon, Almas Fatima: National Centre of ing the wide varieties of electrochemical and biosensors
Excellence in Analytical Chemistry, University of Sindh, 76080, [8–14]. Among these metal oxide nanoparticles, CuO nano-
Jamshoro, Pakistan
structures exhibited exception properties that enable them
Sidra Ameen: National Centre of Excellence in Analytical Chemistry,
University of Sindh, 76080, Jamshoro, Pakistan; Department of to be utilized in different applications such as chemical
Chemistry, Shaheed Benazir Bhutto University, Shaheed sensing devices, magnetic storage media, catalysis, sensors,
Benazirabad, 67450, Sindh, Pakistan semiconductors, etc. [15]. Copper oxide is a transition metal
Arfana Mallah: M. A. Kazi Institute of Chemistry, University of Sindh, oxide and a potential aspirant with a narrow band gap of
76080, Jamshoro, Pakistan
1.2–1.5 eV, which makes it a brilliant candidate in electro-
Salima Malakmohammadi: Department of Chemical Engineering,
Quchan University of Technology, Quchan, Iran
chemical and photochemical applications [16]. CuO hold
Shilpi Agarwal: Center of Excellence for Advanced Materials outstanding applications and advantages such as wide anti-
Research, King Abdulaziz University, Jeddah, Saudi Arabia bacterial and antifungal activities, inhibits the development
Open Access. © 2021 Jamil A. Buledi et al., published by De Gruyter. This work is licensed under the Creative Commons Attribution 4.0
International License.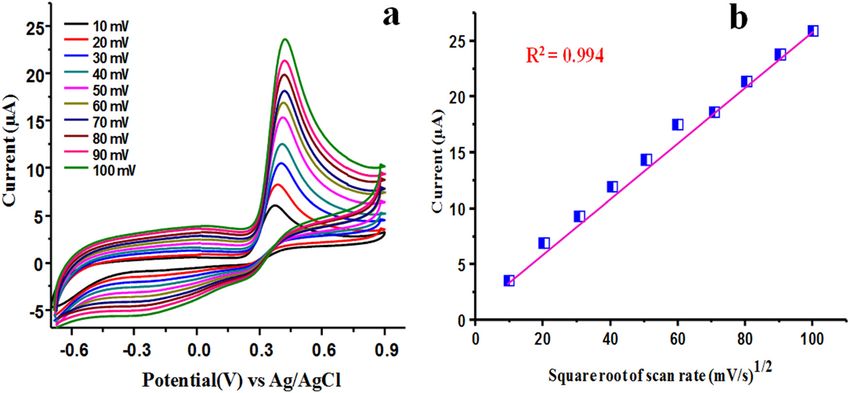
482 Jamil A. Buledi et al.
of microorganism, does not cause skin irritation, and safe low cost, great sensitivity, selectivity, and direct detection.
for humans when used externally at lower levels [17]. Biosensors have shown an immense contribution to the
Besides the antimicrobial and biocide properties, CuO sensing devices and flourished the concept of chemically
nanostructures hold excellent electrochemical properties modified electrodes [46]. The modification of electrodes via
[18]. CuO is a prominent material in the fabrication of dif- different chemicals has greatly enhanced their activity and
ferent electrodes for electrochemical sensing. It is widely larger surface-to-volume ratio which significantly increases
used in the modification of different electrodes such as the electron transfer mechanism toward the analyte and
glassy carbon electrode and carbon paste electrode, which electrode surface. The electro-catalytic performance of electro-
greatly enhances the sensing capability of electrode utilized chemical sensors can be enhanced by modifying nano-
for detection of different analytes [19]. The nanostructures composites on the electrode surface [47].
provide an important function to the sensing devices, which Various polymeric and nanomaterials have also been
mainly include catalytic properties of nanomaterials in electro- fabricated for the modification of electrodes to detect UA
chemical sensing, enhanced electron transfer between along with different essential compounds as well as con-
analyte and electrode surface, immobilization and labeling taminants, which are either beneficial or can severely
of biomolecules, and the capability of acting as reactant affect living beings. The materials for the modification of
[20–22]. Electrochemical sensors are widely employed for electrodes include aminobenzene sulfonic acid-modified,
the detection of environmental contaminants and organic glassy-carbon electrodes [48], TiO2-modified carbon-paste
pollutants, which badly cause lethal diseases [23–26]. The electrodes [49], poly(3,4-ethylenedioxythiophene)-modified
uric acid (UA) is one of the organic compounds named electrodes [50], dimethylfuran (DMF)-modified screen-printed
2,6,8-trihydroxy purine, which is the end-product of carbon electrodes [51], MnS2 nanosheet/carbon nanofiber-
purine metabolism or generally known as protein waste modified electrodes [52], L-cysteine self-assembled gold
[27]. The concentration of UA in the human body varies at electrodes [53], Pt nanocomposite-based beta-lactoglobulin
different concentrations, and the abnormal level of UA is a functionalized multiwall carbon nanotubes modified elec-
major reason for several diseases, for instance, hyper- trodes [54], penicillamine self-assembled gold electrodes
piesia, Lesch-Nyhan syndrome, and gout symptoms [28]. [55], AuNPs-modified glassy carbon electrodes [56], multi-
The UA content in normal humans is 149–416 µM in males wall carbon nanotubes/AuNPs composites modified elec-
and 89–357 µM in females. The maximum concentration of trodes [57], and ruthenium oxide nanoparticles modified
UA causes acidic changes to the body fluids, which severely electrodes [58].
affects the functioning of human cells and subsequently This work describes the synthesis of copper oxide
creates the risk of hematuria, renal failure, and leukemia. (CuO) nanostructures via an aqueous chemical growth
Henceforth, the determination of UA is very crucial in the method using sodium hydroxide as (OH) source. The
diagnosis of various diseases [29–32]. Generally, the as-prepared copper oxide nanostructures are then
methods such as spectroscopic [33], electroanalytical [34], employed for the determination of uric acid (UA) in the
capillary electrophoresis (CE) [35], chemiluminescence [36], presence of various interfering agents. CuO nanostructure-
and chromatographic techniques [37] are developed for the based electrochemical sensors showed good linear response
detection of UA. Nonetheless, these traditional tools con- over a wide range of UA. The proposed sensor offers a
sume too much time, require pretreatment of samples, and simple and practically feasible method, free from sample
are very costly. Among these determination tools, the elec- pretreatment, complicated experimental setup, prolonged
troanalytical methods are more reliable, cost-effective, analysis time, and signifies valuable advancement in the
simple, sensitive, and more convenient for sensing UA at field. Scheme 1 shows the oxidation of uric acid at a modi-
a very low level of concentration. The determination of fied electrode.
UA is also studied through electroanalytical methods
[38–44]. UA is one of the electroactive entities that can be
irreversibly oxidized into allantoin in an aqueous solution;
therefore, number of researchers have focused to quantify
2 Experimental work
UA in different parts of living beings through electro-
chemical methods via fabricating varieties of electro- 2.1 Reagents and solutions
chemical sensors which are proved to be a promising alter-
native to traditional methods [45]. In the diagnosis and Copper acetate and sodium hydroxide (E Merck, Germany),
treatment of different diseases, employing biosensors to urea, lactic acid, glucose, uric acid, ethanol, NaCl, and KCl
detect UA is very convenient because of their fast response, were purchased from Sigma-Aldrich. All the chemicals were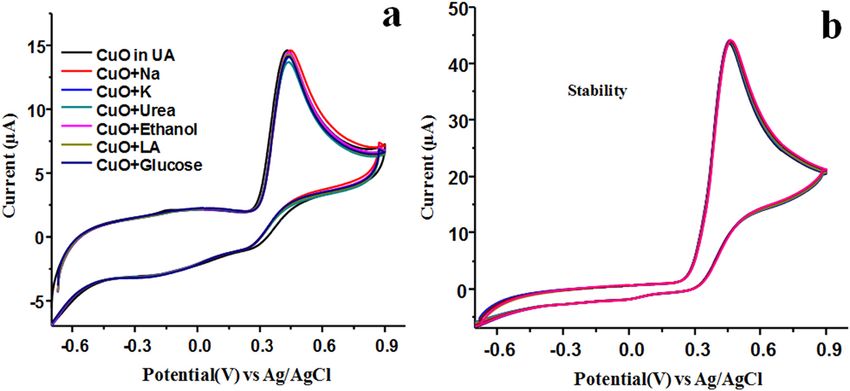
An improved non-enzymatic electrochemical sensor 483
Scheme 1: Electrochemical oxidation of uric acid at a modified electrode.
highly pure and used as received. All the glassware used in copper hydroxide Cu(OH)2 precipitates were annealed
the experiment were thoroughly washed and then rinsed at 500°C for 4 h to convert copper hydroxide into the
four times with deionized water. The glassware was dried pure CuO nanostructures.
at 100°C in an oven. 0.1 M PBS buffer solution of pH 7.4
was prepared in deionized water and was used as a sup- Ethical approval: The conducted research is not related to
porting electrolyte. 0.1 M uric acid stock solution was pre- either human or animal use.
pared in deionized water, and further dilution was followed
by the standard addition method for overall electrochemical
measurements. The characterization tools such as field
emission scanning electron microscopy (FESEM – JSM 7800F) 3 Results and discussion
and X-ray diffraction (XRD-7000-Shimadzu scientific
instruments) were used to investigate the morphology
and crystalline nature of prepared nanostructures, and 3.1 Characterization of CuO nanostructures
the electrochemical workstation model (Auto-Lab CHI-
760-USA with three-electrode systems) was used for the To determine the crystalline nature and the purity of pre-
determination of UA. pared nanostructures of CuO, the powder XRD technique
was utilized. Figure 1 displays the XRD diffraction pat-
terns of synthesized CuO nanostructures. The XRD pat-
tern shows the high intensity of the peaks with other
2.2 Synthesis procedure for CuO
supported peaks as well. The diffracted peaks at 2-degree
nanostructures
Copper oxide nanostructures were synthesized through
the aqueous chemical growth method reported in [59].
Copper acetate [Cu(CH3COO)2] precursor salt was used
with 0.1 M solution in 100 mL milli-Q water. Sodium
hydroxide was exploited to provide (OH) to copper
acetate that turned copper precursor into CuO nanostruc-
tures. A 0.1 M solution of NaOH was separately prepared
in Milli-Q water of 100 mL capacity and properly mixed
with 0.1 M copper acetate then left on stirring until the
solution become completely homogenized. After that, the
homogenized solution was covered with aluminum foil
and kept in a furnace heated up at 90°C for 4 h. After-
ward, the precipitates of copper hydroxide were taken out
and washed with deionized water to remove the rest of
the impurities. The hydroxide precipitates were then fil-
tered and dried at room temperature. Finally obtained Figure 1: XRD patterns of CuO nanostructures.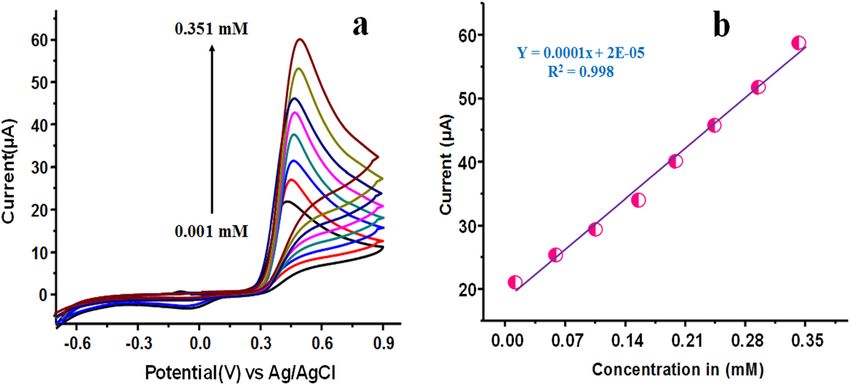
484 Jamil A. Buledi et al.
theta of 35.5 and 38.8, which displays the high crystalline 3.2 Modification of glassy carbon
nature of CuO nanostructures, and 32.5, 48.8, 53.6, 58.4, electrode (GCE)
61.6, 66.2, 68.1, and 72.5 diffraction peaks indicated the
monoclinic phase of CuO nanostructures. The procedure for the deposition of metal oxide nano-
All the diffraction peaks are indexed according to the structures on a glassy carbon electrode was followed via
JCPDS No 45-0937. No additional peak was observed in a reported study [60]. First, the glassy carbon electrode
the XRD pattern for commonly accruing impurities, e.g., was polished with 0.5 µm pore size aluminum powder,
Cu2O or Cu(OH)2 that confirmed the crystallinity of CuO washed with deionized water several times, and then
nanostructures with the monoclinic phase. The overall sonicated for 20 min in ethanol to make the surface
XRD patterns witnessed the high crystallinity and purity of the glassy electrode clear for modification. For the
of prepared nanostructures. The size of the prepared deposition process, 10 mg of CuO nanostructures was dis-
nanostructures was also calculated by using the Debye solved in 2.5 mL of deionized water, and simultaneously,
Sherer equation, and the average size of CuO nanostruc- 500 µL of 5% Nafion was added in it and sonicated for
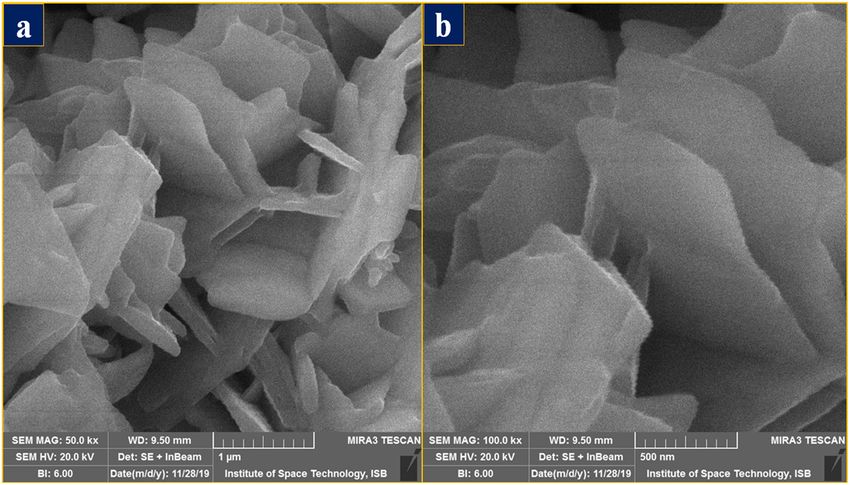
tures was found to be 18.4 nm. The morphology of pre- 20 min. Then, 5 µL of CuO nanostructures were deposited
pared nanostructures was inspected by FESEM. Sodium on a glassy carbon electrode following the drop-casting
hydroxide is a well-known compound that massively method. After modification, the glassy carbon electrode
holds OH source, which gives beautiful and uniform mor- (GCE) was dried at room temperature for 15 min. After-
phology to CuO nanostructures. A highly uniform nano- ward, the modified electrode was ready for electroche-
flakes morphology of fabricated nanostructures can be mical analysis. After modification, the electrode was
seen through FESEM images. The low- and high-resolu- labeled as copper oxide-modified glassy carbon electrode
tion FESEM images of CuO are manifested in Figure 2. (CuO/GCE), throughout the text.
The elemental composition of synthesized CuO nano-
structures was determined through energy dispersive
spectroscopy (EDS) analysis. The EDS spectra of CuO
nanostructures manifested the elemental composition of 3.3 Electrochemical measurements
copper and oxygen with a maximum percentage. The
overall EDS spectra are in good agreement with XRD The electrochemical workstation model (Auto-Lab CHI-
and FESEM images. 760-USA with three-electrode systems; glassy carbon,
Figure 2: FESEM (a) low- and (b) high-resolution images of CuO nanostructures.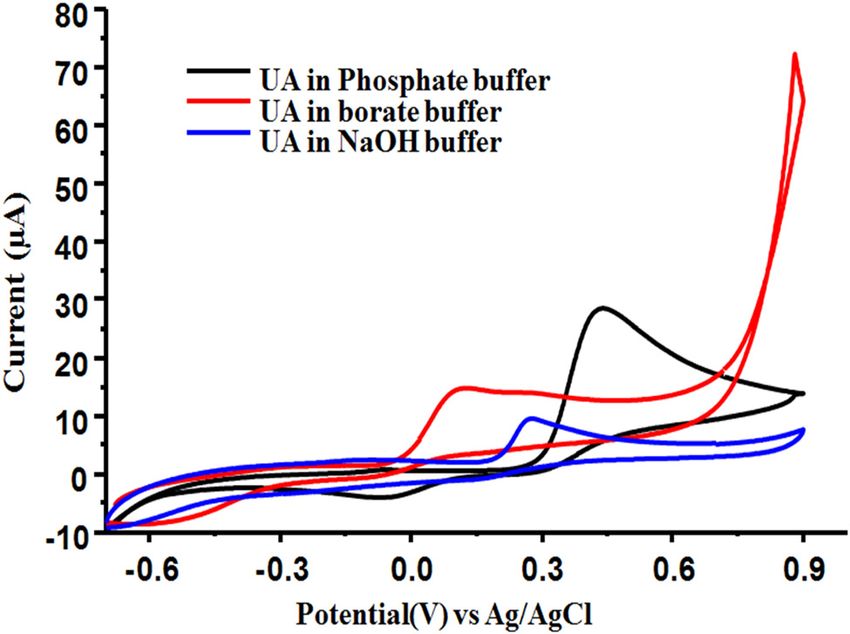
An improved non-enzymatic electrochemical sensor 485
platinum wire, and Ag/AgCl used as working, counter,
and reference electrode) was utilized for all the voltam-
metry measurements. Three-electrode-based conven-
tional assembly was used for the detection of UA with
5–10 mL capacity of an electrochemical cell. A 0.1 M stock
solution of UA was prepared in deionized water, and
similarly, 0.1 M solution of PBS buffer of pH 7.4 was
also prepared and used as a supporting electrolyte. UA
was diluted to various concentrations by dilution method
for electrochemical measurements. 0.1 mM solutions of
different interfering agents were prepared in deionized
water. The interfering substances such as urea, lactic
Figure 3: CV response of bare glassy carbon electrode and CuO/GCE
acid, ethanol, glucose, sodium chloride, and potassium
in 0.1 M PBS pH (7.4).
chloride were used for the interference study. To monitor
the selectivity of the CuO nanostructures sensor for UA,
electrode could be seen through mentioned figures. As it
an equal volume of all interferent substances and UA was
has been reported in the literature that the conductivity of
taken for voltammetry measurements. The buffer study
copper oxide nanoparticles could be enhanced by increas-
was carried out using three different buffers: borate buffer
ing the temperature above 300°C, in our present study,
at pH 8.0, NaOH at pH 12, and phosphate buffer at pH 7.4.
the synthesis of the temperature of CuO was 500°C; at this
CuO/GCE exploited as a working electrode having a dia-
temperature, the conductivity of particles could be signifi-
meter of 2 mm, and the electrochemical cell was com-
cantly increased, which increases the electron transfer
pleted when Ag/AgCl reference electrode and platinum
kinetics between the analyte and nanostructures. Another
(Pt) wire counter electrode combined with the working
way to increase the electron transfer rate is to synthesize
electrode. Before and after each measurement, the mod-
the smaller-sized nanoparticles with open morphology that
ified electrode was manually cleaned by a mechanical
can provide enhanced surface as an electrocatalyst and
polishing procedure using aluminum powder on the poli-
could improve the peak current response in the electro-
shing cloth. The analytical application of a proposed
chemical process for the fluent determination of the analyte.
sensor was carried out in urine samples using the recovery
method. Three different urine samples were collected from
healthy volunteers in the early morning.
3.5 Effect of supporting electrolyte
The supporting electrolytes perform the function of charge
3.4 Voltammetric measurements of uric acid transfer that’s why we have selected three different elec-
trolytes to investigate the influence of electrolytes on
Figure 3 displays the cyclic voltammogram response of a CV’s peak current response. The supporting electrolytes
bare electrode and CuO/GCE in 0.1 M PBS at pH 7.4 and included 0.1 PBS pH (7.4), 0.1 M NaOH pH (12), and 0.1
0.1 mM UA. Whenever bare glassy carbon electrode was borate pH (8.1). The buffer study was carried out from
employed for the determination of UA, an irregular peak neutral pH to highly basic medium at around pH (12),
shape as well as current response was observed, but a and as it is manifested in Figure 4, the highest peak cur-
highly intense peak at +0.4 V is recorded over a measured rent response recorded was 1 mM UA in 0.1 PBS pH (7.4);
potential range from −0.7 to 0.9 V when CuO/GCE elec- therefore, the phosphate buffer was selected as a sup-
trode was employed, which indicates excellent electro- porting electrolyte for further measurements.
catalytic properties of CuO toward oxidation of UA. The
capability of CuO nanostructures is based on the synth-
esis procedure for CuO which decides the size of particles
during preparation. We have exploited the aqueous 3.6 Effect of varying scan rate on peak
chemical growth method for the preparation of CuO nano- current response
structures, which not only controlled the size of particles
but gave them an excellent electrocatalytic capability for The kinetics of CuO/GCE was monitored to determine the
the determination of uric acid when compared with bare diffusion-controlled process; several scans were taken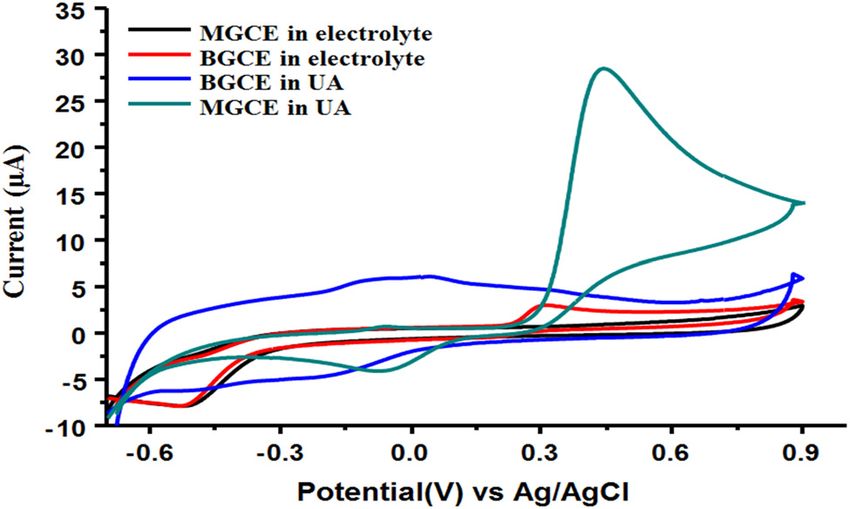
486 Jamil A. Buledi et al.
3.7 Calibration study of UA
Figure 6a indicates the calibration curve for the uric acid
detection, and it displays a linear response of peak cur-
rent vs UA concentration ranging from 0.001 to 351 mM.
The R2 value of linear response is found to be 0.998,
which describes the good analytical behavior of CuO/
GCE in the said linear range. The CV response at various
concentrations and its linear peak current response are
shown in Figure 6b. The LOD and LOQ of the proposed
method for the detection of UA were calculated to be 3.3
and 10 times the standard deviation of blank divided by
the slope of calibration curve [61] and was found to be 0.6
and 1.98 µM.
Figure 4: CV response of different supporting electrolytes; black line
shows 0.1 M PBS pH (7.4), the red line shows 0.1 M borate pH (9),
and the blue line shows 0.1 M NaOH pH (12).
3.8 Effect of interference, reproducibility,
and stability
and the CV’s response was supervised. Figure 5a shows To examine the specificity of the proposed sensor, dif-
the cyclic voltammogram of 1 mM UA solution at various ferent interferants such as urea, lactic acid, ethanol, glu-
scan rates. The oxidation process of UA at the modified cose, K+, and Na+ with 1 mM concentration were tested in
electrode was examined in increasing order, which presence of 1 mM of uric acid as shown in Figure 7a. From
reflects well-resolved anodic peak current response of the cyclic voltammogram Ipa of UA, there is no noticeable
UA by CuO nanostructures. The response of the pro- impact of common interfering agents in the detection of
posed sensor at varied scans is directly proportional UA was seen. A little change in the Ipa response of UA
to the peak current when investigated in 1 mM UA solu- was observed with a maximum relative standard devia-
tion; hence, the behavior of the proposed sensor was tion of 4.8% when foreign interferant urea was added.
diffusion-controlled. Figure 5b indicates the square Due to the possible reason that both UA and urea contain
root of scan rates (mV/s)1/2 vs anodic peak current with (–CO–NH) group that might be the cause of interference
R2 = 0.994. with the Ipa response of UA with a maximum relative
Figure 5: (a) CV response of 1 mM of UA at different scans and (b) anodic peak current vs square root of scan rate.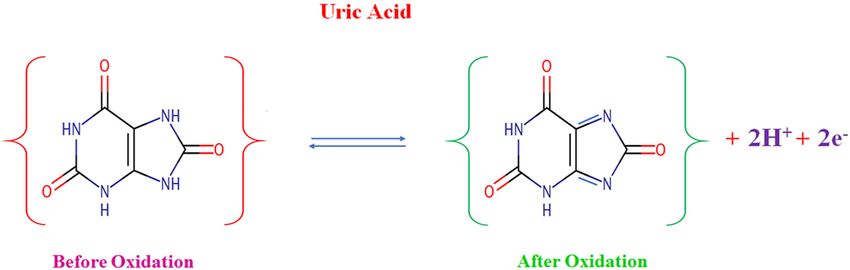
An improved non-enzymatic electrochemical sensor 487 Figure 6: (a) Calibration plot (peak current response vs UA concentration) ranges from 0.001 to 351 mM and (b) shows the linear response of peak current with R2 = 0.998 at scan rate 50 mV/s. Figure 7: (a) Effect of different interferents on the sensor response in 1 mM concentration of UA and (b) 25 repetitive runs of a proposed sensor in 3 mM UA to investigate the stability and reproducibility of the proposed sensor. standard deviation (RSD) of 4.8%. While other inorganic measurements, 25 repetitive runs were recorded in 3 mM ions and organic compounds did not make a significant concentration of UA shown in Figure 7b. A relative stan- change in the Ipa response of UA. For making the deter- dard deviation of 1.2% in the peak current difference was mination process of UA systematic, the (RSD) with (n = 4) recorded in this case, which confirms the excellent repro- for each interferant was tested against UA. However, ducibility and stability of CuO/GCE for the determination the maximum RSD was calculated to be (
488 Jamil A. Buledi et al.
Table 1: Results of real sample analysis standard concentration of UA whose concentration was
previously recorded. To know the effect of the matrix and
Sample Spiked Detected RSD (%) Recovery (%) estimating the concentration of UA from the calibration
(mM) (mM) (n = 3) curves, the recovery experiments were performed.
Urine 1 0 0.068 0.52 — The reproducibility of real samples, as well as spiked
0.5 0.503 0.21 100.6 standard concentration of UA, was also determined by
1 0.955 2.58 95.56 performing each measurement (n = 3), and a well-
1.5 1.54 1.67 102.6
resolved peak current response was recorded for three
Urine 2 0 0.135 1.76 —
0.5 0.523 1.80 104
different urine samples. Recovery values of all urine
1 0.989 2.01 98.9 samples are listed in Table 1.
1.5 1.45 1.22 96.45 The recovery percentage of UA varies from 95 to
Urine 3 0 0.335 1.81 — 104% with linear segments, which not only shows great
0.5 0.502 2.19 100.4 sensitivity but also acceptable percent recovery values. It
1 0.991 1.93 99.1
is clear from the results that the proposed sensor detected
1.5 1.52 2.39 101.2
UA in urine samples with great suitability and sensitivity.
Table 2 lists the comparison of the electrochemical per-
concentration of UA in three different urine samples. The formance of various sensors for the detection of UA. In
urine samples were collected from volunteers in the addition, most of the reported sensors are either compli-
morning to check the maximum concentration of UA. cated in use or more expensive which are not suitable for
The freshly collected urine samples were taken to the under-developing countries. While some of them are less
laboratory and were filtered using a 0.3-µm pore-sized expensive but showed poor sensitivity toward the detec-
filter paper. The urine samples were diluted to 0.1 phos- tion of UA. Our proposed sensor is being highly stable,
phate buffer making the ratio of 1:10 volume/volume, and cheap, and extremely sensitive toward the determination
then, the standard method was exploited to monitor the of the proposed analyte which makes it differentiated
accuracy of UA in urine samples by spiking them with a from other reported sensors.
Table 2: Comparison study of reported sensors for uric acid detection
Sensing materials and electrodes Method Electrolyte pH Scan rate Linear range LOD Ref.
Poly(3,4-ethylenedioxythiophene) CV Phosphate 7.4 50 1–20 1 [50]
modified glassy carbon electrode
Penicillamine self-assembled gold CV & DPV KCl — 100 — 1 [55]
electrode
L-Cysteine self-assembled gold electrode CV & DPV Phosphate 7.0 100 10–80 2 [53]
TiO2 Modified carbon paste electrode DPV Phosphate 8.0 10 200–1,500 12 [49]
Poly(p-aminobenzene sulfonic acid) CV & DPV Phosphate 7.0 100 1 × 10⁻⁵ to 1 × 10⁻⁴ 1.125 [48]
modified glassy carbon electrode
Ruthenium oxide nanoparticles glassy DPV Phosphate 7.0 — 3–7,586 0.67 [58]
carbon electrode
Azure A-interlinked multi-wall carbon CV & DPV Phosphate 7.0 — 0.5–50 0.028 [57]
nanotubes/gold nanoparticles
composite modified electrode
Gold nanoparticles modified glassy CV & DPV Phosphate 7.0 50 2.8–57.5 [56]
carbon electrode
β-lactoglobulin functionalized multiwall CV KCl 7.0 100 0.02–0.5 0.8 [54]
carbon nanotube/platinum
nanocomposite glassy carbon electrode
MoS2 nanosheet arrays/carbon CV & DPV KCl 7.0 100 1–60 1 [52]
nanofibers
CuO nano-rice modified electrode CV & DPV Phosphate 7.0 1–60 1.2 [62]
ZnO/graphene/ITO CV & DPV Phosphate 7.4 50 50–80 × 10−6 5 [63]
Nickel hexa-cyanoferrate/CPE CV & DPV Phosphate 9 100 2–12 × 10−6 1.8 [64]
Copper oxide nanostructures/modified CV Phosphate 7.4 50 0.001–351 × 10−3 0.6 Present work
glassy carbon electrodeAn improved non-enzymatic electrochemical sensor 489
4 Conclusion dimensional hexagonal boron nitride nanosheets composite
and ionic liquid for determination of N-hydroxysuccinimide in
In summary, highly discerning copper oxide nanostruc- water samples. J Mol Liq. 2020;310:113185.
[3] Nodehi M, Baghayeri M, Ansari R, Veisi H. Electrochemical
tures were synthesized through an efficient and reliable
quantification of 17α–Ethinylestradiol in biological samples
aqueous chemical growth method. The FESEM, XRD, and using a Au/Fe3O4@ TA/MWNT/GCE sensor. Mater Chem Phys.
EDS results confirm the suitable morphology, monoclinic 2020;244:122687.
phase structure with the average size of 18.4 nm, and [4] Golikand AN, Raoof J, Baghayeri M, Asgari M, Irannejad L.
maximum percent elemental composition of copper and Nickel electrode modified by N,N-bis(salicylidene)phenylene-
diamine (Salophen) as a catalyst for methanol oxidation in
oxygen. The prepared nanostructures were exploited for
alkaline medium. Russ J Electrochem. 2009;45:192–8.
electrochemical determination of uric acid via cyclic [5] Razmjou A, Asadnia M, Hosseini E, Habibnejad Korayem A,
voltammetry. The maximum anodic peak current response Chen V. Design principles of ion selective nanostructured
for UA was investigated at 0.4 V vs Ag/AgCl, and the membranes for the extraction of lithium ions. Nat Commun.
linear dynamic range was 0.001–351 mM with a very 2019;10:5793.
[6] Karimi F, Zakariae N, Esmaeili R, Alizadeh M, Tamadon AM.
low limit of detection observed as 0.6 µM. The proposed
Carbon nanotubes for amplification of electrochemical signal
sensor was then subjected to urine samples that sug-
in drug and food analysis; a mini review. Curr Biochem Eng.
gested the way as a diagnostic tool for uric acid determi- 2020;6:114–9.
nation with improved selectivity and sensitivity. [7] Amin S, Solangi AR, Hassan D, Hussain N, Ahmed J, Baksh H.
Recent trends in development of nanomaterials based green
Funding information: The authors are highly thankful analytical methods for environmental remediation. Curr Anal
Chem. 2020;16:1–11.
to the Higher Education Commission of Pakistan for pro-
[8] Asrami PN, Azar PA, Tehrani MS. Glucose oxidase/nano-ZnO/
viding funds under the project “6714/Sindh/NRPU/R&D/ thin film deposit FTO as an innovative clinical transducer:
HEC/HEC/2015.” a sensitive glucose biosensor. Front Chem. 2020;8:503.
[9] Asrami PN, Mozaffari SA, Tehrani MS, Azar PA. A novel impe-
Authors’ contribution: J. A. B. – synthesis of CuO nano- dimetric glucose biosensor based on immobilized glucose
flakes, electrochemical analysis, experimental work; oxidase on a CuO-Chitosan nanobiocomposite modified FTO
electrode. Int J Biol Macromol. 2018;118:649–60.
S. A. – writing – formatting of the research article;
[10] Karimi-Maleh H, Fakude CT, Mabuba N, Peleyeju GM,
S. A. M. – preparation of solutions, analysis/editing draft; Arotiba OA. The determination of 2-phenylphenol in the pre-
A. F. – interpretation of electrochemical data measure- sence of 4-chlorophenol using nano-Fe3O4/ionic liquid paste
ments and analysis; A. R. S. – conceptualization/data electrode as an electrochemical sensor. J Colloid Interface Sci.
interpretation/supervision/graphing; A. M. – characteriza- 2019;554:603–10.
[11] Fouladgar M, Novel A. Electrochemical CuO-nanostructure
tion of nanostructures/interpretation; F. K. – drafting and
platform for simultaneous determination of 6-thioguanine
language improvement; V. K. G. – editing/correcting draft/ and 5-fluorouracil anticancer drugs. Acta Chim Slov.
submission/correspondence to the journal; S. M., S. A. – 2020;67:701–9.
drafting and language improvement. [12] Fouladgar M. CuO-CNT nanocomposite/ionic liquid modified
sensor as new breast anticancer approach for determination of
Conflict of interest: All the authors declare that there is doxorubicin and 5-fluorouracil drugs. J Electrochem Soc.
2018;165:B559–64.
no conflict of interest.
[13] Arabali V, Ebrahimi M, Abbasghorbani M, Gupta VK, Farsi M,
Ganjali MR, et al. Electrochemical determination of vitamin C in
Data availability statement: All data generated or ana- the presence of NADH using a CdO nanoparticle/ionic liquid
lyzed during this study are included in this published modified carbon paste electrode as a sensor. J Mol Liq.
article. 2016;213:312–6.
[14] Buledi JA, Amin S, Haider SI, Bhanger MI, Solangi AR. A review
on detection of heavy metals from aqueous media using
nanomaterial-based sensors. Environ Sci Pollut Res.
2020;1–9. doi: 10.1007/s11356-020-07865-7.
References [15] Zhang Q, Zhang K, Xu D, Yang G, Huang H, Nie F, et al. CuO
nanostructures: synthesis, characterization, growth mechan-
[1] Hojjati-Najafabadi A, Ghasemi A, Mozaffarinia R. Magneto- isms, fundamental properties, and applications. Prog Mater
electric features of BaFe9.5Al1.5CrO19-CaCu3Ti4O12 nanocom- Sci. 2014;60:208–337.
posites. Ceram Int. 2017;43:244–9. [16] Devi AB, Moirangthem DS, Talukdar NC, Devi MD, Singh NR,
[2] Karimi-Maleh H, Karimi F, Malekmohammadi S, Zakariae N, Luwang MN. Novel synthesis and characterization of CuO
Esmaeili R, Rostamnia S, et al. An amplified voltammetric nanomaterials: Biological applications. Chin Chem Lett.
sensor based on platinum nanoparticle/polyoxometalate/two- 2014;25:1615–9.490 Jamil A. Buledi et al.
[17] Dagher S, Haik Y, Ayesh AI, Tit N. Synthesis and optical steel modified by gold and palladium nanoparticles for
properties of colloidal CuO nanoparticles. J Lumin. simultaneous determination of levodopa and uric acid.
2014;151:149–54. Talanta. 2016;158:42–50.
[18] Nations S, Long M, Wages M, Maul JD, Theodorakis CW, [32] Zou HL, Li BL, Luo HQ, Li NB. A novel electrochemical biosensor
Cobb GP. Subchronic and chronic developmental effects of based on hemin functionalized graphene oxide sheets for
copper oxide (CuO) nanoparticles on Xenopus laevis. simultaneous determination of ascorbic acid, dopamine and
Chemosphere. 2015;135:166–74. uric acid. Sens Actuators B Chem. 2015;207:535–41.
[19] Buledi JA, Ameen S, Khand NH, Solangi AR, Taqvi IH, [33] Yamaguchi T, Hasegawa K, Kamino S, Miyachi K, Tominaga H,
Agheem MH, et al. CuO nanostructures based electrochemical Fujita Y. Spectrophotometric determination of uric acid based on
sensor for simultaneous determination of hydroquinone and fading of o-hydroxyhydroquinonephthalein-palladium(II)-hexa-
ascorbic acid. Electroanalysis. 2020;32:1600–7. decyltrimethyl-ammonium complex. Anal Sci. 2007;23:223–6.
[20] Beitollahi H, Ardakani MM, Ganjipour B, Naeimi H. Novel 2,2′- [34] Strochkova E, Tur’yan YI, Kuselman I, Shenhar A. Simultaneous
[1,2-ethanediylbis(nitriloethylidyne)]-bis-hydroquinone voltammetric determination of uric and ascorbic acids in urine.
double-wall carbon nanotube paste electrode for simulta- Talanta. 1997;44:1923–8.
neous determination of epinephrine, uric acid and folic acid. [35] Lee H-L, Chen S-C. Microchip capillary electrophoresis with
Biosens Bioelectron. 2008;24:362–8. electrochemical detector for precolumn enzymatic analysis of
[21] Tabeshnia M, Heli H, Jabbari A, Moosavi-Movahedi AA. Electro- glucose, creatinine, uric acid and ascorbic acid in urine and
oxidation of some non-steroidal anti-inflammatory drugs on serum. Talanta. 2004;64:750–7.
an alumina nanoparticle-modified glassy carbon electrode. [36] Yu J, Ge L, Huang J, Wang S, Ge. S. Microfluidic paper-based
Turk J Chem. 2010;34:35–46. chemiluminescence biosensor for simultaneous determination
[22] Mazloum-Ardakani M, Beitollahi H, Taleat Z, Naeimi H, of glucose and uric acid. Lab Chip. 2011;11:1286–91.
Taghavinia N. Selective voltammetric determination of [37] Inoue K, Namiki T, Iwasaki Y, Yoshimura Y, Nakazawa H.
d-penicillamine in the presence of tryptophan at a modified Determination of uric acid in human saliva by high-perfor-
carbon paste electrode incorporating TiO2 nanoparticles and mance liquid chromatography with amperometric electro-
quinizarine. J Electroanal Chem. 2010;644:1–6. chemical detection. J Chromatogr B. 2003;785:57–63.
[23] Baghayeri M, Ghanei-Motlagh M, Tayebee R, Fayazi M, [38] Yan Q, Zhao F, Li G, Zeng B. Voltammetric determination of uric
Narenji F. Application of graphene/zinc-based metal-organic acid with a glassy carbon electrode coated by paste of multi-
framework nanocomposite for electrochemical sensing of As walled carbon nanotubes and ionic liquid. Electroanalysis.
(III) in water resources. Anal Chim Acta. 2020;1099:60–7. 2006;18:1075–80.
[24] Hasanpour F, Taei M, Fouladgar M. A voltammetric sensor [39] Tehrani RM, Ab Ghani S. Voltammetric analysis of uric acid by
based on spinel-structured copper ferrite nanoparticles mul- zinc-nickel nanoalloy coated composite graphite. Sens
tiwalled carbon nanotubes modified carbon paste electrode Actuators B Chem. 2010;145:20–4.
for determination of dacarbazine. Russ J Electrochem. [40] Ensafi AA, Taei M, Khayamian T. A differential pulse voltam-
2018;54:70–6. metric method for simultaneous determination of ascorbic
[25] Darabi R, Shabani-Nooshabadi M. NiFe2O4-rGO/ionic liquid acid, dopamine, and uric acid using poly(3-(5-chloro-2-
modified carbon paste electrode: an amplified electrochemical hydroxyphenylazo)-4,5-dihydroxynaphthalene-2,7-disulfonic
sensitive sensor for determination of sunset yellow in the acid) film modified glassy carbon electrode. J Electroanal
presence of tartrazine and allura red. Food Chem. Chem. 2009;633:212–20.
2020;339:127841. [41] Lin X, Li Y. Monolayer covalent modification of 5-hydroxytryp-
[26] Darabi R, Shabani-Nooshabadi M. Determination of acid green tophan on glassy carbon electrodes for simultaneous deter-
25 in the presence of brilliant blue in hair dye and wastewater mination of uric acid and ascorbic acid. Electrochim Acta.
using voltammetric sensor amplified with reduced graphene 2006;51:5794–801.
oxide/CoFe12O19-ionic liquid nanocomposite. Environ Technol [42] Lin X-Q, Jin G-P. Monolayer modification of glassy carbon
Innov. 2020;19:101020. electrode by using propionylcholine for selective detection of
[27] Huang L, Jiao S, Li M. Determination of uric acid in human urine uric acid. Electrochim Acta. 2005;50:3210–6.
by eliminating ascorbic acid interference on copper (II)-poly- [43] Zare H, Memarzadeh F, Ardakani MM, Namazian M, Golabi S.
dopamine immobilized electrode surface. Electrochim acta. Norepinephrine-modified glassy carbon electrode for the
2014;121:233–9. simultaneous determination of ascorbic acid and uric acid.
[28] Krupp MA, Chatton MJ, Tierney LM. Current medical diagnosis Electrochim Acta. 2005;50:3495–502.
and treatment 1986. United States: N. p.; 1986. Web. [44] Wang G, Meng J, Liu H, Jiao S, Zhang W, Chen D, et al.
[29] Babaei A, Babazadeh M. A selective simultaneous determina- Determination of uric acid in the presence of ascorbic acid with
tion of levodopa and serotonin using a glassy carbon electrode hexacyanoferrate lanthanum film modified electrode.
modified with multiwalled carbon nanotube/chitosan compo- Electrochim Acta. 2008;53:2837–43.
site. Electroanalysis. 2011;23:1726–35. [45] Huang J, Liu Y, Hou H, You T. Simultaneous electrochemical
[30] Hadi M, Rouhollahi A. Simultaneous electrochemical sensing determination of dopamine, uric acid and ascorbic acid using
of ascorbic acid, dopamine and uric acid at anodized nano- palladium nanoparticle-loaded carbon nanofibers modified
crystalline graphite-like pyrolytic carbon film electrode. Anal electrode. Biosens Bioelectron. 2008;24:632–7.
Chim acta. 2012;721:55–60. [46] Sinha A, Lu X, Wu L, Tan D, Li Y, Chen J, et al. Voltammetric
[31] Rezaei B, Shams-Ghahfarokhi L, Havakeshian E, Ensafi AA. An sensing of biomolecules at carbon based electrode interfaces:
electrochemical biosensor based on nanoporous stainless a review. Trends Anal Chem. 2018;98:174–89.An improved non-enzymatic electrochemical sensor 491
[47] Yang N, Chen X, Ren T, Zhang P, Yang D. Carbon nanotube [56] Shi Y, Wang J, Li S, Yan B, Xu H, Zhang K, et al. The enhanced
based biosensors. Sens Actuators B Chem. 2015;207:690–715. photo-electrochemical detection of uric acid on au nanoparti-
[48] Sadikoglu M, Taskin G, Demirtas FG, Selvi B, Barut M. cles modified glassy carbon electrode. Nanoscale Res Lett.
Voltammetric determination of uricAcid on poly(p-aminoben- 2017;12:455.
zene sulfonic acid)-modified glassy carbon electrode. Int J [57] Filik H, Avan AA, Aydar S. Simultaneous detection of ascorbic
Electrochem Sci. 2012;7:11550–7. acid, dopamine, uric acid and tryptophan with Azure A-inter-
[49] Ardakani MM, Sheikhmohseni MA, Beitollahi H, Benvidi A, linked multi-walled carbon nanotube/gold nanoparticles
Naeimi H. Simultaneous determination of dopamine, uric acid, composite modified electrode. Arab J Chem. 2016;9:471–80.
and folic acid by a modified TiO2 nanoparticles carbon paste [58] Zare HR, Ghanbari Z, Nasirizadeh N, Benvidi A. Simultaneous
electrode. Turk J Chem. 2011;35:573–85. determination of adrenaline, uric acid, and cysteine using
[50] Kumar SS, Mathiyarasu J, Phani KL, Jain YK, Yegnaraman V. bifunctional electrocatalyst of ruthenium oxide nanoparticles.
Determination of uric acid in the presence of ascorbic acid C R Chim. 2013;16:287–95.
using poly(3,4‐ethylenedioxythiophene)‐modified electrodes. [59] Amin S, Tahira A, Solangi A, Mazzaro R, Ibupoto ZH, Vomiero A.
Electroanalysis. 2005;17:2281–6. A sensitive enzyme-free lactic acid sensor based on NiO
[51] Metto M, Eramias S, Gelagay B, Washe AP. Voltammetric nanoparticles for practical applications. Anal Methods.
determination of uric acid in clinical serum samples using DMF 2019;11:3578–83.
modified screen printed carbon electrodes. Int J Electrochem. [60] Ibupoto ZH, Nafady A, Soomro RA, Sherazi STH, Abro MI,
2019;2019:6318515. Willander M. Glycine-assisted synthesis of NiO hollow cage-
[52] Wang WQ, Yue HY, Yu ZM, Huang S, Song SS, Gao X, et al. like nanostructures for sensitive non-enzymatic glucose sen-
Synthesis and application of MoS2 nanosheet arrays/carbon sing. RSC Adv. 2015;5:18773–81.
nanofibers for simultaneous electrochemical determination of [61] Amin S, Tahira A, Solangi A, Beni V, Morante J, Liu X, et al.
levodopa and uric acid. IEEE Sens J. 2019;19:5988–94. A practical non-enzymatic urea sensor based on NiCo2O4
[53] Zhao Y, Bai J, Wang L, Hong X, Huang P, Wang H, et al. nanoneedles. RSC Adv. 2019;9:14443–51.
Simultaneous electrochemical determination of uric acid and [62] Krishnamoorthy K, Sudha V, Kumar SMS, Thangamuthu R.
ascorbic acid using L-cysteine self-assembled gold electrode. Simultaneous determination of dopamine and uric acid using
Int J Electrochem Sci. 2006;1:363–71. copper oxide nano-rice modified electrode. J Alloy Compd.
[54] Han B, Pan M, Liu X, Liu J, Cui T, Chen Q. Electrochemical 2018;748:338–47.
detection for uric acid based on β-lactoglobulin-functionalized [63] Wang Q, Yue H, Zhang J, Gao X, Zhang H, Lin X, et al.
multiwall carbon nanotubes synthesis with PtNPs nano- Electrochemical determination of uric acid in the presence
composite. Materials. 2019;12:214. of ascorbic acid by hybrid of ZnO nanorods and graphene
[55] Wang L, Bai JY, Huang PF, Wang HJ, Wu XW, Zhao YQ. Selective nanosheets. Ionics. 2018;24:2499–507.
determination of uric acid in the presence of ascorbic acid [64] Hexa-Cyano HUUN. Electrochemical determination of uric acid.
using a penicillamine self-assembled gold electrode. Human urine using nickel hexa-cyano ferrate modified carbon
Microchim Acta. 2007;158:73–8. paste electrode. Int J Pure Appl Res. 2015;1:43–60.You can also read