Observation of metallic electronic structure in a single-atomic-layer oxide
←
→
Page content transcription
If your browser does not render page correctly, please read the page content below
Observation of metallic electronic structure in a single-atomic-layer oxide

                                                                           Byungmin Sohn,1, 2, ∗ Jeong Rae Kim,1, 2, ∗ Choong H. Kim,1, 2 Sangmin Lee,3 Sungsoo
                                                                          Hahn,1, 2 Younsik Kim,1, 2 Soonsang Huh,1, 2 Donghan Kim,1, 2 Youngdo Kim,1, 2 Wonshik
                                                                          Kyung,1, 2 Minsoo Kim,1, 2 Miyoung Kim,3 Tae Won Noh,1, 2, † and Changyoung Kim1, 2, ‡
                                                                                1
                                                                                    Center for Correlated Electron Systems, Institute for Basic Science, Seoul 08826, Korea
                                                                                 2
                                                                                    Department of Physics and Astronomy, Seoul National University, Seoul 08826, Korea
                                                                                          3
                                                                                            Department of Materials Science and Engineering and Research Institute
                                                                                            of Advanced Materials, Seoul National University, Seoul 08826, Korea
arXiv:2109.11090v1 [cond-mat.str-el] 23 Sep 2021

                                                                                                                 (Dated: September 24, 2021)
                                                                        Correlated electrons in transition metal oxides (TMOs) exhibit a variety of emergent phases. When TMOs
                                                                     are confined to a single-atomic-layer thickness, experiments so far have shown that they usually lose diverse
                                                                     properties and become insulators. In an attempt to extend the range of electronic phases of the single-atomic-
                                                                     layer oxide, we search for a metallic phase in a monolayer-thick epitaxial SrRuO3 film. Combining atomic-scale
                                                                     epitaxy and angle-resolved photoemission measurements, we show that the monolayer SrRuO3 is a strongly
                                                                     correlated metal. Systematic investigation reveals that the interplay between dimensionality and electronic
                                                                     correlation makes the monolayer SrRuO3 an incoherent metal with orbital-selective correlation. Furthermore,
                                                                     the unique electronic phase of the monolayer SrRuO3 is found to be highly tunable, as charge modulation
                                                                     demonstrates an incoherent-to-coherent crossover of the two-dimensional metal. Our work emphasizes the
                                                                     potentially rich phases of single-atomic-layer oxides and provides a guide to the manipulation of their two-
                                                                     dimensional correlated electron systems.

                                                   Introduction                                                                  into atomically thin flakes [11, 12].
                                                      With the size of electronic devices getting ever smaller,                     Epitaxial thin film growth can provide an alternative ap-
                                                   continued efforts to use different schemes, such as single-                   proach to constructing artificial 2D oxides and their devices
                                                   molecule transistors, are being made to overcome the quan-                    on a range of lattice-matched oxide substrates [13] or Si
                                                   tum limit. The discovery of graphene in 2004 and later van der                wafer [14]. Despite extensive efforts to realize the 2D elec-
                                                   Waals material groups suggests a new direction of atomically                  tronic oxides, most of the ultrathin oxide films exhibit a metal-
                                                   thin two-dimensional (2D) electronics [1–3]. From the funda-                  to-insulator transition in approaching the single-atomic-layer
                                                   mental scientific point of view, an ideal 2D system can provide               limit [15, 16], which is usually attributed to correlation-
                                                   a new physics distinct from that of three-dimensional (3D)                    driven Mott insulating phases or localization effects. Such
                                                   systems. Accordingly, the 2D van der Waals material groups,                   monotonous behavior detains functional spectrum of 2D ox-
                                                   associated devices [4], heterostructures [5], and Moiré super-               ides and limits the integration of the intrinsic physical prop-
                                                   lattices [6, 7] have been the most intensively studied subjects               erties into real devices. Therefore, the demonstration of a
                                                   in condensed matter physics in the past 15 years. However,                    metallic single-atomic-layer oxide is highly desired to extend
                                                   it is still quite difficult to obtain high-quality and large-size             the boundary of functionalities and application possibilities
                                                   flakes of van der Waals materials for practical applications.                 for oxide films.
                                                      On the other hand, the strongly correlated electron sys-                      Here, we report the metallic electronic structure of a
                                                   tem of transition metal oxides possesses numerous exotic                      single-atomic-layer oxide, a monolayer SrRuO3 (SRO) film
                                                   electronic phases with novel physical properties, e.g., high-                 with a single RuO2 atomic plane. The challenge in the
                                                   temperature superconductivity, Mott transition, and ferro-                    investigation of a single-atomic-layer oxide arises from the
                                                   magnetism [8–10]. Most of these phases appear in three-                       film’s vulnerability to extrinsic disorders. We employed
                                                   dimensionally connected oxide crystals such as perovskite                     angle-resolved photoemission spectroscopy (ARPES) mea-
                                                   oxides. These exotic properties in principle can be utilized                  surement to obtain the intrinsic electronic structure of a single
                                                   for device applications. In light of the direction in the 2D                  unit-cell (uc) SRO. The electronic structure of a monolayer
                                                   van der Waals materials research, transition metal oxides with                SRO is found to be strongly correlated. We unveil the origin
                                                   single-atomic-layer thickness can offer new functionalities in                of the correlated phase and demonstrate the tunable electronic
                                                   the nanometer scale by bridging correlated electron systems                   phase by charge modulation. This work adds new electronic
                                                   and the field of 2D materials. However, only a few oxides are                 states to the library of single-atomic-layer oxides which has
                                                   known to have van der Waals bonding and can be exfoliated                     been limited to insulators until now.

                                                                                                                                 Results
                                                   ∗   These authors contributed equally to this work.                           Fabrication of charging-free ultrathin heterostructures
                                                   †   Electronic address: twnoh@snu.ac.kr                                         In the study of ultrathin oxide films, transport measure-
                                                   ‡   Electronic address: changyoung@snu.ac.kr                                  ments are routinely performed to study the physical proper-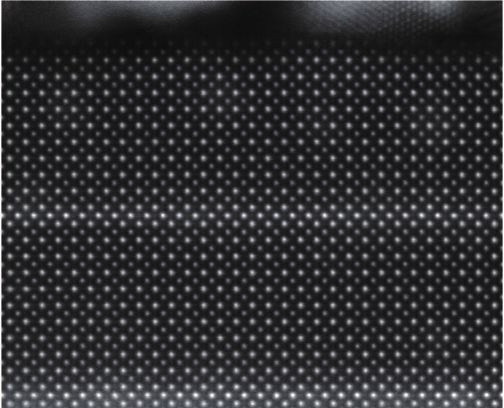
2
EF
a b c
n=4
n uc SR
O
n=3
Intensity (a.u.)
10
(buffuecr STO ▼
layer)
n=2
(cond4uuc SRO
cting la
yer)
n=1
STO (0 -0.15 0 0.15
substra
01) n=0
te
-2 -1.5 -1 -0.5 0
Sr Ru Ti O
E - EF (eV)
d e f
12 Ru Ti
STO 8
Distance (Å)
4 Ti
SRO
0 Ru
STO -4 Ti Sr Sum
-8
SRO
-12
2 nm STO
Intensity (a.u.)
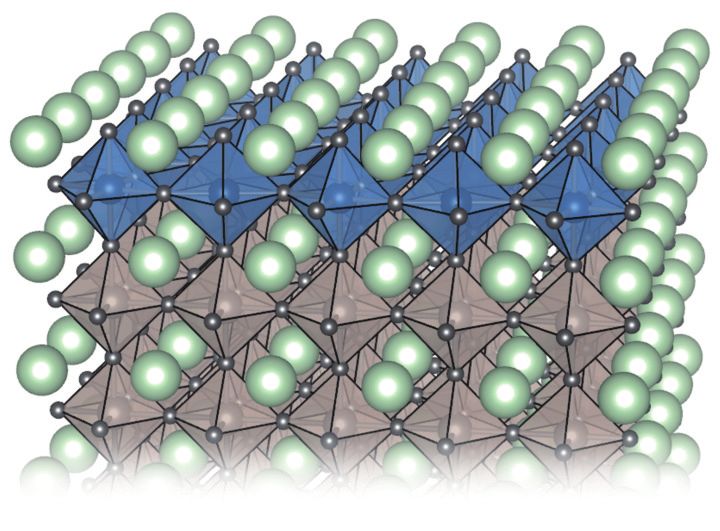
FIG. 1. Observation of a metallic single-atomic-layer oxide in charging-free ultrathin SrRuO3 (SRO) heterostructures. a, A schematic
of a monolayer SRO grown on a (001)-oriented SrTiO3 (STO) layer. b, A schematic of a charging-free ultrathin SRO heterostructure composed
of 4 unit-cell (uc) SRO layer (conducting layer), 10 uc STO layer (buffer layer), and n uc ultrathin SRO layer, sequentially grown on a STO
(001) substrate. The conducting layer prevents the charging effect during the photoemission measurement. The buffer layer decouples the
electronic structure of the ultrathin SRO layer from that of the conducting layer. c, Angle-integrated photoemission spectra from charging-free
ultrathin SRO heterostructures. Energy distribution curves (EDCs) are integrated in the range of −0.6 Å−1 5 ky 5 0.6 Å−1 and kx = 0.
n indicates the number of SRO layers. The Fermi edge is persistently seen down to the monolayer. The inset shows a magnified view of
the monolayer spectrum near the Fermi level. A hump marked with a red inverted triangle appears at a high-binding energy in a monolayer
SRO and will be discussed in Fig. 5d. d, Atomic-scale imaging of the charging-free monolayer SRO heterostructure obtained by high-angle
annular dark-field scanning transmission electronic microscopy (HAADF-STEM). e, HAADF-STEM intensity across the monolayer SRO and
adjacent interfaces of the yellow dashed box in (d). f, Atomic-scale energy-dispersive X-ray spectroscopy (EDS) analysis on the charging-free
monolayer SRO heterostructure.
ties. However, transport properties can be sensitive to extrin- There have been several ARPES studies on ultrathin epitax-
sic effects such as disorder [17]. Such extrinsic effects tend ial transition metal oxide films [20–24]. For the case of SrIrO3
to be more pronounced for films with reduced thicknesses due and LaNiO3 , the studies have even reached the monolayer
to the increased scattering from interfaces and surfaces [18]. limit, for which insulating electronic structures have been ob-
More importantly, transport measurements require a conduct- served. Here, we note the similarity between monolayer ox-
ing path in the film over a macroscopic scale, which is not gen- ide films and their quasi-two-dimensional counterparts; both
erally guaranteed. Particularly, the conducting channel can Sr2 IrO4 [25] and NdSrNiO4 [26] are antiferromagnetic insu-
be broken near the step-edges of substrates [19]. In that re- lators. Based on this analogy, we chose a single-atomic-layer-
gard, ARPES, which detects electrons with periodic motion thick SRO film (Fig. 1a) whose electronic ground state is cur-
and does not require macroscopic connectivity, can be an ef- rently under debate [27, 28]. The monolayer SRO can be also
fective tool to study the intrinsic electronic property of ultra- regarded as a two-dimensional analogue of a metallic single
thin oxide films. layer perovskite Sr2 RuO4 which has been intensively studied
3

                       Cut 1                     Cut 2                                                              Sc
         a                                                                                b    α
                                                                                                      γ                 he
                                                                                                                          m
                      3 uc                                                      4 uc                                       at
                                                              α                                                               ic
               0.8
                                                                                                      β                            DF
                                                                                                                                      T
                                                            β′                                                dyz(zx)                           VHS
               0.4                                                                              dxy                                           + 20 meV

                                                       Γ                    X
ky (Å-1)

                                                                  β
               0.0
                                                                                                                                                VHS

              -0.4

              -0.8
                                                       X                    М                                 Γ
                                                                                                                                                 VHS
                      2 uc                                                      1 uc           X                                              - 20 meV

                     -1.2      -0.8       -0.4    0.0       0.4       0.8           1.2
                                                 kx (Å )
                                                       -1                                             М
                                                                                                                          β
         c                                                                                                                         α
                                                                                                                                   ▼
                                                                                                ▼
                                                                  ▼
                                      ▼

                     4 uc                         3 uc                           2 uc                        1 uc
                       Γ                  М        Γ                  М            Γ                  М        Γ                          М
                0
E - EF (eV)

              -0.1

          -0.2

          -0.3
                      0.0 0.4 0.8          1.2    0.0 0.4 0.8         1.2         0.0 0.4 0.8         1.2    0.0 0.4 0.8                  1.2
                                                                          k|| (Å-1)

FIG. 2. Fermi surfaces (FSs) of ultrathin SRO films. a, FSs of ultrathin SRO layers with specified thickness. Angle-resolved photoemission
spectroscopy (ARPES) data were taken at 10 K with He-Iα light (21.2 eV), and integrated within EF ± 10 meV. b, Energy isosurfaces of
two-dimensional (2D) SRO calculated by density functional theory (DFT) calculation, together with schematic energy isosurfaces. DFT results
are color-coded for dxy (blue) and dyz,zx (red) orbital contributions to the bands. The VHS represents Van Hove singularity. c, Γ-M high-
symmetry cuts (Cut 1 in (a)) and momentum distribution curves (MDCs) at EF . The inverted triangles next to MDCs represent peaks of the α
band. Both α and β bands are resolved in 1 uc.

for its unconventional superconductivity [29] and recently for                  the measured spectra. By introducing a current path of 4 uc-
magnetism [30].                                                                 thick SRO layer (conducting layer), we successfully removed
                                                                                the charging effect in the measurements of ultrathin SRO (Fig.
  We grew high-quality and charging-free ultrathin SRO het-
                                                                                1c) [See Supplementary Materials (SM) for comparison of the
erostructures with various thicknesses. Figure 1b shows a
                                                                                ARPES data with and without the conducting layer]. The
schematic of the SRO heterostructure which consists of 4 uc
                                                                                10 uc STO buffer layer (4 nm thickness) decouples the elec-
SRO layer, 10 uc SrTiO3 (STO) buffer layer, and n uc ultrathin
                                                                                tronic structure of the topmost ultrathin SRO from that of the
SRO layer (n uc SRO), sequentially grown on an STO (001)
                                                                                conducting layer [See SM for details].
substrate. In ARPES measurements on ultrathin films, escap-
ing photoelectrons can cause a charging effect which distorts                     Scanning transmission electron microscopy (STEM) pro-
4

        a              Γ                         X                     b X                                 Γ                      X X                       Γ                         X
              0.1                                                      0.1
                                                                               EDC
                                                                               γβ
              0.0                                                     0.0
E - EF (eV)

              -0.1                                                    -0.1

         -0.2                                                         -0.2

         -0.3                                               dxy       -0.3
                                                            dyz(zx)
                            1 uc                                               4 uc                                        3 uc          2 uc                                  1 uc
         -0.4                                                         -0.4
                       0.0          0.4          0.8 DOS (a.u.)              -0.8     -0.4             0.0          0.4       0.8 -0.8          -0.4       0.0           0.4      0.8
                                   ky (Å )
                                        -1
                                                                                                 ky (Å )       -1
                                                                                                                                                         ky (Å )-1

                                                                                               d                              Spin majority              Spin minority
               c
                                                                                                           0.0
                     0.0
                                                                                                      -0.5
                                                                                             E - EF (eV)
                                                        ▼
                                             ▼
       E - EF (eV)

                                                                                                           -1.0
                     -0.1
                                                                                                           -1.5
                               4 uc              3 uc       2 uc       1 uc                            -2.0         4 uc          3 uc            2 uc               1 uc
                -0.2
                                                 Intensity (a.u.)                                                                  Intensity (a.u.)

FIG. 3. Thickness-driven electronic and magnetic transition in ultrathin SRO layers. a, A density functional theory (DFT)-calculated
energy√versus√momentum (E-k) dispersion of 2D SRO along Γ-X high-symmetry line. Open trangles and squares indicate replica bands due
to the 2 × 2 octahedral rotation. b, High-symmetry cuts (Γ-X) with a specified thickness of SRO layers along the kx = 0 line. Coherent
β and γ band dispersions are observed in 4 and 3 uc, whereas only an incoherent γ is observed in 2 and 1 uc. c, Thickness-dependent EDCs
near the X point, (kx , ky ) = (0, ±0.75), marked with a red dotted line in b. Inverted triangles indicate coherent peaks from the γ band. The
coherent peaks systematically disappear as the thickness is reduced. d, Thickness-dependent spin-resolved EDCs measured at 10 K near Γ.
The spin majority and minority spectra for 4 and 3 uc films show a difference, showing net spin polarization, whereas the difference vanishes
for 2 and 1 uc films.

vides atomic-scale visualization of our charging-free ultrathin                               amine the electronic ground state of the ultrathin SRO film.
SRO heterostructures. Figure 1d displays a cross-sectional                                    We performed in-situ ARPES on heterostructures with n = 0,
high-angle annular dark-field STEM (HAADF-STEM) image                                         1, 2, 3, and 4 uc. Figure 1c shows angle-integrated photoe-
with STO [100] zone axis. To image the monolayer SRO, we                                      mission spectra of the heterostructures near Γ. Definite Fermi
deposited an additional 10 uc STO capping layer to protect                                    edges survive down to the monolayer, showing the persistent
the monolayer SRO. The conducting layer, buffer layer,                                        density of states (DOS) at the Fermi level. A pronounced
monolayer SRO, and capping layer are well organized in the                                    spectral weight is observed near the Fermi level for 4 and
preferred order. In the plot of HAADF-STEM intensity across                                   3 uc samples, consistent with previously reported thick film
the monolayer SRO and adjacent interfaces shown in Fig. 1e,                                   ARPES results [31]. As the thickness is reduced, the spectral
an abrupt Ru peak out of the surrounding Ti peaks is evident.                                 weight shifts toward the high-binding energy side, resulting in
The abrupt SRO/STO interfaces are further corroborated                                        weak but definite spectral weight at the Fermi level for the 1 uc
by energy-dispersive X-ray spectroscopy (EDS) analysis in                                     film. While the underlying mechanism for the spectral weight
Fig. 1f. Taken together, we confirmed that our ultrathin                                      transfer needs further investigations, we can clearly observe a
SRO layers possess lateral uniformity and atomically sharp                                    metallic electronic ground state for the monolayer SRO.
interfaces, which will allow for a systematic ARPES study.
                                                                                                 In order to better understand the metallic behavior of the
                                                                                              monolayer SRO film in view of the electronic structure, we in-
Electronic structures of atomically-thin SRO
                                                                                              vestigate the thickness-dependent evolution of the Fermi sur-
        Using the charging-free heterostructures in Fig. 1b, we ex-                           faces (FSs). FSs plotted in Fig. 2a are consistent with the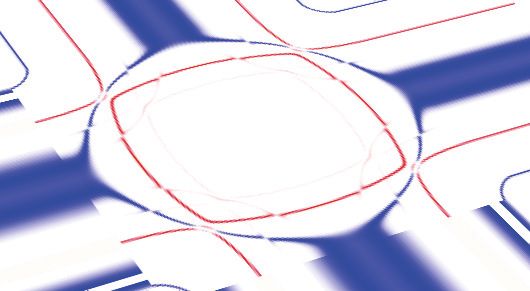
5

angle-integrated photoemission results in Fig. 1c, showing              a                             dyz(zx)                     b
metallic FSs down to the monolayer limit. Here, following                                                        Quantum                   E
the convention used for Sr2 RuO4 [32], we label the three FSs                                                   confinement
of the t2g bands as α, β, and γ as shown in Fig. 2b. The FS                                                          dxy
maps of 4 and 3 uc films in Fig. 2a show that α and β bands                 z                                                    kx        X               ky
are sharp while the γ is broad. For the thinner 2 and 1 uc films,      y        x
α and β bands are also slightly broadened. Otherwise, FSs do                                                        VHS
not show a qualitative change as the thickness varies.
   Density functional theory (DFT) calculation of a monolayer
SRO in Fig. 2b reproduces the characteristic band structure of
                                                                        c       without correlation             d
                                                                                          E                         E                  E
experimentally observed FSs [See “Methods” for DFT calcu-                       dyz(zx)        dxy                         dxy                 dxy
                                                                           2D
lation of a monolayer SRO]. The van Hove singularity (VHS)
                                                                                                                           spin dn          correlation-driven
of the γ band is located at the X point. The broad spectral                                                                                 incoherency
                                                                           3D
weight at the X point on the kx = 0 line (See Fig. 2a) indi-                                                                                     EF
cates that the VHS lies close to the Fermi level. We would like
to note that the spectral weight near the X point on the ky = 0                                                            spin up             e--doped
line is weak due to the matrix element effect; our ARPES data
were measured with He Iα light mostly polarized in the verti-                                                       trilayer & above       monolayer
cal direction [33].                                                                                                  (Ferromagnet)
   To look at more detailed thickness-dependent evolution of
                                                                    FIG. 4. Interplay between dimensionality, electronic correlation,
the α and β bands which are composed of dyz and dzx or-             and magnetism. a,b, Schematic illustrations of (a) quantum con-
bitals, we plot in Fig. 2c Γ-M high-symmetry cut (‘Cut’ 1 in        finement (QC) effect and (b) VHS. The out-of-plane orbitals, dyz
Fig. 2a) data and momentum distribution curves (MDCs) at            and dzx , are mainly involved in the QC effect. The in-plane orbital,
the Fermi energy. We observe only two bands for the 2 and           dxy , is responsible for the high density of states (DOS) at the Fermi
1 uc films despite the three t2g orbitals. The two dispersive       level due to the VHS. c,d, Schematic illustration of (c) electronic
bands are attributed to α and β bands located near kk = 0.6         structures without correlation and (d) thickness-dependent correla-
and 0.8 Å−1 , respectively, while the γ band can be counted        tion effect on dxy band. The red dotted line represents the dyz and
                                                                    dzx orbital partial DOS for bulk SRO. The high DOS at the Fermi
out as we will discuss later. The α band, marked with an
                                                                    level from the dxy VHS gives rise to a strong electronic correlation.
inverted triangle in the MDC plot in the upper panel, is re-        In thick films (more than 3 uc), the DOS at the Fermi level can be
solved at the Fermi level regardless of the thickness [See SM       significantly reduced via ferromagnetic spin splitting. In the mono-
for the analysis on the β band]. Putting it all together, the α     layer SRO case, the spin splitting is inhibited due to the QC effect.
and β bands are dispersive at all thicknesses but their spectral    As a result, the dxy DOS at the Fermi level is reduced via opening a
functions gradually become less coherent as the thickness is        soft gap [35]. When VHS is far from the Fermi level, the coherent
reduced.                                                            states can be recovered.
   We now turn our attention to the γ band to understand the
origin of the thickness-dependent spectral weight transfer to
high-binding energy in ultrathin SROs. The VHS of the γ             served in, for example, under-doped cuprates above its super-
band at the X point lies close to the Fermi level which leads to    conducting dome [34]. Considering what we learned from the
the high DOS (Fig. 3a). Since the high DOS from a VHS can           EDCs, it can be deduced that the thickness-dependent elec-
significantly affect the physical properties, it is worth exam-     tronic transition is closely related to the strong correlation in
ining the electronic band structures near the VHS. Figure 3b        the γ band. Therefore, we may refer the electronic state of
shows the E-k dispersions along the kx = 0 line, indicated as       monolayer SRO to an orbital-selectively correlated and inco-
‘Cut 2’ in Fig. 2a. In addition to the β band, a coherent heavy     herent metal. The orbital selective correlated metallic behav-
γ band is clearly observed in the 4 and 3 uc data whereas the       ior should be closely related to the orbital selective Mott phase
2 and 1 uc SROs data show only an incoherent γ band. As a           found in Ca2−x Srx RuO4 [35]
side note, we attribute the weak β band to the matrix element          Finally, we discuss the magnetism in these films. While
effect as α and β bands remain consistently coherent at the         bulk SRO is ferromagnet [36], its quasi-2D analogue,
Fermi level in the Γ-M (‘Cut 1’ in Fig. 2c) and the Γ-X data        Sr2 RuO4 , does not show ferromagnetism [29]. It implies
along the ky = 0 line [See SM for details] [33].                    a possible magnetic transition in the ultrathin SRO films.
   The thickness-dependent evolution of the γ band can be           We investigated the spin polarization of ultrathin SRO films
better seen in energy distribution curves (EDCs) near the X         by performing spin-resolved ARPES (SARPES). Figure 3d
point, (kx , ky ) = (0, 0.75), shown in Fig. 3c. The coher-         shows spin-resolved EDCs measured at 10 K near Γ. In the
ent peak marked by the inverted triangle appears as a kink in       high-binding energy region, we observe a sizable difference
the EDCs in the 4 and 3 uc SRO data. On the other hand,             in the intensity between majority and minority spins for 4 and
the coherent peak disappears in the 2 and 1 uc SRO data, in         3 uc SRO films, indicating ferromagnetism [24]. However,
which the spectral weight is believed to be transferred to the      the ferromagnetism is not observed for the 2 and 1 uc SRO
incoherent band. Such behavior is reminiscent of the strongly       films for which no difference is seen in the SARPES data.
correlated metallic states in the vicinity of a Mott state as ob-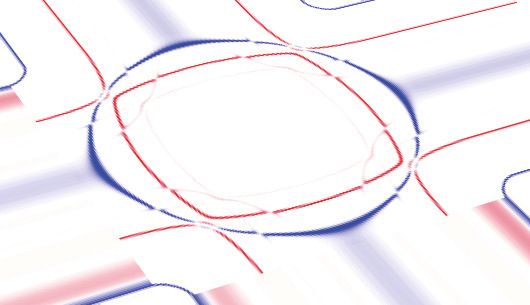
6

             a                         Pristine                            K-dosed 1 uc        SRO films. Both coherent-to-incoherent and ferromagnetic-
                                                                                               to-nonmagnetic transitions start to occur at the 2 uc thickness,
                           1.0
                                                              X                    М           which suggests a strong interplay between electronic correla-
                           0.8                                                                 tion and magnetism.
                           0.6                                                                    In 3D cubic SRO, three t2g orbitals (dxy , dyz , and dzx ) are
         kx (Å-1)

                                                                                               degenerate and each one of them has a VHS. The octahedral
                           0.4                                                                 rotation as well as the epitaxial strain slightly breaks the de-
                           0.2                                                                 generacy, resulting in a lower energy level for the dxy VHS, as
                                                              Γ                    X           schematically shown in the Fig. 4c [38, 39]. The QC effect se-
                       0.0
                                                                                               lectively reconstructs the electronic structure of dyz and dzx
                      -0.2                                                                     orbitals. In the 2D monolayer limit, the dyz and dzx bands
                                                                                               have strong 1D singularities at the band edges and reduced
                                         -0.8     -0.4        0.0      0.4        0.8
                                                                                               DOS at the Fermi level (‘2D’ in Fig. 4c). This reduction in the
                                                         ky (Å )  -1
                                                                                               Fermi-level DOS induces the thickness-driven ferromagnetic-
             b                      Pristine                                  K-dosed 1 uc     to-nonmagnetic transition between 3 and 2 uc SRO films [37].
                                                                                  γ               The high DOS from the dxy VHS (Fig. 4c) can enhance
                                                                                               the effective electron correlation, e.g., Coulomb interaction
                 0.0
   E - EF (eV)

                                                                                               and Hund’s coupling [40]. The instability from the high
                                                                                               DOS at the Fermi level can be avoided by splitting the dxy
             -0.2                                                                              band into spin majority and minority bands as shown for 4
                                                                                               and 3 uc SRO (left panel, Fig. 4d). However, without the
                                                                                               ferromagnetic spin splitting, the dxy band in 1 and 2 uc films
             -0.4                                                                              retains the VHS, and thus the high DOS near the Fermi level.
                                         -0.8     -0.4        0.0      0.4        0.8          Then, the strong correlation drives monolayer SRO system
                                                         kx (Å-1)                              to an incoherent metallic phase (right panel, Fig. 4d). The
                                                                                               bilayer SRO case is presumably at the boundary between the
                 c                    (kx, ky) = (0, 0.75)    d           (kx, ky) = (0, 0)   coherent ferromagnetic metal and incoherent correlated metal.
                                                         ▼
                                      K-dosed µ2                            K-dosed µ2         Control of the 2D correlated electronic phase
                 Intensity (a.u.)

                                                                                                  With the underlying mechanism for the thickness-driven
                                                                       ▼    K-dosed            electronic transition understood, we attempt to exploit the
                                                         ▼
                                          K-dosed
                                                                                               mechanism to control the electronic phase of the monolayer
                                                                                               SRO. As the key to the incoherent-metallic phases is the VHS,
                                                                            Pristine           tuning the chemical potential is likely to break the correlated
                                          Pristine                                             phase (right panel, Fig. 4d). We used in-situ K dosing to
                                                                                               dope electrons into the incoherent metallic phase of mono-
                             -0.6 -0.4 -0.2              0 -2 -1.5 -1 -0.5 0                   layer SRO. Figure 5a shows FS maps of monolayer SRO be-
                                                      E - EF (eV)                              fore and after K dosing. The kF of the β band changes from
                                                                                               0.52 to 0.60 Å−1 along the kx = 0 line, indicating that elec-
FIG. 5. Incoherent-to-coherent crossover in monolayer SRO. a,                                  trons are doped into the system [see SM for E-k dispersions
FS maps of pristine and K-dosed monolayer SROs measured at 10 K.                               and MDCs]. Overall, the K-dosed FS feature is much better
b, Band dispersions of pristine and K-dosed monolayer SROs along                               resolved in comparison with the result of the pristine case.
the ky = - 0.2 Å−1 line (red dotted line in a). c,d, EDCs from pris-                             The most distinct change occurs in the γ band. Figure 5b
tine and K-dosed monolayer SRO films near the X and Γ points nor-                              shows E-k band dispersions along the kx = -0.2 Å−1 line be-
malized by E = - 0.6 and - 2 eV, respectively. With K dosing, a                                fore and after K dosing. The strongly correlated γ band has
quasi-particle peak reappears near the Fermi level, while the hump
                                                                                               never been sharply resolved in the pristine state but it appears
peak in the high-binding energy region disappears, as marked by in-
verted triangles. ‘K-dosed×2’ indicates twice the dosing amount of
                                                                                               coherent with a clear dispersive feature after K dosing. The γ
‘K-dosed’.                                                                                     FS became a hole pocket, which indicates the VHS is now lo-
                                                                                               cated below the Fermi level (Fig. 2b). This is consistent with
                                                                                               our scenario proposed above; the electron doping moves the
                                                                                               VHS away from the Fermi level, and consequently the spectral
Dimensionality-driven electronic transition                                                    weight is transferred from the incoherent to coherent peaks.
   Note that the different behaviors between in- and out-of-                                   EDCs in Fig. 5c show spectral-weight transfer as well as the
plane orbital bands ascertains the quantum confinement (QC)                                    emergence of the coherent quasi-particle peak.
effect of ultrathin SRO films [37]; the reduced dimensionality                                    We also noticed that the high-binding hump-like peak at
affects only the out-of-plane orbital dyz and dzx bands (Fig.                                  E = -1.5 eV, which is only observed in monolayer SRO (Fig.
4a). We also notice that there is a remarkable coincidence                                     1c), disappears after K dosing as shown in Fig. 5d. A
between the band coherence and ferromagnetism in ultrathin                                     similar hump-like peak at high-binding energy has been re-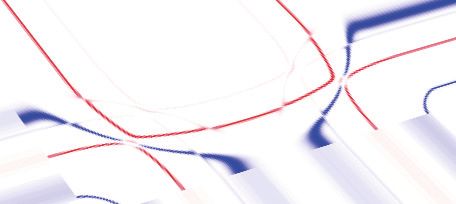
7

ported in photoemission spectroscopy results of CaRuO3 and         substrate was dipped in deionized water and sonicated for
(Ca,Sr)VO3 [41, 42] and was attributed to a strong electronic      30 minutes. The substrate was subsequently in-situ annealed
correlation effect. When the Coulomb interaction between           in the growth chamber, and the annealing temperature,
electrons increases, a coherent peak near the Fermi level is       background oxygen partial pressure, and annealing time were
expected to be suppressed because its spectral weight is trans-    1, 050 ◦ C, 5.0 ×10⁻⁶ Torr, and 30 minutes, respectively.
ferred to the incoherent lower Hubbard band [42–44]. Thus,         Polycrystalline SrRuO3 and SrTiO3 targets were ablated us-
we believe that the appearance of the high-binding energy          ing a KrF excimer laser. For the growth of SrRuO3 films, the
hump with decreasing thickness is also a sign of enhanced          substrate temperature, background oxygen partial pressure,
electronic correlation in thinner films. Disappearance of the      and laser energy density were kept at 670 ◦ C, 100 mTorr, and
hump-like peak upon K dosing reveals that electron correla-        1.9 J/cm2 , respectively. For the growth of SrTiO3 films, the
tions become weaker as the VHS moves away from the Fermi           substrate temperature, background oxygen partial pressure,
level.                                                             and laser energy density were kept at 670 ◦ C, 10 mTorr, and
   It is worth mentioning a couple of findings from the            1.2 J/cm2 , respectively. After the growth, all samples have
electron-doping experiments of single-atomic-layer SRO.            been cooled down to the room-temperature with a rate of
First of all, we can exclude extrinsic disorders as the origin     50 ◦ C/min in an oxygen partial pressure of 100 mTorr.
of the incoherent metallicity in the monolayer SRO. If the
incoherent metallicity were due to defects or disorders,           In-situ angle-resolved photoemission spectroscopy
it would have been persistent even after K dosing. The                In-situ ARPES measurements were performed at 10 K
reappearance of the coherent peak and disappearance of             using the home lab system equipped with a Scienta DA30
the high-binding energy hump peak with K dosing support            analyzer and a discharge lamp from Fermi instrument. He-Iα
the view for intrinsic nature of the observed incoherent           (hv = 21.2 eV) light partially polalized with linear vertical
metallicity of monolayer SRO. The other is that K-dosing           was used. Low-energy electron diffraction patterns are taken
results highlight the rich spectrum of electronic phases in        after ARPES measurements. Spin polarization was measured
monolayer SRO and their giant tunability via charge modu-          with a spin-resolved ARPES system in our laboratory.
lation. The considerable spectral weight at the Fermi energy       The system was equipped with a SPECS PHOIBOS 225
and clear dispersive bands indicate a good metallicity in the      analyzer and a very low energy electron diffraction (VLEED)
electron-doped monolayer SRO. The incoherent-to-coherent           spin detector. For the spin detector, an oxidized iron film
crossover might be exploited to realize novel atomically thin      deposited on W(100) was used as the scattering target. He
oxide field-effect-transistors which have not been realized so     Iα (hv = 21.2 eV) light was used as the light source. To
far.                                                               clean the surface of SRO thin films, we post-annealed them at
                                                                   550 ◦ C for 10 mins [See SM for details].
Outlook
   2D materials and their applications are a rapidly growing       First-principles calculation
field in contemporary condensed matter physics and materials          We performed first-principles calculation using the DFT
science. This trend is becoming predominant not only for van       method without spin-orbit coupling. The PBEsol form of the
der Waals materials but also for oxides. In very recent years,     exchange-correlation functional was used as implemented in
free-standing oxide membranes have been prepared out of the        VASP [51, 52]. To simulate our experimental situation, we
epitaxial oxide heterostructures [45], and the size has reached    prepared a slab geometry with 20 Å vacuum in which 4 uc
a wafer scale [46]. Moreover, the high-quality membranes of        of SrTiO3 is sandwiched by 1 uc of SrRuO3 which preserves
dielectric oxides are shown to maintain their crystallinity even   the mirror symmetry with respect to the middle SrO layer.
down to the monolayer limit [47]. By demonstrating a metal-        We used a 600 eV plane wave cut-off energy and 12 × 12× 1
lic single-atomic-layer oxide, our work expands the scope of       k-points for all calculations and the projector augmented
2D oxides that has been limited to insulators so far. The strong   wave method. During the geometry optimizations, the
electronic correlation gives rise to highly tunable correlated     in-plane lattice constant was fixed at the experimental value
electronic phases, which will be a distinct and advantageous       of SrTiO3 , 3.905 Å and the tolerance on atomic forces was set
feature of 2D oxides for future research on device applica-        to 4 meV Å–1 . The electronic density of states was calculated
tions. We expect that other emergent phases in oxides, such        using a fine mesh 12 × 12× 1 k-points. For the Fermi surface
as unconventional superconductivity [48], could appear in a        calculations, we used the PyProcar package [53] to unfold
single-atomic-layer and thus that our findings pave the way to     the band structure. The chemical potential in the calculated
the two-dimensional correlated electronics [49, 50].               dispersion was shifted by 70 meV so that kF of the β band
                                                                   coinsides with the experimental value.

                          METHODS                                  Scanning transmission electron microscopy measurement
                                                                     Cross-sectional scanning transmission electron microscopy
Fabrication of heterostructures                                    (STEM) specimen was prepared utilizing focused ion beam
   Epitaxial SrRuO3 and SrTiO3 thin films were grown on            milling with FEI Helios 650 FIB and further thinned by
(001)-oriented SrTiO3 single crystal substrates by the pulsed      focused Ar-ion milling with Fischione NanoMill 1040.
laser deposition technique. Prior to the growth, the SrTiO3        STEM images and energy dispersive X-ray spectroscopy
8
(EDS) were acquired using Thermo Fisher Scientific Themis
Z equipped with a corrector of spherical aberrations, a
Acknowledgments
high-brightness Schottky-field emission gun operated at a
300 kV electron acceleration voltage, and Super-X EDX We gratefully acknowledge useful discussions with Woo
system. The semi-convergence angle of the electron probe Seok Choi, Kookrin Char, Kee Hoon Kim, Hongki Min,
was 25.1 mrad. Bohm Jung Yang, Sang Mo Yang, and Seo Hyoung Chang.
This work is supported by the Institute for Basic science in
Competing Interests Korea (Grant No. IBS-R009-D1, IBS-R009-G3). We ac-
The authors declare no competing interests. knowledge the support from the Korean government through
National Research Foundation (2017R1A2B3011629). Cs-
Data availability corrected STEM works were supported by the Research In-
The data that support the findings of this study are available stitute of Advanced Materials (RIAM) in Seoul National Uni-
from the corresponding author upon reasonable request. versity.
[1] Novoselov, K. S. et al. Electric field effect in atomically thin structures of strongly correlated oxide. Science 333, 319–322
carbon films. Science 306, 666–669 (2004). (2011).
[2] Zhang, Y., Tan, Y.-W., Stormer, H. L. & Kim, P. Experimen- [22] King, P. et al. Atomic-scale control of competing electronic
tal observation of the quantum Hall effect and Berry’s phase in phases in ultrathin LaNiO3 . Nat. Nanotechnol. 9, 443–447
graphene. Nature 438, 201–204 (2005). (2014).
[3] Radisavljevic, B., Radenovic, A., Brivio, J., Giacometti, V. & [23] Yoo, H. K. et al. Thickness-dependent electronic structure in
Kis, A. Single-layer MoS2 transistors. Nat. Nanotechnol. 6, ultrathin LaNiO3 films under tensile strain. Phys. Rev. B 93,
147–150 (2011). 035141 (2016).
[4] Dean, C. R. et al. Boron nitride substrates for high-quality [24] Sohn, B. et al. Sign-tunable anomalous hall effect induced
graphene electronics. Nat. Nanotechnol. 5, 722–726 (2010). by symmetry-protected nodal structures in ferromagnetic per-
[5] Geim, A. K. & Grigorieva, I. V. Van der Waals heterostructures. ovskite oxide thin films. arXiv:1912.04757 (2019).
Nature 499, 419–425 (2013). [25] Kim, B. et al. Novel Jef f = 1/2 Mott state induced by relativis-
[6] Cao, Y. et al. Correlated insulator behaviour at half-filling in tic spin-orbit coupling in Sr2 IrO4 . Phys. Rev. Lett. 101, 076402
magic-angle graphene superlattices. Nature 556, 80–84 (2018). (2008).
[7] Cao, Y. et al. Unconventional superconductivity in magic-angle [26] Uchida, M. et al. Pseudogap of metallic layered nickelate
graphene superlattices. Nature 556, 43–50 (2018). R2−x Srx NiO4 (R = Nd, Eu) crystals measured using angle-
[8] Imada, M., Fujimori, A. & Tokura, Y. Metal-insulator transi- resolved photoemission spectroscopy. Phys. Rev. Lett. 106,
tions. Rev. Mod. Phys. 70, 1039 (1998). 027001 (2011).
[9] Dagotto, E. Correlated electrons in high-temperature supercon- [27] Jeong, S. G. et al. Phase instability amid dimensional crossover
ductors. Rev. Mod. Phys. 66, 763 (1994). in artificial oxide crystal. Phys. Rev. Lett. 124, 026401 (2020).
[10] Tokura, Y. & Tomioka, Y. Colossal magnetoresistive mangan- [28] Boschker, H. et al. Ferromagnetism and conductivity in atomi-
ites. J. Magn. Magn. Mater. 200, 1–23 (1999). cally thin SrRuO3 . Phys. Rev. X 9, 011027 (2019).
[11] Yu, Y. et al. High-temperature superconductivity in monolayer [29] Mackenzie, A. P. & Maeno, Y. The superconductivity of
Bi2 Sr2 CaCu2 O8+δ . Nature 575, 156–163 (2019). Sr2 RuO4 and the physics of spin-triplet pairing. Rev. Mod.
[12] Hu, G. et al. Topological polaritons and photonic magic angles Phys. 75, 657 (2003).
in twisted α-MoO3 bilayers. Nature 582, 209–213 (2020). [30] Grinenko, V. et al. Split superconducting and time-reversal
[13] Schlom, D. G. et al. Elastic strain engineering of ferroic oxides. symmetry-breaking transitions in Sr2 RuO4 under stress. Nat.
MRS Bulletin 39, 118–130 (2014). Phys. 1–7 (2021).
[14] McKee, R. A., Walker, F. J. & Chisholm, M. F. Crystalline [31] Shai, D. et al. Quasiparticle mass enhancement and temper-
oxides on silicon: the first five monolayers. Phys. Rev. Lett. 81, ature dependence of the electronic structure of ferromagnetic
3014 (1998). SrRuO3 thin films. Phys. Rev. Lett. 110, 087004 (2013).
[15] Scherwitzl, R. et al. Metal-insulator transition in ultrathin [32] Puchkov, A., Shen, Z.-X., Kimura, T. & Tokura, Y. ARPES
LaNiO3 films. Phys. Rev. Lett. 106, 246403 (2011). results on Sr2 RuO4 : Fermi surface revisited. Phys. Rev. B 58,
[16] Huijben, M. et al. Critical thickness and orbital ordering in ul- R13322 (1998).
trathin La0.7 Sr0.3 MnO3 films. Phys. Rev. B 78, 094413 (2008). [33] Iwasawa, H. et al. Interplay among coulomb interaction, spin-
[17] Anderson, P. W. Absence of diffusion in certain random lattices. orbit interaction, and multiple electron-boson interactions in
Phys. Rev. 109, 1492 (1958). Sr2 RuO4 . Phys. Rev. Lett. 105, 226406 (2010).
[18] Ge, J.-F. et al. Superconductivity above 100 K in single-layer [34] Chen, S.-D. et al. Incoherent strange metal sharply bounded by
FeSe films on doped SrTiO3 . Nat. Mater. 14, 285–289 (2015). a critical doping in Bi2212. Science 366, 1099–1102 (2019).
[19] Lagally, M. G. & Zhang, Z. Thin-film cliffhanger. Nature 417, [35] Kim, M. et al. Observation of kondo hybridization
907–909 (2002). with an orbital-selective mott phase in 4d Ca2−x Srx RuO4 .
[20] Schütz, P. et al. Dimensionality-driven metal-insulator transi- arXiv:2102.09760 (2021).
tion in spin-orbit-coupled SrIrO3 . Phys. Rev. Lett. 119, 256404 [36] Koster, G. et al. Structure, physical properties, and applications
(2017). of SrRuO3 thin films. Rev. Mod. Phys. 84, 253 (2012).
[21] Yoshimatsu, K. et al. Metallic quantum well states in artificial [37] Chang, Y. J. et al. Fundamental thickness limit of itinerant fer-9
romagnetic SrRuO3 thin films. Phys. Rev. Lett. 103, 057201 [45] Lu, D. et al. Synthesis of freestanding single-crystal per-
(2009). ovskite films and heterostructures by etching of sacrificial
[38] Kim, B., Khmelevskyi, S., Franchini, C., Mazin, I. & Kim, water-soluble layers. Nat. Mater. 15, 1255–1260 (2016).
K. SrRuO3 -SrTiO3 heterostructure as a possible platform for [46] Kum, H. S. et al. Heterogeneous integration of single-
studying unconventional superconductivity in Sr2 RuO4 . Phys. crystalline complex-oxide membranes. Nature 578, 75–81
Rev. B 101, 220502 (2020). (2020).
[39] Ko, E., Kim, B., Kim, C. & Choi, H. J. Strong orbital-dependent [47] Ji, D. et al. Freestanding crystalline oxide perovskites down to
d-band hybridization and fermi-surface reconstruction in metal- the monolayer limit. Nature 570, 87–90 (2019).
lic Ca2−x Srx RuO4 . Phys. Rev. Lett. 98, 226401 (2007). [48] Kim, Y. K. et al. Fermi arcs in a doped pseudospin-1/2 Heisen-
[40] Lee, H. J., Kim, C. H. & Go, A. Interplay between spin-orbit berg antiferromagnet. Science 345, 187–190 (2014).
coupling and Van Hove singularity in the Hund’s metallicity of [49] Takagi, H. & Hwang, H. Y. An emergent change of phase for
Sr2 RuO4 . Phys. Rev. B 102, 195115 (2020). electronics. Science 327, 1601–1602 (2010).
[41] Maiti, K. et al. Electronic structure of Ca1−x Srx VO3 : A tale of [50] Ahn, C., Triscone, J.-M. & Mannhart, J. Electric field effect in
two energy scales. Europhys. Lett. 55, 246 (2001). correlated oxide systems. Nature 424, 1015–1018 (2003).
[42] Yang, H. F. et al. Comparative angle-resolved photoemis- [51] Kresse, G. & Furthmüller, J. Efficient iterative schemes for
sion spectroscopy study of CaRuO3 and SrRuO3 thin films: ab initio total-energy calculations using a plane-wave basis set.
pronounced spectral weight transfer and possible precursor of Phys. Rev. B 54, 11169 (1996).
lower hubbard band. Phys. Rev. B 94, 115151 (2016). [52] Kresse, G. & Joubert, D. From ultrasoft pseudopotentials to
[43] Mo, S.-K. et al. Prominent quasiparticle peak in the photoemis- the projector augmented-wave method. Phys. Rev. B 59, 1758
sion spectrum of the metallic phase of V2 O3 . Phys. Rev. Lett. (1999).
90, 186403 (2003). [53] Herath, U. et al. Pyprocar: A Python library for electronic
[44] Neupane, M. et al. Observation of a novel orbital selective mott structure pre/post-processing. Comput. Phys. Commun. 251,
transition in Ca1.8 Sr0.2 RuO4 . Phys. Rev. Lett. 103, 097001 107080 (2020).
(2009).You can also read