Solar Irradiance of the Earth's Atmosphere
←
→
Page content transcription
If your browser does not render page correctly, please read the page content below
Solar Irradiance of the Earth’s Atmosphere

Sultana N. Nahar

Department of Astronomy, The Ohio State University, Columbus, OH 43210, USA
nahar@astronomy.ohio-state.edu

Summary. The sun is the primary driver of terrestrial atmospheric phenomena and energy
source for the earth. It emits radiation over a large energy band and ejects highly energetic
plasma fluxes of charged particles in to space. The sun is an active star that (i) goes through
a 12-year maximum-minimum emission cycle, (ii) has huge, non-periodic eruptions in solar
flares and coronal mass ejections, and (iii) has nearly equipartition of energy between particle
and radiation fluxes. Variations in these emissions interact with all atmospheric layers down
to the earth surface. The precise nature of these interactions can be examined through the mi-
croscopic physics at atomic and molecular levels for illustration of the physical and chemical
processes, and their impacts on to macroscopic problems such as global climate change and
more localized manifestations such as the atmospheric brown cloud (ABC) prominent in Asia.
I will describe some of these calculations for elemental and molecular species such as carbon,
nitrogen, oxygen, sulfur and their compounds. While the visible and near-infrared solar radi-
ation penetrate through, more energetic components in the ultraviolet (UV) and the X-ray are
absorbed by the upper layers of the atmosphere and thus provide protecting shields for the
earth inhabitants. The earth has been maintaining a fine energy balance of solar radiation en-
tering the earth by radiating the same amount in to the space. The greenhouse effect which is
the trapping of radiation energy and reflecting back near earth’ surface by atmospheric gases
in an energy cycle to maintain the average earth surface temperature at 14◦ C is a part of the
balance. However, for the last over a hundred years, the balance is being perturbed due to
change in atmospheric compositions and percentage of concentrations of greenhouse gases.
More energy is being trapped than released leading to global warming and climate change.
Depletion of ozone has created holes for harmful radiation to reach earth’s surface.
     Current atmospheric models lack accurate parameters for atomic and molecular processes
and hence provide predictions which may have large uncertainties. We plan to explore the sen-
sitivity of numerical simulations to accurately predict the response of the earth’s atmosphere
to changes in elemental and molecular composition. For example, what is the effect of in-
cluding new high-accuracy photoionization rates and radiative transition in C, N, O, H2O, etc.
in climate models? How do temporal-spatial and temperature-density dependencies of fun-
damental physical and chemical parameters and rates affect the absorption of solar radiation
by the ABC? These studies should lead to an improved understanding of global warming and
climate change processes, and answers to these questions.
Acknowledgements: Partially supported by a NASA APRA grant.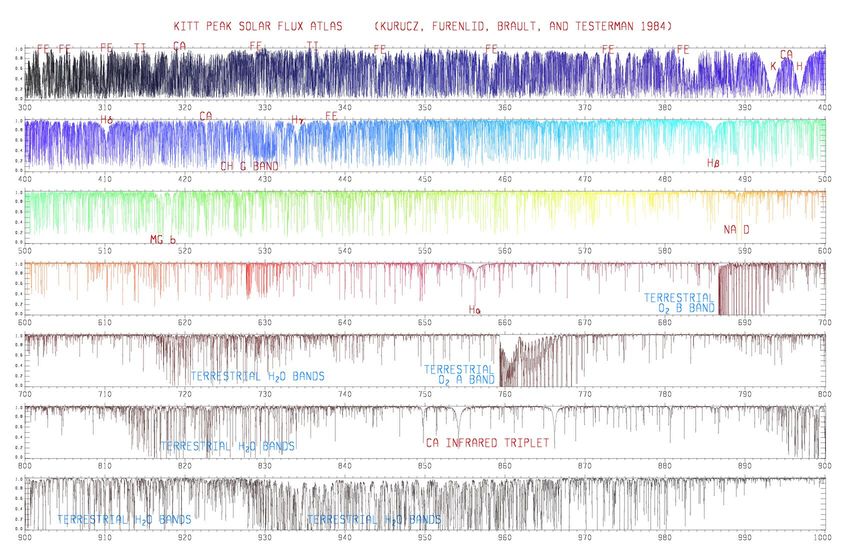
2       Sultana N. Nahar

1 Global Warming
The earth is our home planet and sun is an integral part of our lives. The sun is
responsible for virtually all energy that reaches the earth’s surface and interaction of
solar radiation with atmospheric gases establishes the atmospheric temperature. The
atmosphere contains number of component gases: 78.08% nitrogen (N2), 20.95%
oxygen (O2), 0.93% argon, 0.038% carbon dioxide (CO2) and some other traces.
About 1% could be water vapor varying with climate. These gases have maintained
a constant average earth temperature by a natural balance as they radiate out the same
amount of energy as that coming in. Any change in the concentration of particular
gases in the atmosphere can prevent heat from being radiated out into space and upset
this fine balance. The atmospheric gases which are able to absorb and trap in energy
in a recycle to heat up the earth are known as the greenhouse gases. The natural
constituent greenhouse gases are water vapor, which causes about 36-70% of the of
the heating, carbon dioxide (CO2) about 9-26%, methane (CH4) about 4-9%, and
ozone about 37%.
    Over the last hundred years, the earth is seen going through a climate change,
that is, changes in its weather systems, rainfall and temperatures. The average tem-
perature of the earth’s near-surface air and oceans has increased by 0.74 ± 0.18 C
(1.33 ± 0.32 F) (left panel of Fig. 1) during last 150 years ending in 2005. Recent
measurements indicate that the earth is presently absorbing 0.85 ± 0.15 W/m2 more
than it emits into space. These changes can be caused naturally either, as a result
of changes in the way oceans and the atmosphere interact, or from changes in the
amount of energy received from the sun. However, atmospheric concentrations of

Fig. 1. Left: Global temperature has gone up by almost 3/4th of a Celcius over the last 150
years (ipcc-wg1.ucar.edu/wg1/Report/AR4WG1 Print SPM.pdf). Right: CO2 in the atmo-
sphere has been rising steadyly in recent years (www.grida.no/climate/ipcc tar/wg1/123.htm)

various greenhouse gases have been increasing slowly over the years and are be-
lieved to causing global warming. These concentrations are considerably higher than
at any time during the last 650,000 years, the period for which reliable data has been
Solar Irradiance of the Earth’s Atmosphere       3

extracted from ice cores. Concentration of greenhouse gas CO2 has seen a steady
rise (right panel of Fig. 1). Currently about 6.5 billion tonnes of carbon dioxide are
emitted globally each year, mostly through burning fossil fuel such as, coal, oil and
gas by industries and domestic transportations, and through land use by deforestation
and agricultural processes. The Intergovernmental Panel on Climate Change (IPCC)
Special Report on Emissions Scenarios predicts that this increment in atmosphere
may lead to from 541 to 970 ppm by the year 2100.
    The increased concentrations of greenhouse gases are by human activities since
the industrial revolution (see illustrative Fig. 2). They are for carbon dioxide +35%
since 1700, methane +150% and nitrous oxide +20%. Other greenhouse gases also
on the rise, such as, aerosol gases like hydroflourocarbons (HFC), chloroflorocarbon
(CFC). The conclusion of IPCC research indicated that most of the temperature in-
crease since the mid-twentieth century is due to the increase in these anthropogenic
gases. However, increase of CO2 is believed to be the main gas accountable for
global warming. Present technology can not prevent the release of carbon dioxide,
although there are some that reduce the amount of gas being released.

Fig. 2. Increase of methane, nitrous oxide, CFC, and aerosol gases like hydroflourocarbons,
and mostly carbon dioxide emissions are the contributor to global warming.

    Global warming is heating up the earth’s surface, oceans and atmosphere and
causing devastating damages for the earth habitants. A rise in temperature of just
one or two degrees will result in changing weather patterns and lead to increased
flooding, desertification, crop failures, freshwater shortages, increase of salinity in
inland water, and storms. Already the polar snow caps are retreating and sea levels
are rising. United Nations Environment Programme has shown that glaciers melting
has more than doubled in places. Some of the biggest losses have occurred in the
Alps and Pyrenees mountain ranges in Europe. Estimates for 2006 indicate shrinkage
of 1.4 metres of ’water equivalent’ compared to half a metre in 2005 (top panel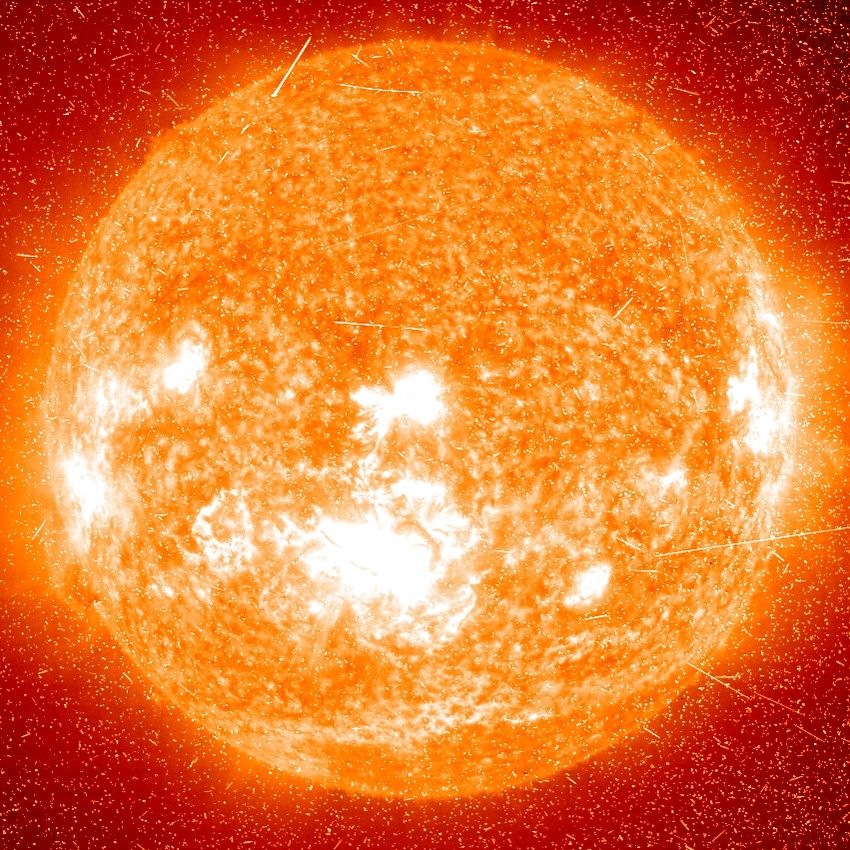
4        Sultana N. Nahar

of Fig. 3). A huge Antarctic ice sheet, 160 squared mile piece which is more than
seven times the size of Manhattan, of the Wilkins ice shelf collapsed in to the ocean
near the end of February 2008 (found from satellite image, bottom panel of Fig. 3).
The piece had been attached to Antarctica for hundreds, or maybe even 1500 years.
Sea level is rising by 0.8mm/year. IPCC estimates from its research from around

Fig. 3. Top: Comparison of earlier and present pictures of a glacier loss in the Alps and Pyre-
nees mountain ranges in Europe Bottom: Antarctic ice sheet, seven times the size of Manhat-
tan, fall into ocean (satellite picture, February 2006).

100 glaciers that the rise may be over 20 cm by 2100 where the increase in 1-23
cm will be due to glacier melt alone. Its data shows significant shrinkage taking
place in European countries including Austria, Norway, Sweden, Italy, Spain and
Switzerland. The overall headline figures from the IPCC expect global sea levels to
rise by between 11 and 88 cm this century, and to rise further after that. These are
figures based on computer modelling.
    Solar radiation has important effect on ozone, O3, the molecule with three oxy-
gen atoms, in atmosphere. Ozone is very rare in our atmosphere, averaging about
three molecules for every 10 million air molecules. In spite of this small amount, O3
plays a vital role in the atmosphere. O3 molecules in the upper atmosphere (strato-
sphere) and the lower atmosphere (troposphere) are chemically identical, but play
different roles in the atmosphere and effects on earth habitants. Stratospheric ozone
(often referred to as ”good ozone”) plays a beneficial role by absorbing most of the
biologically damaging ultraviolet, called UV-B, sunlight. Without the filtering action
of the ozone layer, more UV-B would penetrate the atmosphere and would reach the
earth’s surface. The absorption of ultraviolet radiation by ozone creates a source of
heat and is the reason for temperature rise as one goes to higher altitudes. Ozone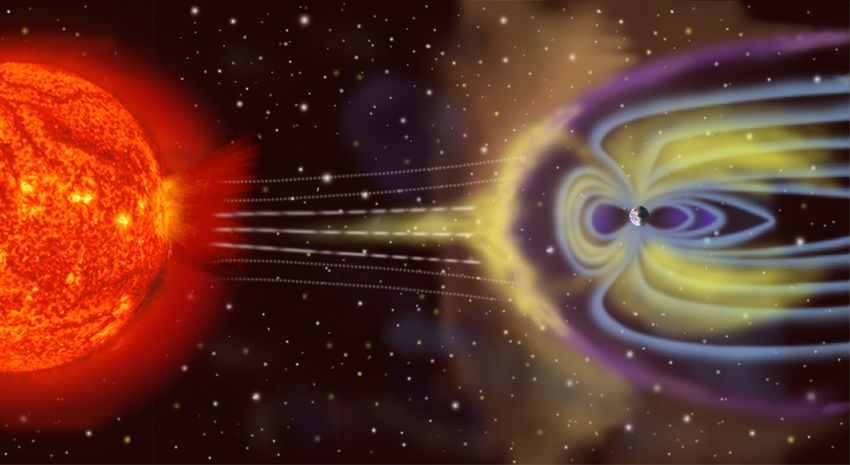
Solar Irradiance of the Earth’s Atmosphere     5

thus plays a key role in the temperature structure of the earth’s atmosphere. On the
other hand, surface-level tropospheric ozone (often called ”bad ozone”) has destruc-
tive nature. It reacts strongly with other molecules and high levels of ozone are toxic
to living systems when comes in to direct contact. Studies show harmful effects of
ozone on crop production, forest growth, and human health.
     Concerned has been raised as ground-based and satellite-borne instruments mea-
surement showed decreasing amount of stratospheric ozone while increment of tro-
pospheric ozone. Over some parts of Antarctica, up to 60% of the total overhead
amount of ozone, the column ozone, is depleted during Antarctic spring (September-
November). This phenomenon is known as the Antarctic ozone hole. In the Arctic
polar regions, similar processes occur that have also led to significant chemical de-
pletion of the column ozone during late winter and spring in 7 out of the last 11
years. Smaller, but still significant, stratospheric decreases have been seen at other,
more-populated regions of the earth. Increases in surface UV-B radiation have been
observed in association with local decreases in stratospheric ozone. On the contrary,
near-surface ozone is causing, especially in many cities, problem as a key component
of photochemical ”smog”.
     The scientific evidence from study by international research community has
shown that human-produced chemicals are responsible for the observed depletions
of the ozone layer. The ozone-depleting compounds, such as carbon tetrachloride,
methyl chloroform which are commonly known as halocarbons, contain various
combinations of the chemical elements chlorine, fluorine, bromine, carbon, and hy-
drogen. The other compound, known as chlorofluorocarbon contain only chlorine,
fluorine, and carbon. These are human-produced gases used in many applications,
such as, refrigeration, air conditioning, foam blowing, cleaning of electronics com-
ponents, and as solvents. Another compounds of human-produced halocarbons is the
halons, contain carbon, bromine, fluorine, and (in some cases) chlorine and have
been mainly used as fire extinguishants. On usage, these float up in the atmosphere
to stratosphere and break down ozone to oxygen.

1.1 ATMOSPHERIC BROWN CLOUDS (ABC)

Recently another problem which is worsening the climate has become of much con-
cern. It is the atmospheric brown cloud (ABC) more pronounced in Asia - especially
China, Arabian Peninsula, India, Bangladesh, Korea, Japan etc enhancing the global
warming in the region. ABC is the thick haze formed in humid condition and usually
in winter when the monsoon is with no rainfall to wash the pollution. The ingredi-
ents are airborne particles and pollution due to coal powered industrial soot, biomass
burning, vehicle emissions, burning of woods, dung, and crops. This pollution layer
was observed during the Indian Ocean Experiment (INODEX) intensive field obser-
vation in 1999. Subsequently the United Nations Environment Programme (UNEP)
supported a project called ABC. The brown cloud that hangs over southern Asia (top
panel of Fig. 4) could precipitate an environmental disaster that could affect billions
of people. A recent CSIRO study found that the Asian brown cloud is also affect-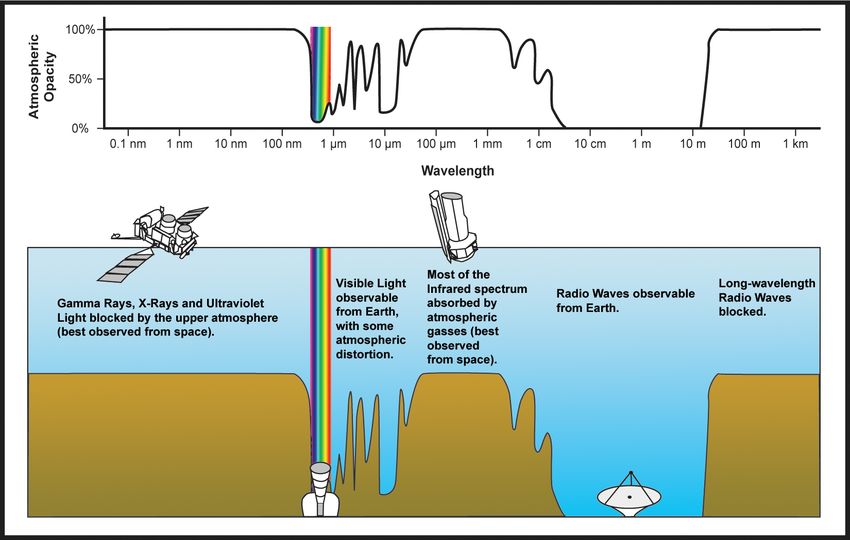
6 Sultana N. Nahar
Fig. 4. Top: Atmospheric brown cloud (ABC), the thick haze caused by pollution that
hangs over southern Asia, is believed to melting Himalayan glaciers (hydrogencom-
merce.com/images/AsianBrownClouda.jpg). Bottom: ABC over northern India, Bangladesh
is enhancing the global warming in the region and affecting the monsoons and rice harvest
(www.newscientist.com, Dec 4, 2006).
ing rainfall in Australia. A new study shows that getting rid of it could actually help
increase the rice harvests in the subcontinent.
ABC reduces sunlight, by about 20% since 1970s, by reflecting part of it back
into space. This cools the surface and thus reduces the evaporation and causes less
monsoon rainfall. It also absorbs the sunlight and thus raises solar atmospheric heat-
ing. Model suggests 50% temperature raised in the area is due to ABC [1] and is
believed to melting the Himalayan glaciers. However, it included the data for solar
heating with uncertainty of about four-folds.
2 Solar irradiation of the earth
Study of interaction of sunlight with atmospheric gases is an integral part of under-
standing global warming and future predictions. The sun brightens up and warms
up the day as the earth spins everyday and causes seasons as the earth moves along
the orbit around it (left panel of Fig. 5). The earth is much smaller than the sun, its
radius being 110 times smaller than that of the sun and only a small fraction of solar
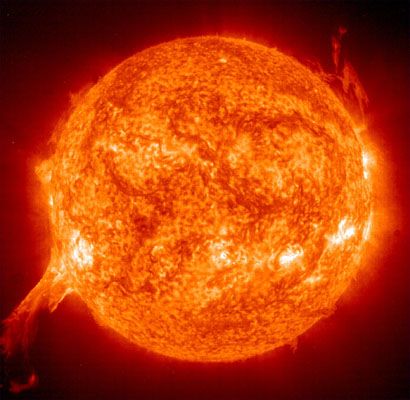
emission irradiates the earth. The sun, is however, an ”unQuiet” star. During active
period of its cycle of 11 years of maximum and minimum activities, it erupts with
explosions that eject large amount of particles and radiation in to space which can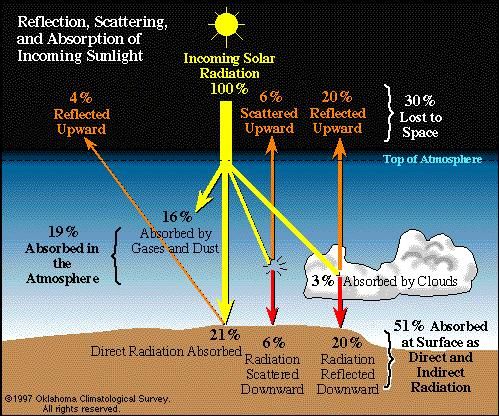
Solar Irradiance of the Earth’s Atmosphere       7

Fig. 5. Left: Annual change in the position of the earth in its revolution around the Sun
(www.physicalgeography.net/fundamentals/6h.html). Right: The solar eruption, observed by
SOHO/NASA on July 1, 2002, to solar flares. The white active regions are loops of magnetic
fields trapping hot gas inside.

affect the earth. A typical solar flare is much larger than the earth. Sun’s picture in
Fig. 5 (right panel), observed by the space observatory SOHO, shows white active
regions and solar flares on the surface.
    Features in solar activities are being elucidated through multi-wavelength spec-
troscopy using observations by space based satellites, such as, SOHO, Chanda
and detailed theoretical atomic and moleculare calculations. The ”Halloween” so-
lar storm, shown in a number of panels in Fig. 6, that occured on October 28, 2003,
was well documented by space observatories Chandra and SOHO. Sun’s active spots
were detected (top left panel). SOHO mass detector, LASCO, detected large coronal
mass ejection (panel on lower left) around the sun (covered at the center by the detec-
tor). Eight hours later the detector was swarmed by the solar ejected particles, proton
shower (lower right). Emission of X-rays in several KeV energy range peaked in the
radiation spectrum of solar flares (e.g. detection by satellite SOXS, upper right) and
the emission bumps are found to be by He-like Ca, Fe, and Ni (upper center).
    Solar X-ray emissions correspond to dielectronic satellite (DES) lines that form
when an electron colliding with a two-electron He-like ion forms an excited 3-
electron system. Two electrons are in excited levels which is known as a doubly
excited autoionizing state. This autoionizing state decays quickly by giving out a
photon, which forms a DES line, leading to a stable bound state. Fig. 7 shows the-
oretical spectrum of the first complete set (known as KLL) of DES lines of He-like
iron ion, Fe XXV [2]. There are in total 22 such lines, including overlapped ones,
in the set. Study of DES lines provides various diagpostics, such as, temperature,
density, chemical abundances of the plasmas surrounding the sun.
    Material, such as, electrons, protons, and heavy ions ejected out in to space by
the explosions are dangerous as these can damage tissue, break strands of DNA,
and lead to diseases like cancer. The powerful electromagnetic pulses also can affect
satellites and communications and can even disrupt electrical service over long dis-
tances. However, earth holds protective shields around it (Fig. 8). Its magnetic field
channels these particles around the earth, funneling some of it to the poles to produce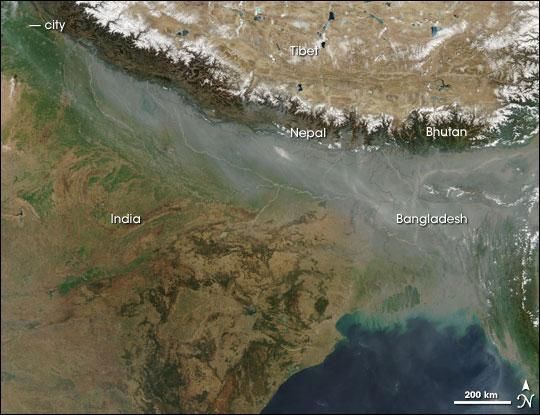
8       Sultana N. Nahar

             X-Ray Modeling of Solar Corona and Flares:
               “Halloween” Solar Storm (Oct 28, 2003)
            active region with big           8 minutes later ... X-class Flare
             sunspot erupts ….                   observed on the Earth

                                                  Ca Fe
                                                             Ni
                                                                                                                  X-ray photons

                                           X-ray spectra of He-
                                                            He-like Ca, Fe, Ni
                                           (SOXS Mission, PRL, India)

                                           coronal mass ejection
                                            leaves the Sun ….

                                  8 hours later... particles

                                  saturate SOHO/LASCO
                                  detector and reach the

                        30 Rsun   Earth (“proton shower”)
           heliosphere
                               NOAA National Weather Service
            … at L1

Fig. 6. ”Halloween” solar storm observed by Chandra and SOHO of NASA on October 28,
2003. See text for explanation. (Courtesy: Judith Lean, NRL)

                                             DES lines of Iron (Nahar & Pradhan 2006)
                                 103
                                 102
                                             e + Fe XXV -> Fe XXIV + hν: KLL satellite lines
                                 101
                                 100       a) Total
                                 10-1
                                 10-2
                                 10-3
                                 10-4
                                 10-5
                                 100       b) Jπ = (1/2)e: 1s2s2p(SLJ) -> 1s22s(2S1/2) resonances
                                 10-1
                                 10-2         v    u          r       q        t       s
                                 10-3
                                 10-4
                       σRC(Mb)

                                    -5
                                 10
                                 101
                                 100       c) Jπ = (1/2)o: 1s2p2(SLJ) -> 1s22p(2Po1/2) resonances
                                 10-1
                                 10-2
                                 10-3        p                         i       g              k           d   b       n
                                 10-4
                                 10-5
                                 10-6
                                 10-72
                                 10
                                 101
                                           d) Jπ = (3/2)o: 1s2p2(SLJ) -> 1s22p(2Po3/2) resonances
                                 100
                                 10-1
                                             o                             h       f   e          l   j       a      m
                                 10-2
                                 10-3
                                 10-4                                                                 c
                                 10-5
                                 10-6
                                    4550                  4600                             4650                     4700

                                                        Photoelectron Energy (eV)

Fig. 7. Theoretical study of DES lines, cross sections versus electron energy, seen in solar
spectrum [2]. The top panel shows the spectrum that can be observed while the bottom panels
identify the compoment lines, including the overlapped ones, of the total spectrum.

the most commonly noticed effect, the glowing auroras. The upper layers of earth’s
atmosphere deflect and block part of radiation, e.g. ozone in stratosphere blocks most
of ultraviolet, X-rays, Gamma rays and the lower atmosphere scatters and burns part
of the incoming particles.
    While earth’s atmosphere blocks most of the harmful radiation, it lets visible
light, most radio waves, and small wavelength ranges of infrared light through mak-
ing it possible to study the universe with ground-based telescopes in these wave-
lengths. Fig. 9 shows the spectrum of atmospheric opacity which gives the measure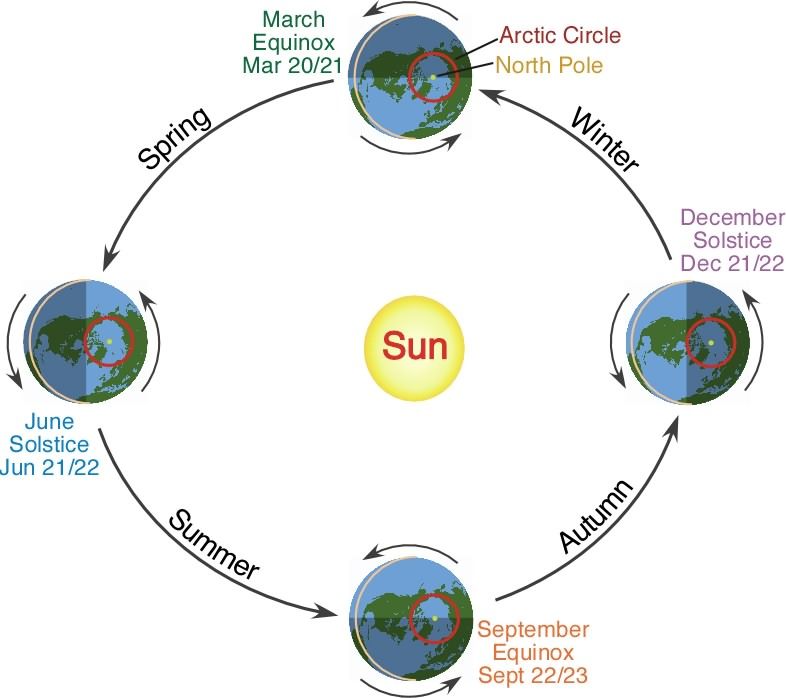
Solar Irradiance of the Earth’s Atmosphere          9

Fig. 8. The magnetic field lines (light blue) originating from the earth, the small object at the
center, act as invisible shield to repel, capture, scatter out the dangerous emission accelerated
by the solar explosions. Various layers of the atmosphere protect the earth from large number
of particles and harmful radiation (NASA).

Fig. 9. Top: Atmospheric opacity spectrum showing wavelengths ranges of radiation that are
blocked by atmosphere due to higher opacity and that reaching the earth due to lower opacity.
Bottom: Opacity determines usage of space and ground based telescopes to study the universe.
(www.ipac.caltech.edu/Outreach/Edu)

of radiation transport. Less opacity means more radiation can pass through. Most of
the infrared light coming to earth is absorbed by water vapor and carbon dioxide in
the earth’s atmosphere. Observations of astronomical objects with blocked radiation
are carried out by space-based telescopes. In Fig. 9 the lower figure shows space and
ground-based telescopes used to study the universe.
10      Sultana N. Nahar

3 Solar energy distribution and greenhouse effect
Of the total solar radiation reaching the earth, 30% is reflected back to space (6%
by air, 20% by clouds, and 4% by the surface of the earth), 19% is absorbed by
atmosphere (16% by atmospheric gases, 3% by clouds) and 51% is absorption by
the earth surface (left panel of Fig. 10). 51% energy absorbed by earth surface is
reradiated to the atmosphere (21% in infrared emission + 7% in sensible heat flux
+ 23% in latent heat flux). The atmosphere absorbs this 51% of longwave infrared
radiation plus the original 19% of shortwave radiation it absorbed directly from the
sun, and then reradiates the total 70% back to space (6% radiated directly and 64%
radiated from clouds and atmosphere). Hence, a stable relation is maintained between
atmospheric thermal strucutre and solar radiation.

Fig. 10. Left: The distribution of solar energy reaching the earth (courtesy: Manitoba Energy,
Science & Technology, Climate Change Branch). Right: Breakdown energies for greenhouse
effect and energy balance (courtesy: IPCC Fourth Assessment Report).

    The right panel of Fig. 10 gives numerical schematic diagram of the flows of
energy among outer space, the atmosphere, and the earth’s surface. It also shows how
these flows combine to trap heat near the surface and create the greenhouse effect.
Direct overhead sunlight at the top of the atmosphere provides 1366 W/m2. Due to
geometric effects and reflective surfaces only 235 W/m2 is absorbed, 67 W/m2 by
air and 168 W/m2 by land and water. Earth’s surface temperature is raised to -18
C by 168 W/m2. However, a number of atmospheric gases absorb the outgoing and
reflected radiation, and thus trapping more radiation in the atmosphere and reflecting
it back to the lower layers of the atmosphere closer to the surface raises the earth’s
temperature. Atmospheric gases absorb 452 W/m2 thermal infrared radiation emitted
by the earth’s surface. Of the total enery 519 W/m2 (=67+452) it delivers 324 W/m2
(62%) back to earth and transmits the rest 195 W/m2 (38%) to space. The total
energy of 492 W/m2 (168 from sunlight + 324 from atmosphere) raises earth surface
Solar Irradiance of the Earth’s Atmosphere 11
temperature to +14 C . The process by which energy is recycled in the atmosphere to
warm the earth’s surface is known as the greenhouse effect and is an essential piece
of earth’s climate. It allows the planet to be habitable and maintain abundant liquid
water.
4 Atomic and molecular processes of photo-absorption, photon
emission, and atmospheric opacity
The macroscopic phenomena due to solar irradiance of the earth are related to a
number of atomic and molecular processes involving light and the atmospheric gases
which absorb and emit radiation at different wavelengths, that is, of defferent energy
photons.
Followings are the prcocesses of absorption and emission of a photon, hν where
ν is the photon frequncy and h is a constant, with an atomic or molecular species,
X +Z of charge Z. The charge can increse with loss and decrease with gain of an
electron.
1. Photoexcitation - where an electron in an atomic or molecular system, X +Z ,
absorbs the photon and jumps to a higher excited level while remaining in the atomic
or molecular system:
X +Z + hν → X +Z∗
The asterisk (*) denotes an excited state.
2. De-excitation (inverse of excitation) - where an electron in an excited atomic
or molecular state gives out energy in the form of a photon and drops down to the
ground level:
X +Z∗ + → X +Z + hν
3. Photoionization/ photo-dissociation/ photo-electric effect - where an electron
absorbs a photon and exits out of the atom/molecule:
X +Z + hν → X +Z+1 + e
4. Electron-ion recombination (inverse of photoionization) - where a free electron
gives out its energy as a photon and combines to an ion
X +Z+1 + e → X +Z+1 + hν
5. Collisional excitation - where an atom or a molecules goes to an excited by the
impact of a free electron, and decays down by giving out a photon.
X +Z + e → X +Z∗ + e0
The first two processes are confined to the atomic system and hence emit or ab-
sorb photons of particular energy relating to quantized atomic levels. They produce
only lines in the spectrum. However, the rest three processes show charateristic fea-
tures over a range of energies of the interacting electron. Study of these features in12 Sultana N. Nahar
Photoionization Cross Sections of N and O
103
N I + hν -> N II + e
102 Nahar & Pradhan (1997)
101
100
10-1
10-2
σPI (Mb)
.5 1 1.5
103
102 O I + hν -> O II + e
Nahar (1998)
101
100
10-1
10-2
10-3
10-4
0 .5 1 1.5 2
Photon Energy (Ry)
Fig. 11. Photoionization cross sections (σPI ) of oxygen and nitrogen [3, 4]. At energies
(pointed by arrows) the resonance peaks indicate enhancement of ionization of the atom by
orders of magnitude.
photoionization cross sections are crucial for any precise modeling. Sun’s ultraviolet
radiation breaks down O2 and N2 molecules to atoms, and then photo-ionize them
in ionosphere. Fig. 11 shows photoionization (PI) features of oxygen and nitrogen
atoms with photon energy in unit of Ry (1 Ry=13.6 eV) [3, 4]. As seen in Fig. 11,
the ionization is not smooth with energy, but goes throgh resonances at different en-
ergies. The resonant peaks indicate enhancement of ionization at particular energies.
Fig. 12 illustrates the charateristic patterns for electron combining with a doubly
ionized (two electrons stripped off) sulfur forming a singly ionized sulfur [5]. At
low temperature the recombination rate is very high and it goes down with higher
temperature due to less time for the energetic electron to combine. However, when
the temperature is high enough to form resonant states, the recombination increases
to a peak which is followed by a smooth decay.
Due to various processes between the gases and sunlight, earth’s atmospheric
opacity spectrum shows various windows of radiation transmission reaching earth
(Fig. 19). For example, (i) oxygen molecules, O3 and O2, and atomic oxygen (O)
absorb ultraviolet radiation, (ii) water and oxygen absorb some radio frequencies,
(iii) carbon dioxide aborb some infrarad frequencies, Determination of atmospheric
opacity, which provides the measures on the radiation transfer, depends on the above
processes. For example, monochromatic opacity (for a particular photon frequncy),
κν , depends on photo-excitation quantity, fi j , oscillator strength for transition from
level i to level j, 2
πe
κν (i → j) = Ni fij φν
mc
where Ni = ion density in state i, φν is a profile factor, and rest are constants, and on
photoionization cross sections, σPI ,Solar Irradiance of the Earth’s Atmosphere 13
Total Recombination Rates for Singly Ionized Sulfur
Recombination: S III + e -> S II (Nahar 1996)
10-10
Recombination Rate Coefficients (cm3sec-1)
10-11
10-12
10 100 1000 10000 105 106 107
T (K)
Fig. 12. Total recombination rate for singly ionized sulfur, S II, from doubly ionized sulfur S
III [5]. The recombination rates shows that starting high at very low temperature it decreases
until at a higher temperature where it peaks due to resonances in the process.
κν = Ni σPI (ν)
The total opacity depends on interaction of radiation with all atoms and molecules in
the atmosphere. Complete atmospheric modeling will require opacities and parame-
ters of all other processes. Under two international projects for precise understanding
of astronomical objects, the Opacity Project [6] and the Iron Project [7], involving
collaborators from the US (Ohio State U, NASA-Goddard, Rollins), U.K., France,
Germany, Belgium, Venezuela, Canada, detailed study have been carrying out for all
the radiative and collisional processes described above using ab initio close coupling
R-matrix method. Large amount of accurate atomic data for many atoms and ions
from hydrogen to nickel are available through databases: TOPbase, TIPbase at CDS
(France) at http://vizier.u-strasbg.fr/topbase/topbase.html, Ohio Supercomouter Cen-
ter at http://opacities.osc.edu, NORAD at www.astronomy.ohio-state.edu/∼nahar/
nahar radiativeatomicdata/index.html These resources can be used for atmoshpheric
modelings.
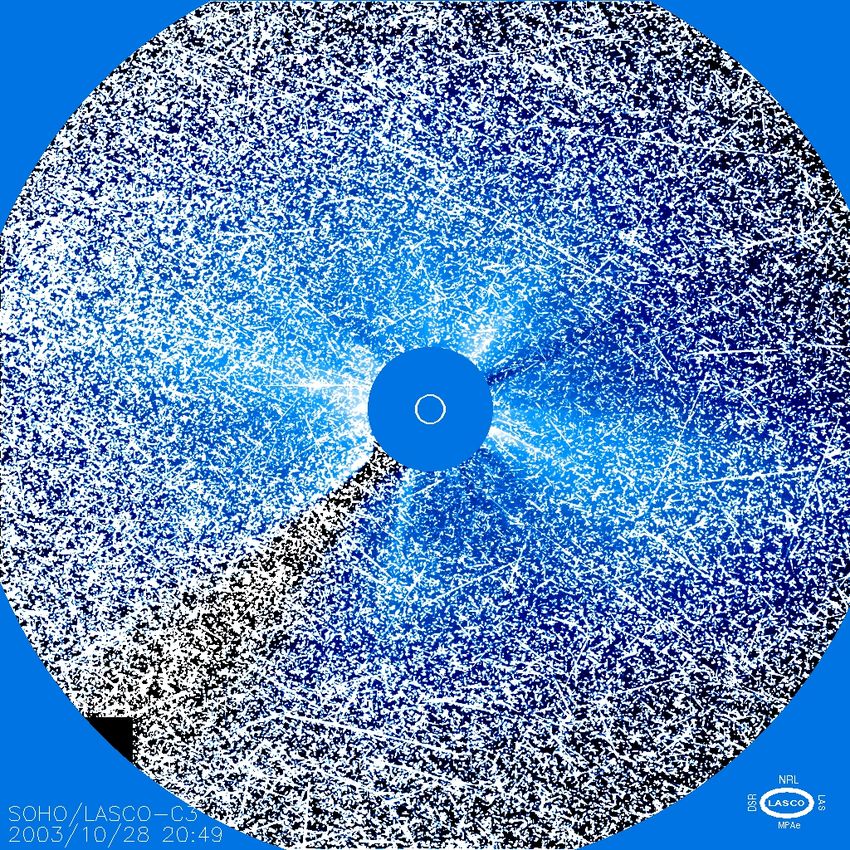
Fig. 13 shows detailed solar absorption spectrum as observed from the earth (cal-
culated by R. Kurucz) where lines correspond to various photons absorptions. The
spectrum, starting from the beginning of the top panel, shows many closely lying
lines indicating that UV is absorbed highly, next optical lines (blue to red) are less
dense meaning less absorption. Yellow is absorbed minimun (reason for the Sun to
look yellow). Absorption lines intensity increases again (bottom panel) in the in-
frared range which is due to absorption mostly by water. The best calculations for
H2 O opacity in atmoshpere was obtained using over 800 M transitions among energy
levels.
With changed atmospheric composition, the spectrum will change. It may be
noted that while some bands are saturated (i.e. 100% of radiation in that band is14 Sultana N. Nahar
Fig. 13. Calculated detailed spectrum of solar opacity as can be observed from the earth’s
surface. (R. Kurucz, kurucz.harvard.edu/sun/fluxatlas/)
absorbed) in the earlier model, further increases in greenhouse gas concentrations
expect to have effect on that band. The additional greenhouse gases will cause the
radiation to be captured closer to the earth’s surface and increase temperature. How-
ever rather than doubling as concentrations double, the overall effect proceeds only
by small increments giving rise to a logarithmic progression rather than a linear one.
Detailed and accurate study of atmospheric opacities will provide radiation transfer
with changed components, solar heating of the earth, and more precise predictions
and speculations of the global warming and climate change. Such calculations will
require high-performance large-scale atomic and molecular calculations which may
be carried out at the Ohio Supercomputer Center.
NASA along with other countries, Europe and Japan, plans launching a number
of satellites to study the atmosphere affecting the global temperature. Nasa’s Orbiting
Carbon Observatory (OCO) (Fig. 14) will in orbit soon to pinpoint the key locations
on the earth’s surface where CO2 is being emitted and absorbed. It will measure
precisely using a spectrometer the sunlight reflected off the earth’s surface into itsSolar Irradiance of the Earth’s Atmosphere 15
constituent colors, and then analyses the spectrum to determine how much carbon
dioxide and molecular oxygen are present. OCO will join a fleet of other satellites
- known as the A-Train - which carry a range of instrumentations to give a rounded
picture of earth’s atmospheric and water systems.
Fig. 14. ’CO2 hunter’ - which is set to launch a satellite orbiting carbon observatory (OCO)
that can map in detail where carbon dioxide is in the atmosphere. (NASA image)
5 Conclusion
1. Sun is the main source of our energy and is keeping us in living conditions by
its radiatioon by establishing a thermal structure in the atmosphere.
2. Atmosphere is the protecting envelope around us and hence its natural consis-
tensies are to be maintained
3. However, imbalance in solar energy distribution is causing global warming by
greenhouse effect, CFCs are depleting earth’s ozone layer Greenhouse gases
have absorption peaks in the infrared radiation. These are mainly water va-
por, carbon dioxide, methane, nitrous oxide Absorption by the atmosphere has
changed the spectrum of radiation received at the earth surface
4. The relation between solar radiation and earth’s atmosphere need to be under-
stood through atomic and molecular processes and is an inherent to atmospheric
modelings
5. Numerical simulation of solar irradiation of earth’s atmosphere requires com-
plex quantum-mechanical calculations for atomic and molecular processes using
high-performace computing
6. Large amount of atomic parameters for radiative processes in atmosphere is
available; however, more data for especially for molecules are needed
7. A consorted MULTI-DISCIPLINARY effort is extremely crucial to solve the
problem of global warming and protect our home planet.16 Sultana N. Nahar
8. PLAN: Calculation of accurate solar opacities and heating for atmospheric mod-
eling
References
1. Ramanathan V., M.V. Ramana, G. Roberts, D. Kim, C.E. Corrigan, C.E. Chung & D.
Winker, Nature, 448, 575-578 (2007)
2. Nahar, S.N. & Pradhan, A.K., Phys. Rev. A 73, 062718-1 (2006)
3. Nahar, S.N. & Pradhan, A.K. Astrophys. J. Suppl. 111, 339-355 (1997)
4. Nahar, S.N., Phys. Rev. A 58, 3766 (1998)
5. Nahar, S.N., Astrophys. J. Suppl. 106, 213-214 (1996)
6. The Opacity Project vols 1 & 2, compiled by the Opacity Project Team: Institute of
Physics, London UK 1995 and 1996 — (OP)
7. Hummer D.G., Berrington K.A., Eissner W., Pradhan A.K, Saraph H.E., Tully J.A., 1993,
A&A, 279, 298 (IP)You can also read