Monitoring LED Lights with Current Signatures - Microsoft
←
→
Page content transcription
If your browser does not render page correctly, please read the page content below
Monitoring LED Lights with Current Signatures
   Johnny Verhoeff         Akshay Uttama Nambi S.N.                Marco Zuniga Zamalloa                    Bontor Humala
       TU Delft                 Microsoft Research                         TU Delft                           TU Delft
    The Netherlands                    India                           The Netherlands                      The Netherlands
  j.verhoeff@me.com          akshay.uttama@gmail.com             m.a.zunigazamalloa@tudelft.nl      bontorhumala@student.tudelft.nl

   Abstract—Artificial lighting is a pervasive element in our daily     have tens or thousands of lights with the same energy profile.
lives. Researchers from different communities are investigating         Some recent studies explore various types of infrastructures
challenges and opportunities related to artificial lighting but from    to achieve that monitoring goal: light sensors [6], power
different angles: energy disaggregation, to monitor the status
of light bulbs in buildings; and communication, to transmit             line communication [7] and lighting control systems [8]. We
information wirelessly. We argue that there is an unexplored            propose a new alternative: to combine energy disaggregation
synergy between these two communities. When a light bulb                methods with the up-and-coming VLC infrastructure.
modulates its intensity for communication, it also affects the             Our approach. We assume that a building has VLC lights
current it draws. This current signature is unique and could            sending periodic beacons (IDs) for applications such as indoor
be used by energy disaggregation methods to identify the lights’
status. These signatures however will be exposed to interference        localization. These VLC lights do not have any type of
(collisions of signatures) and distortions due to power line effects.   backchannel (e.g. no radio module or power line communi-
To overcome these problems, we build upon coding schemes to             cation). When these lights modulate their light intensity, they
assign interference-resilient signatures, and we develop custom         also ‘modulate’ the current drawn to power themselves. These
hardware to ameliorate distortions introduced by power lines. We        unique current patterns could be decoded at the smart meter.
validate our framework in a proof-of-concept testbed, perform
simulations to test scalability, and use energy traces from real        But the correct identification of these signatures would need
homes to evaluate the impact of other electric loads.                   to overcome two problems: (i) interference, many lights are
                                                                        on at the same time, and thus, their signatures will collide;
                       I. I NTRODUCTION
                                                                        (ii) distortions, the signatures will get distorted due to non-
   Lighting accounts for 17-38% of total electricity consump-           linear elements present in power lines. In light of these
tion in buildings [1]. A significant part of this could be reduced      challenges, we present iLED, a framework to monitor the
by providing real-time information on individual light energy           status of individual lights in real time using a single energy
consumption to occupants and building managers. Our work                meter. iLED aims to provide valuable insights to occupants
is motivated by the potential synergy between two areas that            and building managers on electricity cost at individual light
investigate challenges related to artificial lighting, but that         level, energy optimization, occupancy estimation and other
hitherto has not been explored much.                                    applications. Our specific contributions are three-fold:
   Area 1: Visible Light Communication (VLC). A new lighting            1) Analytical framework (Secs. IV and V). To tackle the
infrastructure providing services beyond illumination. Due to           problem of interference, we build upon coding theory to
their high energy efficiency, LED lights are rapidly replacing          provide lights with a special ID that is resilient to collisions.
traditional light bulbs. By 2030, 86% of all lighting installa-         2) Platforms (Sec. VI). To tackle the problem of distortion, we
tions are expected to be LEDs [2]. And thanks to advances               develop custom VLC lights to overcome the non-linear effects
in VLC, LED lights can now modulate their intensities to                caused by power lines (for energy disaggregation).
transmit data. These advances are creating a new range of               3) Evaluation (Sec. VII). We validate our approach with a small
exciting applications. For example, Philips has transformed             scale testbed to showcase the ability of iLED to overcome
the lighting infrastructure of a French supermarket to provide          interference and distortion problems. To test scalability, we
localization services to its customers [3]. Thus, in the future         perform simulations. To analyze the effect of other electric
we may be replacing the LED lights in our buildings with                loads, besides lighting, we use traces from real homes.
VLC lights that act as beacons to provide localization. If this
                                                                                             II. R ELATED WORK
occurs, we could leverage VLC to monitor in real time the
status of individual lights (i.e. to check if they are on or off ).        The general area of energy disaggregation is vast [4]. We
   Area 2: Energy Disaggregation. The difficulty of monitoring          focus only on the most relevant work aimed at disaggregating
light bulbs. Energy disaggregation aims at taking the entire            the energy consumed by lighting.
energy signal of a building, and separate it into appliance                Leveraging electromagnetic signatures to identify the use
specific data [4], [5]. Many appliances, such as fridges and            of lighting. Recent studies propose using high-frequency en-
HVAC systems, have unique energy profiles (signatures) that             ergy meters (> 1M Hz sampling) to monitor electromagnetic
can be identified from the aggregated energy measured at the            interference (EMI) as a mean to identify unique signatures in
smart meter. But lights are difficult to monitor. Buildings can         appliances [9], [11]. Gulati et. al [11] can identify the presence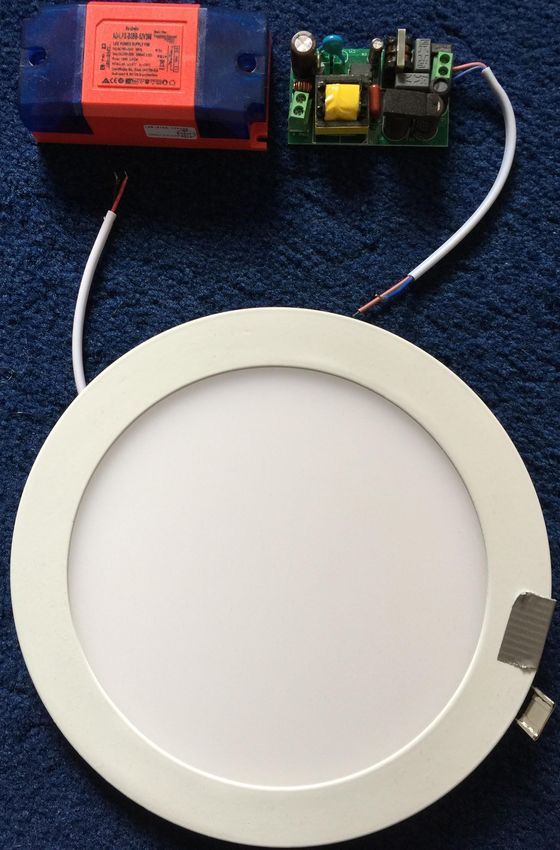
of LEDs powered by switch mode power suppies (SMPS), and                                                        Modulator
ElectricSense [9] can detect the presence of different types of                                                  LED
CFL lamps based on their consumption power. These studies
                                                                                                         VLC Light
can identify if lights are on. But they can not identify which
specific light is on because it is difficult to distinguish EMI
                                                                                                          Power lines
signatures when multiple instances of the same appliance are
active (e.g., lights).
   Adding or exploiting existing infrastructure to monitor
                                                                                                         Light monitoring
individual lights. There are other types of infrastructures
                                                                                                         Energy meter +
that are suitable to provide individual light monitoring. If a                                             Database
building already has these types of infrastructure, our method
                                                                                         Fig. 1: iLED framework.
would not be required. Below we describe these approaches.
   Radio Channels & Building Control Networks (BCN). Some             to measure accurately current flows, iLED is less affected by
lights have BLE or WiFi radios to control them [10]. By               interference in the power line.
default, such lights can use their radios to report their status         Modulating light intensity and current simultaneously.
in real time. Some buildings have actuators to record lighting        VLC is only concerned with modulating light intensity [15],
events. When a light switch is turned on, it pings an actuator        [16], not with modulating the current drawn. We create custom
that forwards the event to a central controller. An actuator can      hardware to achieve both modulation goals simultaneously.
be connected to a single light or many lights in a room. In [8],
the authors correlate these switching events with information                             III. S YSTEM D ESIGN
from a smart meter to provide fine-grained decomposition of              The aim of this work is to develop a framework to monitor
lighting usage. The decomposition can be per light or room,           the use of lights in buildings with a single energy meter.
depending on how many lights are connected to each actuator.          We focus on legacy buildings, that is, buildings that do not
   Power over Ethernet (PoE). Nowadays Ethernet cables can            have any extra infrastructure beyond the basic power lines
provide sufficient energy to power some LEDs [12]. Thus,              (AC or DC). Due to standard requirements, many buildings
PoE can enable by default per-light monitoring because every          have separate power lines for lighting. For scenarios with a
LED light has a network address. PoE however has some                 single power line for all loads, we present some analysis in
limitations. First, it is an inefficient way of transferring power.   Sec. VII-D. We assume that a smart meter is connected to
The voltages are very low, between 30 and 60 V. These low             the lighting power line and that the building has VLC-lights
voltages imply big currents, which lead to energy wastage             broadcasting periodically their unique IDs (the VLC lights
on the transfer line (Ethernet cable). Second, PoE can only           are standalone devices with no backchannel). Our system is
support low-power loads, 13 W for CAT3 and 25 W for CAT5,             depicted in Fig. 1 and has three main components:
which limit the types of LEDs that can be used.                          VLC lights. We use commercial LED lights with additional
   Power line communication (PLC). With PLC, appliances               custom build parts to modulate their light intensity and current
use adaptors to transfer data over the power line. A few              consumption. A simple On-Off Keying (OOK) scheme is used
research efforts have explored the use of PLC to collect              for modulation, where 0/1 symbols are sent by turning the
data from appliances [7], [13], [14]. In [13], PLC is studied         LED off/on at high frequencies. Our modulation does not
as the communication backbone for smarthomes. The study               create any flickering effects.
found that the performance of PLC can degrade rapidly due                Energy meter. The energy meter measures the current
to high power motors and external interference (power lines           consumed by all light fixtures in a building. Due to the high
are big antennas). Murthy et. al [14] looked deeper into the          modulation frequency of our VLC lights, we need a high-
reasons behind PLC’s performance degradation, and found that          frequency, high-sensitivity energy meter. Some commercial
it is also affected by the distance between appliances and            meters do not provide this capability, others do but are
the number of simultaneous transmissions. Batra et. al [7]            expensive [17]. We develop our own energy meter (albeit
extended the above pieces of work by exploiting performance           intrusive) by embedding a resistor in the power line.
degradation itself as a signature. The same appliance (e.g.              Lighting monitoring system. This component identifies
lights) located at different distances cause distinct reductions      the status of individual lights from the aggregated energy
in bandwidth. Based on this pattern, the authors identify which       consumption. Our framework requires no training phase. This
appliance is on, but only if one of them is active.                   component only requires a database with the IDs of lights in
   Our work has some resemblance with PLC, but there is an            the building. With this information, active IDs are decoded
important difference. PLC is a brittle technology, the power          continuously from the aggregated signal.
line carries two types of ‘signals’: changes in current due to
energy consumption, and low voltage pulses to transfer data.                              IV. C ODES FOR I LED
PLC’s low voltage pulses are easily distorted by interference.          To obtain IDs that are resilient to interference we build upon
iLED, on the other hand, carries only one type of signal:             the field of coding theory. Our first task is to identify a code
changes in current. Since power meters are designed by default        that abides by four key requirements in our application: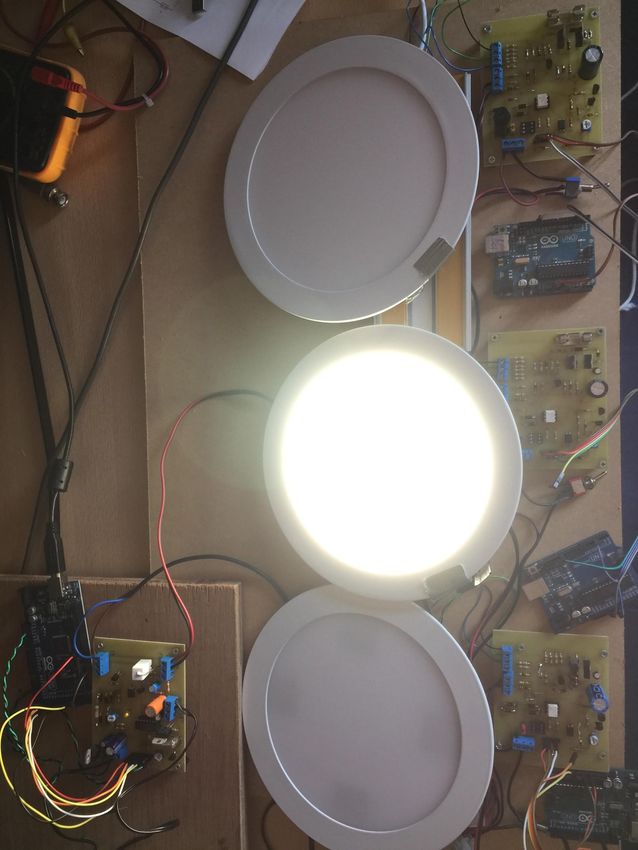
Scalability. Given L bits, we can obtain 2L unique IDs. But                          TABLE I: Comparison of PN and Gold codes.
only a very small subset of those 2L IDs have resilience to                                               PN codes             Gold codes
                                                                                           L      # of      Cross-   m    # of    Cross-     m
interference. Each light will need an ID from that small subset.                                 codes       corr.       codes     corr.
Thus, buildings with many lights may need increasingly longer                             31       6          11     1     33        9        1
                                                                                          63       6          23     1     65       17        1
IDs. But if the IDs get too long, we may not be able to transmit                         127       18          41    1    129       17        3
them in a timely manner.                                                                 511       48         113    2    513       33        7
                                                                                         1023      60         383    1   1025       65        7
   Balance. In radio communication, it is not so important the                           2047     176         287    3   2049       65       15
pattern of 0’s and 1’s present in a code. But for VLC it is. If
there are too many 0’s in a row, flickering effects will occur.                  almost perfect balance of ones and zeros: (L + 1)/2 ones
We require codes with a balanced sequence of symbols.                            and (L − 1)/2 zeros, and these symbols alternate in a rather
   Synchronicity. Lighting switching events in buildings can                     homogeneous manner.
occur in a synchronous manner, for example a switch turning                         Cons: resilience and scalability. PN codes have an average
on many lights in a room, or in an asynchronous manner, lights                   resilience. The auto-correlation is good (L when τ = 0 and −1
being turned on/off independently in different rooms. We need                    when τ 6= 0), but the cross correlations are greater than zero.
codes that perform well under both circumstances.                                If multiple lights are on, their cross-correlations could add up
   Resilience. Considering X1 as the ID of LED1 (available                       to values similar to the auto-correlation, which would lead to
from a database) and Y as the aggregated signal measured                         false positives. PN codes also scale poorly. The maximum
by the smart meter (which may or may not contain X1 ). The                       number of codes in sequence of length L grows slowly, as it
lighting monitoring component will correlate these two signals                   depends on the prime factors present in L.
to identify if the ID is present (i.e. to check if the light is on).
The correlation of two signals is defined as,                                    C. Gold code sequences [20]
                    L−1
                                                                                    Pros: synchronicity, balance and scalability. Gold codes
                                                                                 maintain the good properties of PN codes (balancing and
                    X
        R(τ )xy =         x1 (i) × y(i + τ ) with τ = 0, 1, 2, . . . , L   (1)
                    i=0                                                          (a)synchronous operation), and add scalability. The scalability
where, τ is the lag of one signal relative to the other, and                     of Gold codes is even better than that of orthogonal codes.
L is the length of the code. Assuming that a total of k IDs                         Cons: resilience. The resilience of Gold codes is lower than
are present in Y , including X1 ; the above sum can be de-                       orthogonal codes, but higher than PN codes. If the pair of PN
composed P into two sums, one evaluating the auto-correlation                    sequences are ‘well chosen’, the auto-correlation is given by,
of X1 =       x1 (i) × x1 (i + τ ), and the other evaluating the
                                                                                                      (
                                                                                                      L                          if τ = 0
cross-correlation  between X1Pand the other IDs present in Y :                              R(τ ) =                                               (2)
P                                                                                                     {−t(n), −1, t(n) − 2}      if τ 6= 0
   x1 (i) × xj (i + τ ) + . . . + x1 (i) × xk (i + τ ). Ideally, we                                      (     n+1
                                                                                                           1+2 2        for odd n
would like codes that give an auto-correlation of L for τ = 0                                     t(n) =       n+2                                (3)
and zero for τ 6= 0, and a cross-correlation of zero for all                                               1+2 2        for even n
values of τ . Such correlations would generate a single spike                    where, n is the number of LFSR registers, and the cross
when a code is present and zero the rest of the time.                            correlation can only take one of three possible values [20],
   Next we describe succinctly different types of codes and
                                                                                                  Rxy (τ ) = {−t(n), −1, t(n) − 2}                (4)
highlight their pros and cons w.r.t. our scenario.
                                                                                    Table. I shows the code length (L), number of codes (C),
A. Orthogonal code sequences [21]
                                                                                 peak cross-correlations and maximum concurrent transmitters
   Pros: scalability and resilience. Orthogonal codes scale                      (m) for PN and Gold codes. We can see that for the same code
well. For a sequence of length L, we get L − 1 codes.                            length, the number of Gold codes generated is much higher
Orthogonal codes also have excellent resilience. When a code                     and the peak cross-correlations are lower. Thus we use Gold
is present in the aggregated signal, the auto-correlation is L.                  codes as the mechanism to generate the IDs for iLED.
If the code is not present the cross-correlations are zero.
   Cons: synchronicity and balance. Orthogonal codes only                                      V. I NDOOR L IGHTING M ONITORING
work in synchronous scenarios. In asynchronous scenarios,                          We now describe the two main challenges we need to
the auto-correlation can be low and the cross-correlations are                   overcome to use Gold codes for iLED.
no longer zero [18]. Furthermore, in orthogonal codes, the
number of consecutive zeros and ones increase as the code                        A. Minimizing number of concurrent LED transmitters
length increase, which would lead to flickering effects.                           In a building, numerous LEDs will be on at any given time,
                                                                                 and thus, they will be transmitting their codes simultaneously.
B. Pseudorandom Noise code sequences                                             Since the cross-correlations of Gold codes are not zero, these
   Pros: synchronicity and balance. PN codes can work in                         correlation values could add up (or substract) leading to false
synchronous and asynchronous scenarios. Furthermore, they                        positives and false negatives (as explained later). To ensure that
have great balancing properties [19], which guarantees no                        the LEDs’ IDs can be decoded successfully at the smart meter,
flickering effects. Any PN sequence of length L contains an                      we first derive the maximum number of codes m that can be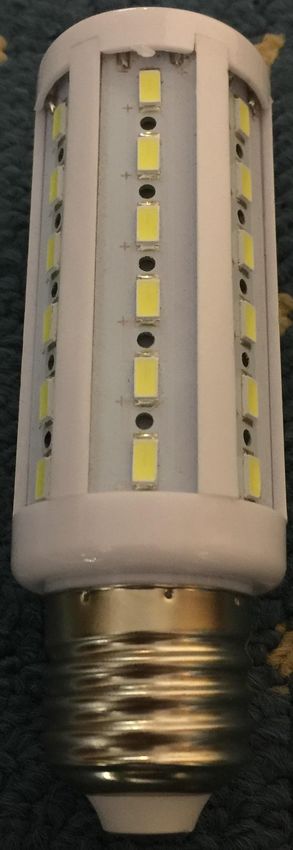
transmitted simultaneously. Then we propose a probabilistic the time required to hear from all LED lights. A large has the
approach to guarantee with probability p that no more than m opposite trade off. Once a user defines , and obtains p, we can
LEDs transmit their code at any given time. calculate the expected polling time. That is, how frequently we
1) Maximum number of concurrent transmitters: When a can monitor the LEDs. This expected polling time is given by
Gold code is present in the aggregated energy signal, the auto- E[t] = L 1
f × p . In Sec. VII-C, we will see that iLED is capable
correlation value is equal to the length of the code L and of accurately monitoring hundreds of lights every few minutes.
for all other codes the cross-correlation value is bounded by
B. Correlation with (0,1) symbols
t(n), which can be positive or negative (c.f. Eq. 4). Let T
be the threshold used to determine if the correlation value Coding schemes have been developed mainly to suit the
is high enough to deem that a light is on. Due to the non- needs of radio communication, where bits can be mapped to
zero cross-correlations we can have false positives or false ±1 symbols. But in our system the aggregated signal only
negatives. If a code is not present, but the cross-correlations takes 0/1 values. We thus have a mismatch: the codes stored
with other codes are positive, the correlation values may add in the lighting monitoring component (database) contain ±1
up to values greater than T (false positive). If, on the other symbols, but the aggregated signal measured at the smart
hand, a code is present but the cross-correlations are negative, meter is generated by 0/1 codes. To overcome this problem,
the final correlation may fall below T (false negative). To avoid we perform a transformation. First, we will obtain correlation
these problems, we need to guarantee that: values for codes using ±1 symbols (as in the case of radio
R = L − m × t(n) > T (avoid f alse negative) communication). Then, we obtain correlation values for our
R = m × t(n) < T (avoid f alse positive) system. Finally, we show that the former correlation (which is
what we want), is a function of the latter.
By equalizing the above equations, we can compute (i) the Correlation between a ±1 signal and ±1 symbols. Let x =
maximum number of concurrent transmitters (m) for a reliable s(t) be the received aggregated signal composed by m distinct
decoding process, and (ii) the threshold value (T ), codes with symbols (+1,-1), ci (t) be the code sequences and
L L y= c0 (t) be the code we want to identify in the received signal.
m= and T = (5)
2 × t(n) 2 The correlation in (1) can be rewritten at τ = 0 as,
L−1
X m
X
Now let us give an example to determine the parameters m R(0)sc0 = s(t) × c0 (t) , where s(t) = ci (t)
and T for a building with less than 1026 lights. Considering t=0 ( ) i=1
a 10-register LFSR, the code length is 1023 (2n − 1), the L−1
X m
X
R(0)sc0 = c0 (t) × ci (t) (7)
maximum number of codes (lights) is 1025 (2n + 1), the t=0 i=1
maximum cross-correlation t(n) = 65, and thus, the maximum
number of concurrent transmitters is 7. The final correlation is the sum of all cross-correlations plus
2) Probabilistic approach: The maximum number of LEDs the auto-correlation of c0 (t), if c0 (t) is in s(t).
m that can transmit their IDs concurrently (c.f. Eq. 5) can be Mapping function. To derive correlation values for ±1
low compared to the number of LEDs active in a building. In symbols as a function of correlation values with 0/1 symbols,
our prior example, a building with 1025 lights could have at a mapping function needs to be defined [19]. Let r denote +1
most 7 active lights at any given time. To ease this constraint, or −1 and b denote 0 or 1, b can be written as b = 1−r 2 .
we propose a probabilistic approach. Every LED divides its Correlation between a 0/1 signal and ±1 symbols. Let x1
local time into slots of length L/f , where L is the code length = s1 (t) be the received signal at the smart meter, which is
and f is the modulating frequency. For a code length of 1025 composed of m distinct codes formed with 0/1 symbols. Let
and a modulation frequency of 10 kHz, these time slots will us denote each one of this binary codes as cbi (t). Let us also
be approximately of 0.1 seconds. At each time slot, the LED denote y= c0 (t) as the code we are looking for, but this code
sends its ID with probability p. is stored at the database with ±1 symbols. The correlation of
Considering that we have C valid codes, but only m can be these two signals can be written as,
L−1 m
active simultaneously, we can model the probability of having ˆ
X X
R(0) s1 c0 = s1 (t) × c0 (t) and s 1 (t) = cbi (t)
m or less active transmissions as a binomial distribution,
t=0 )i=1
m L−1
( m
X C
× pi × (1 − p)C−i ˆ
X X
CDF: PR(X ≤ m) = (6) R(0) = c0 (t) × cb (t)
i=0
i s1 c0 i
t=0 i=1
where X is the random variable representing the number of Substituting cbi (t) with the mapping b = 1−r
2 , we can rewrite
LEDs transmitting their IDs at any given time. The probability ˆ
R(0)s1 c0 as, ( )
PR(X ≤ m) needs to be high to avoid interference. To L−1 m
1 − ci (t)
ˆ
X X
determine the probability p, a user could set PR(X ≤ m) R(0)s1 c0 = c0 (t) × (8)
t=0 i=1
2
= 1 − , where denotes the likelihood of having more than ( )
L−1 L−1 m
m concurrent transmissions. The trade-off for selecting is ˆ
R(0)
m
×
X 1
c0 (t) − ×
X
c0 (t) ×
X
s1 c0 = ci (t) (9)
between time and accuracy. A small increases the likelihood 2 t=0
2 t=0 i=1
of correctly decoding (monitoring) IDs, but it also increases
DC power supply
Current source (a) LED-1 (b) LED-1 OFF (c) LED-1 ON
+ sampler
Microcontroller
6 X VLC Lights
Fig. 2: iLED DC testbed. (d) LED-2 (e) LED-2 ON (f) LED-2 Modulating
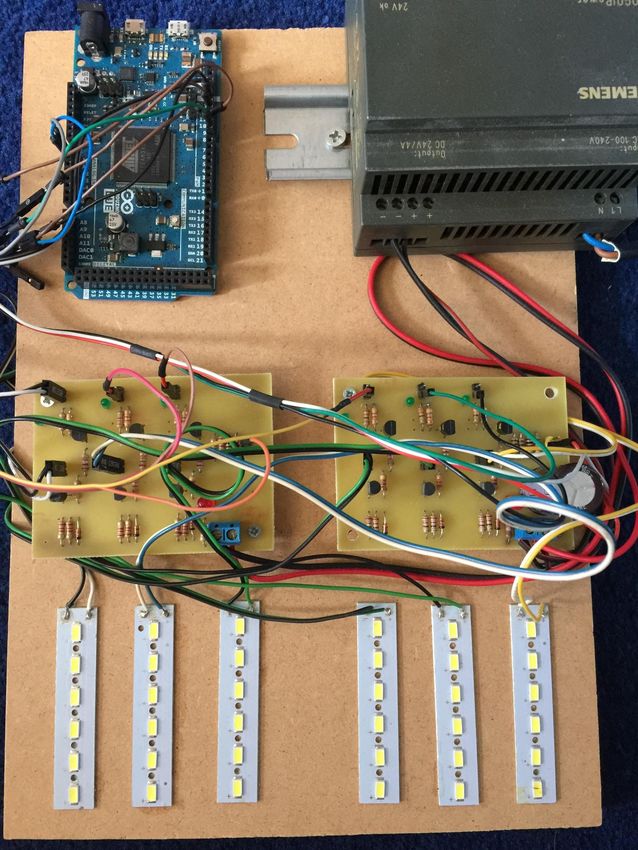
Fig. 3: Commercial LEDs, their current signatures along with
Transformation. The second term in the above equation
represents the correlation coefficient described in (7) and can the custom built VLC light.
be rewritten as, DC testbed: Fig. 2 shows the DC testbed. The setup
L−1
ˆ = m× 1
includes six LEDs, the current sources to power them and
X
R(0) c0 (t) − × R(0) (10)
2 2
t=0 a microcontroller. The energy meter measures the aggregated
L−1
R=m×
X
c0 (t) − 2 × R̂ (11) current consumption of the LEDs and decodes the received
t=0 signal to determine the presence of an LED signature.
where, m is the number of distinct transmitters and the
PL−1 B. AC testbed infrastructure
term t=0 co (t) represents the sum of the code sequence.
For balanced Gold codes, the number of ones equals the Unlike the DC setting, in AC settings the supplied voltage
number is a sinusoidal wave. Hence the design of the VLC light and
PL−1 of zeros plus one as described in (IV-B), hence
t=0 co (t) = −1. Finally we obtain:
energy meter is not trivial. We first discuss the problems with
modulating light and current simultaneously in commercial
R = −m − 2 × R̂ (12)
light bulbs. Then, we describe our custom hardware design to
Upon calculating the correlation R̂ at the smart meter, we
overcome these problems.
transform it to R, and only then, we compare the correlation
Problems modulating standard LEDs. Commercial LEDs
with the threshold T to determine if an LED is active or not.
are powered in several ways for efficiency, (i) by using an
VI. I LED T ESTBED external switching mode power supply (SMPS) to convert AC
For iLED to work in practice, we need square waves to to DC, or (ii) by directly connecting to AC with a built-in
allow proper superposition of signals when multiple LEDs are rectifier circuit. These two approaches introduce distortions.
modulating. The codes, however, can get distorted due to non- The SMPS approach (Fig. 3(a-c)) leads to highly distorted
linear elements in DC and AC power lines. In this section we waveforms, which cannot be decoded. Fig. 3(b-c) show the
describe our custom hardware to tackle the distortion problem. current signatures when the LED is off and on. The second
approach has a smoother waveform but has its own set of limi-
A. DC testbed tations, c.f. Fig. 3(d-f). First, the time available for modulation
Our DC setup includes VLC Lights and an energy meter. is limited, c.f. Fig. 3(e). These type of LEDs work in a duty
VLC Light consists of standard LED lights with modula- cycle manner. Regions A and C are the only times the LED is
tors. The modulator switches on and off the LED based on actually operational, which means that the time available for
the code that is assigned to the light fixture. LEDs are usually modulation is only 8 ms in a 20 ms period (40% of modulation
powered by connecting a current limiting resistor in series time). Hence the time taken for an LED to transmit its code
with the voltage source. However, depending on the load, would be longer as compared to a DC setting. Second, and
the supplied voltage may fluctuate, which would also cause more important, the amplitude changes. We cannot obtain
fluctuations in the current drawn. This causes distortions in the necessary square waves to create superimposing codes.
the generated signal. To eliminate this distortion, we build a To showcase this point, we modified the internal circuitry
current source which delivers a constant current independent of a commercial LED to toggle it by adding two transistors.
of the load. Thus, the resultant current drawn has two distinct Fig. 3(f) shows the result of the modulation. We can see the
values (0 for the LED off state and some constant current for modulation leads to triangular waves with different amplitudes.
the LED on state). A signal from a microcontroller is used to Custom LED modulator. Due to the distortions caused
toggle the current source for modulating the LED. by the two commercial LEDs analyzed above, we decided to
Energy meter: We developed a low cost energy meter design a custom hardware that includes a triggering circuit to
by connecting a resistor in series between the DC power indicate when to modulate the LED, a current source to pro-
supply and the LEDs. The voltage drop over the resistor is vide constant current when the LED state is on, and a voltage
linearly proportional to the current that flows through it and source to power the triggering circuit without distorting the
is measured directly using a microcontroller’s ADC channel. signals during the modulation periods.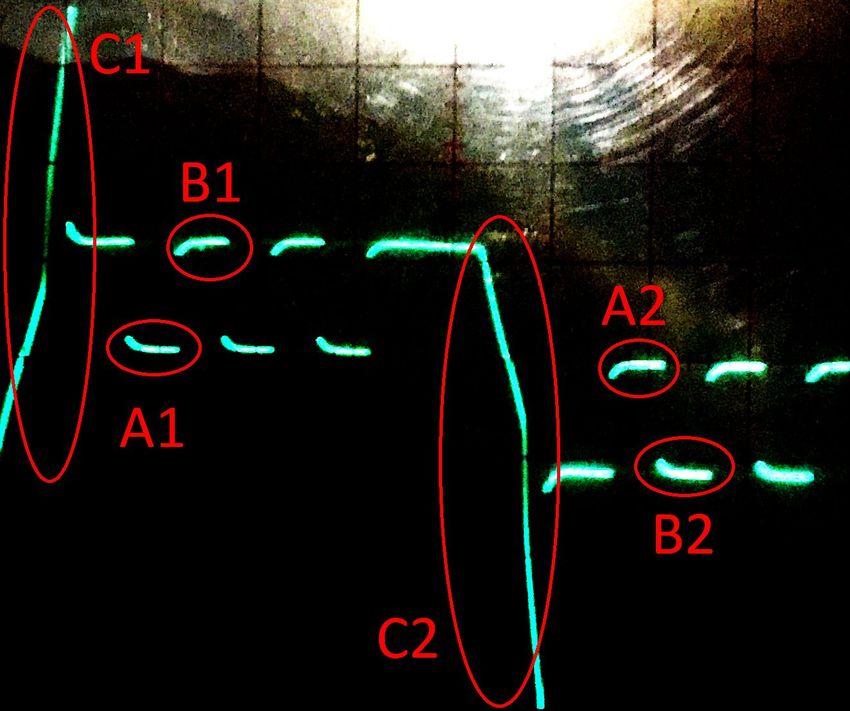
the information from the aggregated signal. Fig. 4(c) shows
           A    B                                                    our testbed setup with VLC lights and energy meter.
                                                                                            VII. E VALUATION
                                                                        In this section, we describe our experimental evaluation
                                                                     and show the efficacy of iLED w.r.t. accuracy, real-time
                                                                     monitoring, scalability, and the presence of other electric loads.
   (a) Trigger circuit             (b) Current signature                Working of iLED. Consider a legacy building as described
                                                                     in Sec. III, with VLC lights programmed with unique Gold
                                                                     codes of length L. We do not know the physical locations of
                  Energy meter
                                                                     the lights, but all the Gold codes are stored in a database,
                                                                     which can be accessed by the energy meter. When a VLC
                                                                     light is turned on it starts transmitting the unique code and
                                                                     the energy meter measures the aggregated signal that contains
    VLC-Light 1                             VLC-Light 3              signatures from multiple lights. The energy meter then com-
                       VLC-Light 2
                                                                     putes the correlation values between the measured aggregated
                                                                     signal and each code in the database using the framework
                                                                     presented in Sec. V-B to determine which lights are on/off.
                    (c) AC testbed                                   We utilize the following metrics to quantify the performance:
                    Fig. 4: iLED AC testbed.                         F-measure as a comprehensive metric of accuracy combining
   The triggering circuit is used to determine when the AC           the precision and recall, which includes the effects of false
voltage crosses a certain voltage threshold to power an LED          positives (fp ) and false negatives (fn ),
and start/stop modulating. In our setup, the trigger setpoint        F = 2 PP+R·R
                                                                                  , where P = tp tp                tp
                                                                                                  +fp and R = tp +fn .
voltage is set to 100 V as shown in Fig. 4(a). It can be seen that   Latency as the time taken to identify the status of lights.
the LED’s on time is roughly 16 ms i.e., 16  20 = 0.8, resulting
in 80% of the time for modulation.                                   A. Numerical results
   A current source is used to power the LED such that                  In Sec. V-A1 we derived bounds for the maximum number
the current drawn is constant. Fig. 4(b) shows the current           of concurrent transmitters, and proposed a probabilistic frame-
signature when an LED is modulating at 500 Hz. It can be             work to maintain the number of active ID transmissions below
seen that, in regions A1 and A2 the current drawn is zero,           that bound (Sec. V-A2). We will now shed some light about
indicating the LED off state with a ‘0’ symbol encoding. In          what this theoretical framework means in terms of monitoring
regions B1 and B2 the LED is on and we can observe a                 LED lights. Table II captures the theoretical performance of
‘1’ symbol encoding. The current source guarantees that the          our system. A constant modulating frequency of 10kHz is
current drawn by the LED (when it is on) is a constant value.        used by all VLC lights.
A voltage source is used to power the triggering circuit and            Consider a building that has 500 LED fixtures and the
the current source.                                                  facility manager would like them to send their codes con-
   Energy meter: A high-frequency, high-sensitivity energy           tinuously and simultaneously. To avoid interference problems
meter is needed to detect small current changes. But in this         at the smart meter, we will need to assign each LED a code
case we need to cope with two additional problems: the voltage       length of more than two million bits (fifth row on the left
can be positive or negative, and we need to detect exactly the       side of Table II:Without Prob. Approach). This code length
periods where modulation occurs without the help of global           would take almost 3.5 minutes to transmit at 10kHz. This is
clocks or external signals. We use a series resistor as current      a good polling time, every 3.5 minutes the facility manager can
sampler. To overcome the polarity of AC voltage over the             monitor the status of all 500 lights, but an unreasonable time
resistor (positive and negative values), the output voltage is       to get just a beacon for many VLC applications. To overcome
lifted with an offset before reading it. A triggering circuit is     this problem, we use our probabilistic approach. Now consider
used to identify the modulation regions. The energy meter            the right side of Table II. If a facility manager is willing
and lights are all in synch because the sinusoidal voltage in        to tolerate a very small error  = 0.001, the code length is
power lines is the same for the entire electrical network and        reduced significantly (from more than two million bits to 511
acts as a global clock. Note that high-end commercial energy         bits). The manager would need to wait only 13.24 seconds (on
meters could be used too [17], but they could cost between           average) to poll lights.
300-1000$.
   AC testbed: Our AC setup includes 3 VLC lights with               B. Testbed evaluation
commercial LEDs rated at 15 watts. Each LED has its own                 1) DC testbed: Our DC testbed includes six LEDs as shown
modulator and microcontroller. The microcontrollers are pro-         in Fig. 2. Each LED generates a unique code when its on. A
grammed to generate gold codes of certain length. The energy         seventh code is also stored in the database to represent an LED
meter is connected in series to measure the current and decode       in an off state.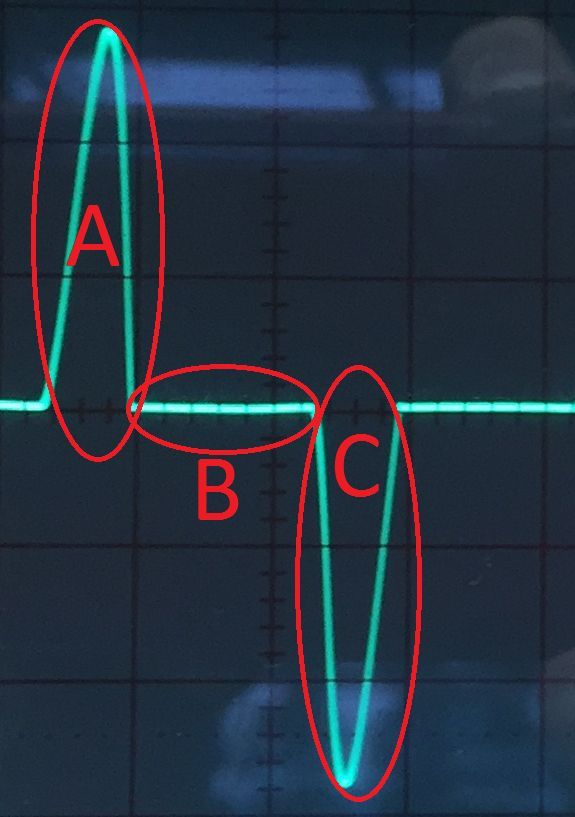
Length = 511 Length = 127 5000 300
600 200 1 800
Processed ADC Values
Code present Code present 250
4000
Raw ADC Values
Trigger Ouput
Code not present Code not present
Current (mA)
0.8
400 600
Correlation
Correlation
Threshold Threshold 200
100 3000 0.6
200 400 150
2000 0.4
0 100
0 Raw ADC Values 0.2 200
1000 50
Trigger Output
0
-200 -100 0 0 0
0 0.5 1 1.5 0 0.5 1 1.5 2 0 10 20 30 0 10 20 30
(a) Time (s) (b) Time (s) (c) Time (ms) (d) Time (ms)
Fig. 5: (a) Correlation values for L=511 in DC testbed (b) Correlation values for L=127 in DC testbed (c) Aggregated current
consumption in AC testbed (d) Processed current in AC testbed.
TABLE II: Concurrent transmitters (m), code length (L) and for each of the three LEDs and one to represent an LED in the
latency without and with the probabilistic approach. off state. From our analysis, a code of length 127 or higher
Without Prob. Approach With Prob. approach would avoid interference. A constant modulating frequency
m L Latency m L Latency Latency of 10kHz is used by all VLC lights. Fig. 5(c) shows the
(s) (=0.001) (=0.1)
7 511 0.0511 9 7 6.31 0.06
aggregated signal and the corresponding trigger output. To
31 8191 0.8191 33 31 2.22 0.19 extract the modulated signal, we first filter the aggregated
63 32767 3.2767 65 63 8.91 0.77 signal when the trigger output is low, and then, normalize the
127 131071 13.107 129 127 3.79 0.93
511 2097151 209.72 513 511 13.24 5.62
raw ADC values. Fig. 5(d) shows the normalized ADC values
1023 8388607 838.86 1025 1023 53.10 22.50 and the corresponding current drawn by the three LEDs.
2047 33554431 3355.4 2049 2047 65.36 37.64 Fig. 6(a) shows the correlation values when a code is present
and not present in the aggregated signal. When a code is
Case without interference: Code length 511, modulation present, the correlation values have peaks around the code
frequency 1kHz. When there are six concurrent VLC lights, length (127). Since the codes present in the received signal
a code length of 511 or higher is required to ensure no were accurately identified all the time, the F-measure is 1
interference occurs (see Table. I). To determine if an LED with no false positives. In both testbeds, AC and DC, the
is on, the energy meter computes the correlation between the experiments were conducted more than ten times and each
LED’s ID and the aggregated signal measured at the power run was around five to ten minutes long.
meter. If a code is present, the correlation will have peaks C. Scalability analysis
of length L. If the code is not present, the correlation will To validate the applicability of iLED in buildings with
always be lower than the threshold T = L/2. Fig. 5(a) shows thousands of lights we perform a scalability analysis using
the correlation values when a code is present and not present simulations. We test the scalability of our approach by employ-
(seventh code) in the received aggregated signal. We can see ing the probabilistic method described in Sec. V-A2, which
that when the code is present, correlation values have peaks dictates that all VLC lights only transmit their codes with a
around 511 (blue peaks). When the code is not present the probability p. Let us consider a building with 129 LEDs, which
correlation values are always below the threshold (T =511/2). would require Gold codes of length L = 2n − 1 = 127.
Case with interference: Code length 127, modulation fre- Analyzing the trade-off between , accuracy and polling
quency 1kHz. To demonstrate the importance of selecting the time. Fig. 6b shows the accuracy of identifying an LED,
right code length given m maximum concurrent transmitters, when 129 LEDs are transmitting their code sequences of
let’s take a code length that is less than 511, say 127, for length 127 with = 0.1. The x-axis indicates the time in
each of the six LEDs. From our analysis, we can see that seconds, the left y-axis indicates the number of concurrent
only three concurrent transmitters should be present so that no transmitters at each time slot, and the right y-axis indicates
interference occurs for this code length (see Table I). However, the percentage of unique LED IDs that have been successfully
if all six VLC lights transmit their code simultaneously there transmitted. The dotted line indicates the maximum number of
will be interference and the accuracy of identifying lights will concurrent transmitters such that no interference takes place
be reduced. Fig. 5(b) shows the correlation values when a (for L = 127, m should be 3 c.f. Table I). Fig. 6b also shows
code is present (blue line) and not present (black line) in the corresponding F-measure. When the number of concurrent
the received signal. The correlation values for the code that transmitters are below or equal to the line, there exists minimal
is present have clear peaks crossing the threshold. However, interference and it does not affect the accuracy (F-measure is
the correlation values of a code that is not present also have equal to one, no false positives/negatives). However when the
instances which cross the threshold (peaks crossing the red number of concurrent transmitters is higher than m, depending
line), leading to false positives. This is due to the high number upon the cross-correlation with other codes, the interference
of concurrent transmitters for the chosen code length. may be high enough to affect the accuracy. In some instances
2) AC testbed: Our AC testbed includes three LEDs each there are no false positives as the cross-correlation between the
rated at 15 watts, c.f. Fig. 4(c). We use four gold codes, one codes is not high enough to interfere (see time period 0.1 s with
Length = 129 Length = 127, = 0.1 Length = 127, = 0.001
No. of concurrent transmitters
No. of concurrent transmitters
% of unique transmitters
% of unique transmitters
100 6 100
10 No. of concurrent transmitters No. of concurrent transmitters
100 m m
80 80
% of unique transmitters % of unique transmitters
Correlation
F-measure in % 4 F-measure in %
60 60
0
5
40 40
Code present 2
-100 Code not present 20 20
Threshold
0 0
0 10 20 30 0 0.2 0.4 0.6 0.8 0 1 2 3
Time (ms) Time (s) Time (s)
(a) Correlation values in AC testbed. (b) 129 LEDs, = 0.1. (c) 129 LEDs, = 0.001.
Fig. 6: Scalability analysis.
Trigger for three lights, (2) Appliance data, which is the aggregated
Appliance data output
current trace of appliances obtained from the public databases;
FFT Filter iFFT Disaggregated and (3) Combined data, which merges LED and Appliance
LED data
data into a single trace.
LED data 1) Combining Appliance and LED data: There are very few
energy datasets that have high frequency smart meter data. We
use two datasets viz., REDD(http://redd.csail.mit.edu) and UK-
Fig. 7: Disaggregating LED data from combined data. DALE(https://www.doc.ic.ac.uk/\∼dk3810/data/), which pro-
vide high frequency samples for the total energy consumption
4 transmitters). In other instances however the interference is
of a household, 15kHz and 16kHz respectively. To combine
high and the F-measure drops (see time period 0.3-0.4 s). Note
the appliance data from open datasets with our LED data, we
that the percentage of transmitters that successfully transmit
ensure two things (i) phase alignment: align the x-axis of both
its code at least once increases linearly over time, since in
signals with respect to the zero crossing points of voltage; and
each slot all transmitters have an equal probability of being
(ii) polarity alignment: align the y-axis of signals to follow
chosen. In our evaluation, the total time required to identify
the positive and negative parts of voltage oscillation. We use
all 129 LEDs is around 1 second.
the data from House 3 of the REDD dataset, which includes
Fig. 6c shows the evaluation result when = 0.001. It can
energy consumption from diverse set of appliances such as
be seen that over time, the number of concurrent transmitters is
Lighting (6 fixtures), Fridge, Electric furnace, Microwave,
always below the maximum number of concurrent transmitters
Sockets and CE appliances. Fig. 8(a) shows the aligned
(m=3). Hence the F-measure in this setup is always equal to
appliance and LED data.
1. However, the time required to successfully identify all the 2) Filtering Appliance and LED data: In order to discern
LEDs is around 4 seconds. Extensive scalability analysis of the LED data from combined data, we use Fourier transforms.
iLED has been performed for different building settings with Our method has two main components: determine active
thousands of lights. For example, a building with 2049 LEDs frequency and filtering.
transmit their IDs under 38 seconds when = 0.1. Determine active frequencies. The goal of this step is to
D. Impact of other loads identify the most active frequencies in the appliance data, so
Until now, we have discussed iLED’s performance only we can later filter them out. First, we perform a FFT over
in scenarios where lights are present. While some buildings the appliance data, as shown in Fig 8(b). Any frequency
have separate power lines for lighting, households and legacy component with an intensity higher than δ is recorded in an
buildings usually have a single power line. In this section, we array. The selection and impact of δ in iLED’s performance
use a data-driven approach to describe the impact of other is clarified later.
electric loads and show that iLED is still resilient enough Filtering. The goal of this step is to obtain the LED data
to monitor the status of lights. iLED requires high frequency from the combined data. First, we perform a FFT over the com-
smart meters, which are expensive to deploy. Taking advantage bined data. Then we filter out all the frequencies determined
of the fact that current traces can be combined, because power previously by the δ parameter. This step will remove some
(P) is a linear function of current (I); we use high frequency information from the LED data, because some frequencies of
measurements of several households from open datasets and the LED and appliance data overlap, but not much information
merge them with the LED traces obtained from our testbed. is lost. Finally we apply an inverse FFT (IFFT) to reconstruct
This combined signal includes both appliances and LED data. the LED data in the time domain, as shown in Fig. 8(c).
At the core of our method lies the concept of Fast Fourier 3) Monitoring and decoding accuracy: From, this step
Transforms (FFT). Fig. 7 shows the overview of our approach. onwards we follow the general iLED framework. The LED
For our explanation we define the following type of traces: (1) data in the time domain is processed using the triggering
LED data, which is the current trace obtained in our testbed signals, as shown in Figs.8(c-d). This step has two important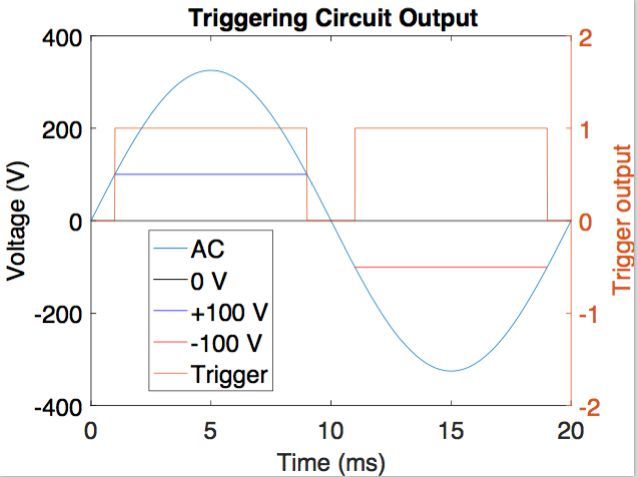
40 20 1 4
LED data
|P1(f)| (Intensity)
20 15 Appliances data 2
Current (A)
Current (A)
0.5
0 10 0
-20 5 0 -2
Appliances data 0 1000 2000 3000 4000 5000 Disaggregated LED data
LED data Trigger
-40 0 -4
0 5 10 15 20 0 1000 2000 3000 4000 5000 0 5 10 15 20
Time (ms) f (Hz) Time (ms)
(a) Aggregated appliances and LED data. (b) FFT plots. (c) Disaggregated LED data.
1.5 0.1 Correlation of ground truth LED data
Correlation Correlation
200
LED 0
0 LED 1
Current (A)
1 LED 2
BER
-200 Threshold
0.05 Correlation of disaggregated LED data
0.5 200
Disaggregated LED data
0
Ground truth LED data
0 0
0 5 10 15 20 -200
0 0.01 0.02 0.03 0.04 0.05 0 5 10 15 20
Time (ms) Threshold Time (ms)
(d) Disaggregated and ground truth LED data. (e) BER plot against threshold. (f) Correlation values.
Fig. 8: Disaggregating LED data from appliances data.
results: the decoding process and the correlation process. R EFERENCES
Decoding: We compare the filtered LED signal with the [1] Trends in lighting in commercial buildings [online] https://www.eia.gov/
ground truth LED signal in Fig.8(d). We can see that there consumption/commercial/reports/2012/lighting/
are some bit errors in the code. To evaluate the impact of [2] Forecast of Energy Savings from LED Lighting [online] http://energy.
gov/eere/ssl/ssl-forecast-report
δ, we compute bit error rates (BER) across various intensity [3] Lighting in supermarkets [online] http://www.lighting.philips.com/main/
thresholds, as shown in Fig. 8(e). We can observe that in cases/cases/food-and-large-retailers/carrefour-lille.html
general BER values are low. Thus, there is a wide range over [4] K. C. Armel, A. Gupta, G. Shrimali, A. Albert. Is disaggregation the
holy grail of energy efficiency? The case of electricity. In Energy Policy.
which the values of δ would lead to a good performance. [5] S.N.A.U.Nambi, Personalized Energy Services: A Data-Driven Method-
Correlation: While the BER is low, the key question to ology towards Sustainable, Smart Energy Systems, 2017
answer is: can we accurately identify the status of the LED in [6] Y. Kim, T. Schmid, Z. M. Charbiwala, and M. B. Srivastava. ViridiS-
cope: design and implementation of a fine grained power monitoring
spite of these errors? To this end, we compute the correlation system for homes. In UbiComp, 2009.
values of the filtered LED data, and for comparison, we also [7] N. Batra, M. Gulati, P. Jain, K. Whitehouse, and A. Singh. Bits and
compute the correlations with the ground truth LED data. watts: improving energy disaggregation performance using power line
communication modems: poster abstract. In BuildSys, 2009.
Fig. 8(f) shows both correlation results. In general, when [8] F. Englert et al. LightMon: Apportioning the Effect of Light Switching
a code is present in the signal, we can still obtain peaks Events on the Electricity Consumption of Buildings. In EWSN, 2009.
showing (correctly) that the LED was on (even with a few [9] S. Gupta, M. S. Reynolds, and S. N. Patel. Electrisense: single-point
sensing using emi for electrical event detection and classification in the
bit errors). The reason for this resilience is that the correlation home. In UbiComp, 2010.
outcomes are not affected greatly with a few bit errors because [10] Philips Hue [online] http://www2.meethue.com/en-in/
correlations are sums over all bits in a code. Thus the proposed [11] M. Gulati, S. Sundar Ram, and A. Singh. An in depth study into using
emi signatures for appliance identification. In BuildSys, 2014.
iLED framework can accurately identify LEDs when other [12] Power over Ethernet [online] http://luxreview.com/article/2016/08/
loads are present.We evaluated our approach across other what-nobody-tells-you-about-power-over-ethernet
households data in the REDD dataset (i.e., House 5) and other [13] N. Roy et al. Performance of the latest generation powerline networking
for green building applications. In BuildSys, 2013.
datasets such as UK-DALE. The results show similar trends. [14] R. Murty, J. Padhye, R. Chandra, A. R. Chowdhury, and M. Welsh. Char-
acterizing the end-to-end performance of indoor powerline networks.
VIII. C ONCLUSIONS Microsoft Research, 2008.
[15] S. Schmid et al. EnLighting: An Indoor Visible Light Communication
The key contribution of our work is the proposition of a new System based on Networked Light Bulbs In SECON, 2016.
tool to monitor the status of lights via energy disaggregation. [16] L. Li, P. Hu, C. Peng, G. Shen, and F. Zhao. Epsilon: a visible light
based positioning system. In NSDI, 2014.
At the core of that contribution is the idea of enabling lights [17] Accuenergy Energy Meter [Online] https://www.accuenergy.com/
to modulate interference-resilient IDs in the current domain. product/acudc-dc-power-energy-meter
Our proposal provides a unique perspective compared to what [18] E. H. Dinan and B. Jabbari. Spreading codes for direct sequence cdma
and wideband cdma cellular networks. IEEE Comm. Magazine, 1998.
is available in the state-of-art, because we do not rely on [19] A. Mitra. On pseudo-random and orthogonal binary spreading se-
the ‘default’ signatures that light bulbs create, but rather quences. In Journal of Information Techn, 2008.
shape them without affecting the main purpose of illumination. [20] R. Gold. Maximal recursive sequences with 3-valued recursive cross-
correlation functions. In IEEE Trans. on Information Theory, 1968.
iLED is a novel concept, but there is plenty of room for [21] S. S. Agaian. Hadamard matrices and their applications, In Lecture
improvement. The next step is to test iLED in a real setting at Notes in Mathematics, 1985.
a larger scale, including the effects of various electric loads.
You can also read