Atomic mechanism of metal crystal nucleus formation in a single-walled carbon nanotube - Uni Ulm
←
→
Page content transcription
If your browser does not render page correctly, please read the page content below
Articles
                                                                                                        https://doi.org/10.1038/s41557-020-0538-9

Atomic mechanism of metal crystal nucleus
formation in a single-walled carbon nanotube
Kecheng Cao1, Johannes Biskupek 1, Craig T. Stoppiello2, Robert L. McSweeney2,
Thomas W. Chamberlain 3, Zheng Liu 4,5, Kazu Suenaga4, Stephen T. Skowron 2, Elena Besley                                                            2
                                                                                                                                                         ,
Andrei N. Khlobystov 2 ✉ and Ute Kaiser 1 ✉

Knowing how crystals nucleate at the atomic scale is crucial for understanding, and in turn controlling, the structure and prop-
erties of a wide variety of materials. However, because of the scale and highly dynamic nature of nuclei, the formation and early
growth of nuclei are very difficult to observe. Here, we have employed single-walled carbon nanotubes as test tubes, and an
‘atomic injector’ coupled with aberration-corrected transmission electron microscopy, to enable in situ imaging of the initial
steps of nucleation at the atomic scale. With three different metals we observed three main processes prior to heterogeneous
nucleation: formation of crystal nuclei directly from an atomic seed (Fe), from a pre-existing amorphous nanocluster (Au) or by
coalescence of two separate amorphous sub-nanometre clusters (Re). We demonstrate the roles of the amorphous precursors
and the existence of an energy barrier before nuclei formation. In all three cases, crystal nucleus formation occurred through a
two-step nucleation mechanism.

N
         ucleation lies at the heart of the crystallization process and       so that the nucleation processes are measured in ex situ discrete
         critically determines the structure and size distribution of         steps. An alternative liquid-cell TEM technology enables imag-
         crystals and thus the functional properties of all materi-           ing of the nucleation and growth processes of metal nanocrystals
als, from semiconductors to pharmaceuticals1. Classical nucleation            (such as Au11 and Pt25) and inorganic compounds (such as PbS26)
theory (CNT), developed to elucidate the nucleation of crystals,              in solutions in real time with high temporal and spatial resolution.
describes crystal formation in a single step from monomers (atom,             However, both the sheer volume of the liquid and the material of
ion or molecule), by attachment of individual monomers to an                  the liquid-cell window inevitably scatter electrons during the TEM
ordered structure, overcoming a single free-energy barrier2,3. This           imaging process, which, combined with the lack of control over the
can be extended to rationalize the formation and nucleation of crys-          location and rate of seed nucleation and the ephemeral nature of
tals through thermodynamically metastable precursors (ordered or              the nucleation process, preclude the observation of the very early
disordered) in a single step3,4. However, there are a number of exper-        stages of nucleation with atomic resolution. Essentially, an atomi-
imental observations that cannot be satisfactorily explained using            cally accurate description of the nucleation process is currently hin-
this theory, leading to the postulation of the more complicated               dered by the fact that the critical nucleus sizes are believed to fall
and contentious two-step nucleation mechanism (TSNM)5–10. This                in the range of 100–1,000 atoms, which is inaccessible for atomi-
assembly pathway involves the initial formation of an amorphous               cally resolved investigations by any current analytical methods.
‘precursor’ phase, which is subsequently superseded by a more                 Therefore, a conceptually new experimental approach is necessary
stable crystalline phase11–14, or formation of stable species (ordered        to enable the direct observation of nucleation at the atomic level in
or disordered), which never dissociate even in undersaturated con-            real time, and to allow observation to be conducted in a controlled
ditions and can crystallize if more monomer is supplied15–18. As a            and well-defined environment27. Here we apply in situ low-voltage
result of the two energy barriers in a TSNM, the initially formed sta-        aberration-corrected high-resolution TEM (AC-HRTEM) to
ble or metastable precursor phase can either proceed to crystallize           study the nucleation of a metal crystal nucleus at the single atom
into a crystalline phase by overcoming an additional energy barrier           level inside an electron-transparent test tube, a single-walled
for crystallization or dissociate back into monomers by overcoming            carbon nanotube (SWNT), which possesses a well-defined atomi-
the energy barrier for monomer detachment3.                                   cally smooth surface and outstanding thermal, mechanical and
    A range of analytical techniques, such as X-ray diffraction19,20,         chemical stability under a range of conditions, including an 80-keV
atomic force microscopy3,21,22 and optical microscopy23, are com-             electron beam28–31.
monly applied to investigate and establish different mechanisms
of nucleation processes. For example, cryogenic transmission                  Results and discussion
electron microscopy (cryo-TEM) allows imaging of the different                Fe crystal nuclei formed from an atomic seed. In previous works,
nucleation stages of inorganic and organic compounds, such as                 we have demonstrated that SWNTs can act as effective host struc-
magnetite15 or dyes in solution24, which are frozen and suspended             tures for extremely small (30–60 atoms) metal clusters29,31. In this

1
 Central Facility for Electron Microscopy, Group of Electron Microscopy of Materials Science, Ulm University, Ulm, Germany. 2School of Chemistry,
University of Nottingham, University Park, Nottingham, UK. 3Institute of Process Research & Development, School of Chemistry, University of Leeds,
Leeds, UK. 4Nanomaterials Research Institute, National Institute of Advanced Industrial Science and Technology (AIST), Tsukuba, Japan.
5
 Inorganic Functional Materials Research Institute, National Institute of Advanced Industrial Science and Technology (AIST), Nagoya, Japan.
✉e-mail: andrei.khlobystov@nottingham.ac.uk; ute.kaiser@uni-ulm.de

Nature Chemistry | www.nature.com/naturechemistry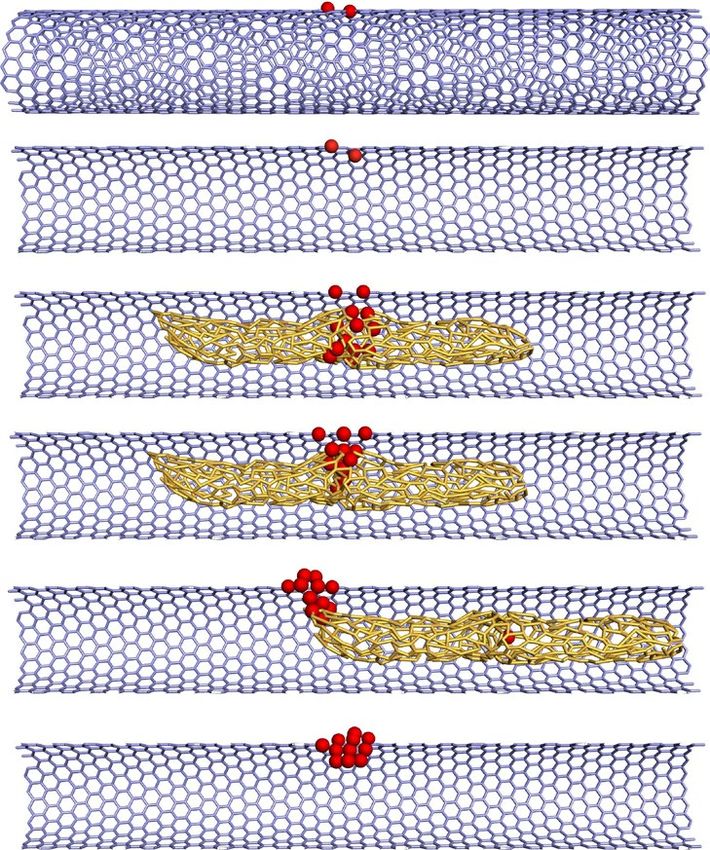
Articles                                                                                                                                  NAtuRe CHemIstRy

a                                                                                                          e
                                                                                                               0s

                                                                                                               52 s
b

                                                                                                               60 s

c                                                                             d                                66 s
                                                                                  i          ii       C

                                                                                                               87 s

                                                                                  iii   Fe   iv   C + Fe
                       400
                              C edge
    Intensity (a.u.)

                       200
                                                                                                               91 s

                                                     Fe edge

                         0
                             200       400        600           800   1,000
                                             Energy loss (eV)

Fig. 1 | Structure of Fe@SWNT and time-series AC-HRTEM images of an atomic injector. a, AC-HRTEM image showing a SWNT with three Fe atoms on
its wall. Scale bar, 1 nm. b, A SWNT containing Fe clusters and amorphous carbon combined in a variety of different structures (Fe clusters are indicated
by the red arrows). The first, second and fourth Fe clusters from left to right combine with amorphous carbon while the third is an isolated Fe cluster. Scale
bar, 1 nm. c, HAADF-STEM image of Fe@SWNT with an EELS spectrum (inset) recorded in the white boxed area. Scale bar, 1 nm. d, EELS mapping of the
selected area in c: (i) HAADF-STEM image of the selected area; (ii) distribution of carbon; (iii) distribution of iron; (iv) distribution of carbon and iron.
Scale bars, 1 nm. e, A typical example of an Fe@SWNT-based atomic injector as a time series of AC-HRTEM images, with an Fe cluster translating back and
forth from 0 s to 60 s and an Fe cluster–amorphous carbon complex translating from the left side to the right from 60 s to 91 s under 80-keV electron-beam
irradiation. The positions of the Fe cluster are indicated by red arrows and the positions of the Fe cluster–amorphous carbon complex by green arrows.
Scale bar, 2 nm. More detailed information about this process is provided in Supplementary Fig. 2.

study, we extend this approach to atomic-scale experiments that                                     ferrocene serve as vehicles for the delivery of Fe atoms to the grow-
allow the observation of the initial steps of the nucleation processes                              ing nucleus, atom by atom, effectively acting as an ‘atomic injector’.
of γ-Fe, Au and Re crystal nuclei, at the atomic level and in real                                      Amorphous carbon forms a complex with the Fe atoms (Fig. 1b,
time, by means of low-voltage AC-HRTEM imaging. The SWNT                                            Fe atoms are indicated by the rightmost red arrow), which appears to
provides an ideal cavity for atom transport and a substrate for the                                 be very mobile, sliding along the nanotube cavity on the timescale of
heterogeneous nucleation of metal, which prevents ionization by                                     a few seconds, probably driven by thermal energy or electron-beam
the electron beam due to its conductive structure. Here, the electron                               excitation, due to the extremely low friction of the atomically
beam of the TEM is not only an imaging probe but also a stimu-                                      smooth SWNT32–34 (Supplementary Section 3). High-angle annu-
lus for the nucleation processes by transferring kinetic energy from                                lar dark-field scanning TEM (HAADF-STEM) and corresponding
the incident electrons to the atoms. The transferred kinetic energy                                 electron energy loss spectroscopy (EELS) mapping (Fig. 1c,d) con-
has a maximum value and computable distribution (Supplementary                                      firm the presence of Fe in the highly mobile atomic injector. The
Fig. 1), and it is able to drive the chemical reactions of molecules28                              time-series AC-HRTEM images in Fig. 1e show a typical example of
and the dynamics of metal clusters29. In the case of metal clusters,                                the atomic injector in action (Supplementary Section 3): stimulated
the transferred kinetic energy increases their total free energy in                                 by the electron beam, a cluster of Fe atoms move back and forth
a fashion similar to a heating process. Here, the increase in total                                 during the first 60 s. Owing to the fact the Fe cluster is moving
free energy can be controlled by adjusting the accelerating voltage                                 quickly and stops at two positions in the SWNT during the expo-
and dose rate of the electron beam, thus promoting the nucleation                                   sure time of 1 s per frame, two images with lower contrast (indi-
processes of metal crystallites in a similar fashion to a thermal acti-                             cating partial occupancy) appear in frames at 0 s and 52 s. At 60 s,
vation. To investigate nucleation from the most initial stages with                                 the carbon cluster bonds to the Fe cluster and then translates to the
atomic resolution, it is important to obtain a fixed and observable                                 right side of the SWNT in the next 25 s.
nucleation seed with only a few atoms. As shown in Fig. 1a, a cluster                                   The entire nucleation process of γ-Fe is successfully observed
containing three Fe atoms located on the wall of a SWNT can serve                                   and recorded by AC-HRTEM using 80-keV electrons with a dose
as a nucleation seed in the present experiments. During nucleation                                  rate of 1.4 × 10⁶ e− nm−2 s−1, providing a steady source of energy to
in bulk, the additional atoms or molecules are delivered to the seed                                the atoms, with the SWNT wall acting as substrate for a nucleation
by random collisions, which is a thermally driven stochastic process                                seed (Supplementary Video 1). The first stage (0–13 s, Fig. 2) shows
with complex mechanisms. In a SWNT the situation is significantly                                   the formation of a ‘diatomic seed’: two Fe atoms form a pair on the
simplified: while the wall of the nanotube provides a substrate                                     outside of the SWNT wall with a distance of 0.32–0.34 nm between
for nucleation, mobile clusters of amorphous carbon liberated from                                  the metal atoms. This distance is substantially longer than the

                                                                                                                           Nature Chemistry | www.nature.com/naturechemistry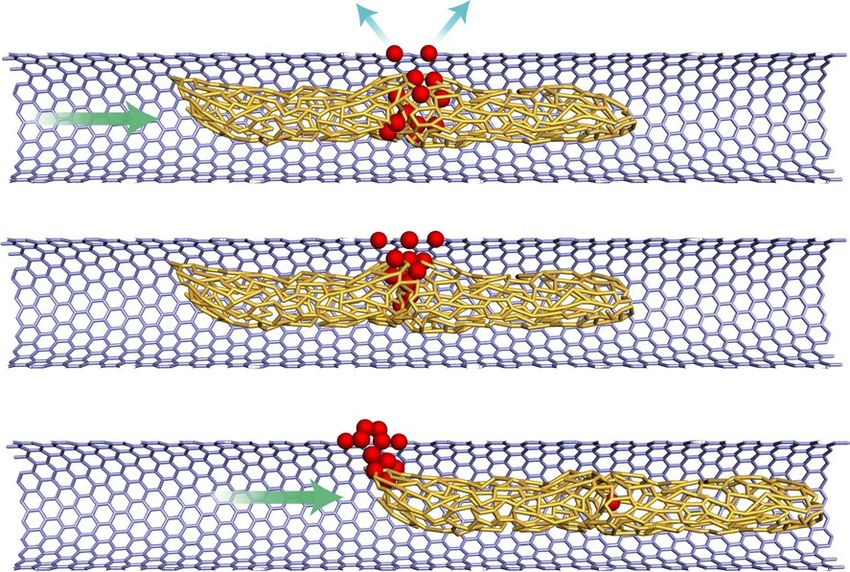
NAtuRe CHemIstRy Articles
a b
0s
8s
13 s
19 s
23 s
50 s
Fe atoms SWNT Amorphous carbon
c d e
0s
0.32 nm
8s 0.34 nm
0.43 nm
13 s
19 s
23 s
50 s
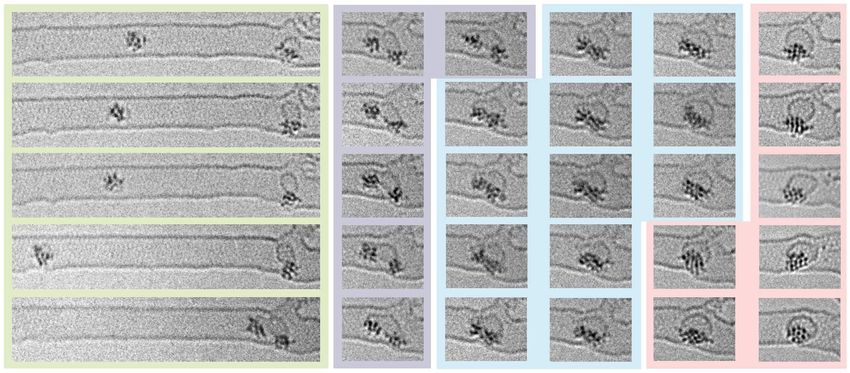
Fig. 2 | Sequential AC-HRTEM images and corresponding simulations showing the first and second stages of γ-Fe crystallite nucleation. a, AC-HRTEM
raw images of the first stage from 0 s to 13 s, ‘diatomic seed’ formation, and the second stage from 13 s to 50 s, the ‘atom delivery process’. Exposure time,
0.25 s per frame. Scale bar, 2 nm. b, Schematic showing the role of the atomic injector, in which the atomic injector is propelled to the seed, providing
individual Fe atoms, before it continues moving along the SWNT cavity (the blue arrows indicate the steric hindrance between the diatomic seed and the
atomic injector and the green arrows indicate the direction in which the atomic injector moves). c, Enlarged regions of the AC-HRTEM series are shown in
a, with atomic separations shown. The fifth rows in c and e are shifted to enable a full view of the atomic injector. The distances between two Fe atoms in
the first three frames are labelled in yellow. Scale bar, 1 nm. d, Modelled structures corresponding to the experimental images in c. The chiral index of the
SWNT is n = 18, m = 2, as calculated in Supplementary Fig. 14. e, Simulated TEM images from the structures in d. The SWNTs in the modelled structures in
b and d have clipping planes to highlight the structure of Fe clusters. Scale bar, 1 nm.
calculated equilibrium bond length of 0.20 nm for an isolated Fe2 Fig. 2b,c) in which the right Fe atom of the seed is pushed out and
molecule (Supplementary Section 1), and corresponds to a reduc- the distance between the two Fe atoms is increased to 0.43 nm. The
tion in the bond energy of the dimer from 2.2 eV (at 0.20 nm) to enlarged inter-atomic distance corresponds to a reduction in the
0.8 eV (at 0.33 nm). This demonstrates the templating role of the bond energy of an isolated dimer by 90% to only 0.2 eV, and as such
underlying SWNT substrate in controlling the Fe–Fe distance and is more akin to two independent Fe atoms held apart by bonding to
making it more comparable to bulk γ-Fe (0.29 nm) than gas-phase the SWNT than an Fe2 dimer.
Fe2. At 8 s, the right Fe atom passes through the carbon wall and The separation frees up space for a third atom, which subse-
enters into the cavity of the SWNT (Fig. 2c). Given that it is not quently migrates from the atomic injector into the seed at 19 s, sig-
possible for atoms to permeate the carbon lattice of a SWNT, the nifying the beginning of the second stage of nucleation—the ‘atom
observed migration of Fe indicates the presence of vacancy defects delivery’ process (13–50 s). Over the next 4 s, the diatomic seed
in the SWNT wall, which may facilitate bonding of the Fe atoms to grows into a cluster of 17 Fe atoms (determined from image analysis
the SWNT. At 13 s, the atomic injector translates along the nanotube in Supplementary Section 7), with only one Fe atom remaining in
and moves toward the diatomic seed (Fig. 2a). The consequence of the atomic injector. The structure of the growing Fe cluster at this
the interaction between the mobile atomic injector and the station- stage stays amorphous. Metallic bonding may act as an attractive
ary seed becomes apparent in the next sequence of events (13–50 s, force, pulling the atomic injector towards the Fe seed and holding
Nature Chemistry | www.nature.com/naturechemistry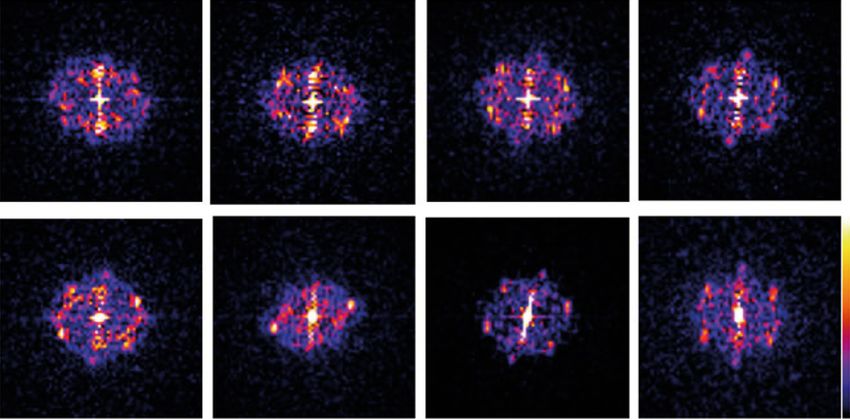
Articles                                                                                                                                           NAtuRe CHemIstRy

a 50 s               53 s               60 s               74 s              100 s                    b
                                                                                                                          7 × 10⁴
  i
                                                                                                                          6 × 10⁴

                                                                                                   Crystallinity (a.u.)
                                                                                                                          5 × 10⁴

 ii                                                                                                                       4 × 10⁴

                                                                                                                          3 × 10⁴

                                                                                                                          2 × 10⁴
iii

                                                                                                                          1 × 10⁴
                                                                                                                                    40   60   80    100   120   140   160   180   200
iv                                                                                                                                                 Observation time (s)

                                                                                                      c
      127 s          163 s             172 s              187 s              197 s

                                                                                                        Diatomic seed 0–13 s
  i

                                                                                        0.25 nm         Atom delivery process 13–50 s

 ii

                                                                                                        Metastable amorphous state 50–187 s

iii

iv                                                                                                      Ordered crystallite 197 s

Fig. 3 | Sequential AC-HRTEM images and corresponding image simulations showing the third and fourth stages of γ-Fe crystallite nucleation.
a, Time-series AC-HRTEM images of the third ‘metastable amorphous state’ stage from 50 s to 187 s and the fourth ‘ordered crystallite’ stage at 197 s are
shown in the first row (i). Scale bar, 1 nm. The exposure time for the frames between 50 s and 127 s is 0.5 s, and 1.0 s from 127 s to 197 s. The FFT results
corresponding to the outlined areas in the AC-HRTEM images are depicted in the second row (ii) and used to quantify the crystallinity of the Fe cluster at
each point in time (via the appearance of an extra Fe reflection, Supplementary Section 6). Scale bar, 5 nm−1. The modelled structures and simulated TEM
images for the proposed structures of the Fe clusters that correspond to the AC-HRTEM images in the same column are presented in the third (iii) and
fourth rows (iv). Scale bar, 1 nm. b, Quantified measure of the crystallinity by comparing the intensities of the reflection spots in the FFT results for the Fe
clusters. The measured reflection spots are chosen from the probable characteristic diffraction spot areas where the γ-Fe-reflection appears. c, Timeline of
the whole experiment, with the structural evolution of the γ-Fe crystallite consisting of the four stages of crystallite formation.

it in place during the atom delivery stage, because after most of the                uniform inter-atomic distances matching the (111) plane of the
Fe atoms are injected (at 23 s, Fig. 2a) the remaining, relatively weak              γ-Fe crystal lattice. This represents the fourth stage, designated
van der Waals force is unable to retain the mobile atomic injector                   the ‘ordered crystallite’ stage, which marks the end of the nucle-
in the vicinity of the Fe cluster and the atomic injector moves away                 ation process, as from this point further growth of the crystallite
along the nanotube (50 s in Fig. 2a). The real-time imaging of the                   will be strictly templated by the structure of the ordered crystal-like
atom delivery process enables the visualization of precise details of                nucleus. The degree of atomic order in the Fe cluster was elucidated
the initial stages of crystallite nucleation, showing how the discrete               by fast Fourier transform (FFT) analysis (second row, Fig. 3a),
atoms become a cluster by joining to the diatomic seed in steps.                     allowing quantitative analysis of changes in the relative degree of
    At the point of atomic injector departure (50 s), a ‘metastable                  crystallinity over time (Fig. 3b and Supplementary Section 6).
amorphous state’ stage begins as the structureless sub-nanometre                         In the diatomic seed stage, interactions between the Fe diatomic
cluster containing ~17 Fe atoms undergoes continuous reorganiza-                     seed and the SWNT reduce the total free energy of the dimer and
tion for the next 147 s. During this stage, the Fe atoms shuttle back                stabilize the seed, which is similar to the stabilization that occurs
and forth between the outer and inner surface of the SWNT, with                      in heterogeneous nucleation processes where the nucleation hap-
the inter-atomic distances and coordination numbers of Fe atoms                      pens at the gas–solid, gas–liquid or solid–liquid interface. However,
continuously and randomly changing over time (Fig. 3a). The highly                   the diatomic seed is able to dissociate back into discrete atoms
dynamic nature of the metal cluster at this stage is consistent with                 (Supplementary Fig. 8), highlighting the metastable nature of
the notion of a metastable amorphous cluster, such that the posi-                    the seed and that the free-energy barrier to Fe-atom detachment
tions of the constituent atoms are extremely sensitive to local condi-               is small for seeds of this size under the present conditions (room
tions such as temperature, pressure and the local environment, all                   temperature, vacuum, carbon surface) (Supplementary Section 4).
of which can influence the reorganization process and thus the final                 Calculations (Supplementary Section 1) show that the atomization
structure of the crystallite nucleus. Finally, the amorphous clus-                   energy required for Fe2 is 2.2 eV (1.1 eV per atom), rising to 4.3 eV
ter becomes ordered (at 197 s, Fig. 3a) with the Fe atoms adopting                   (1.4 eV per atom) for Fe3. The observed extended lifetime of the

                                                                                                                                Nature Chemistry | www.nature.com/naturechemistry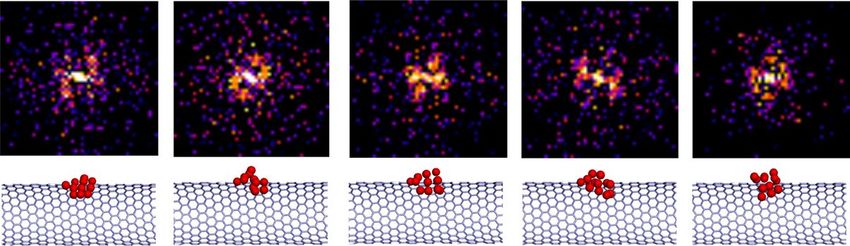
NAtuRe CHemIstRy                                                                                                                                               Articles
 a
 0s                               2s                               17 s                                                 21 s                           23 s

 25 s                             31 s                             48 s                                                 72 s                           116 s

 149 s                            198 s                            274 s                                                331 s                          370 s

 b                                                                                            c
 0s                    17 s                   23 s                 25 s                                           5.0 × 10⁶

                                                                                                                  4.0 × 10⁶

                                                                                          Crystallinity (a.u.)
                                                                                                                  3.0 × 10⁶

                                                                                                                  2.0 × 10⁶
 48 s                   274 s                 331 s                 370 s
                                                                                                                  1.0 × 10⁶

                                                                                                                  0.5 × 10⁶

                                                                                                                           0
                                                                                                                                0   50   100     150     200      250   300   350
                                                                                                                                               Observation time (s)

 d
 0s                                             17 s                                                             25 s                                          370 s

Fig. 4 | Electron-beam-stimulated nucleation of Au crystallite from the amorphous state. a, Time-series AC-HRTEM images showing an amorphous
Au cluster gradually transforming into its crystalline structure under 80-keV electron-beam irradiation. The formed crystallite is indicated by red arrows.
Scale bar, 1 nm. b, FFT patterns of the corresponding areas framed by red dotted boxes in a demonstrating formation of the Au crystallite. Some Au atoms
in this Au cluster diffuse into the neighbouring carbon nanostructure, as indicated by the violet arrow in a. Scale bar, 5 nm–1. c, Quantified crystallinity of the
Au cluster during the nucleation in a and b. d, Schematic of the gradual nucleation of the Au crystallite (the amorphous parts are shown in blue and the
crystalline parts in green).

amorphous cluster of Fe atoms indicates its stability when the num-                beam, the γ-Fe crystallite begins to interact with the host SWNT,
ber of atoms is above 10, as confirmed by the observation that clus-               leading to removal of carbon atoms from the SWNT, propagating
ters containing ~10 Fe atoms never crystallize or dissociate back to               the growth of a vacancy defect, which finally leads to the rupture of
individual atoms (Supplementary Figs. 9 and 10). Significantly, once               the SWNT after 170 s (Supplementary Section 8)29.
the growth of the Fe cluster is completed, the Fe cluster contain-
ing 17 atoms stays amorphous for over 142 s before crystallizing,                  Au crystal nuclei formed from an amorphous nanocluster. The
which we regard as evidence that a metastable amorphous precur-                    importance of initially forming a metastable amorphous precursor
sor cluster is necessary for the nucleation of γ-Fe. Under the present             is further illustrated by nucleation of Au crystallites (Fig. 4). At the
experimental conditions, we also observe several examples of stable                start of the experiment, an initial stable amorphous Au cluster can
crystallites of larger sizes, such as a γ-Fe crystallite with ~100 atoms           be observed confined in the SWNT. Some Au atoms diffuse into the
(Supplementary Fig. 10). Overall, these observations are consistent                adjacent carbon nanostructure (violet arrow, Fig. 4a). In the first 16 s
with the existence of two free-energy barriers and an amorphous                    of electron-beam irradiation, the atomic structure of the cluster is
precursor state during the heterogeneous nucleation of γ-Fe, which                 extremely dynamic and appears amorphous (Supplementary Video
is consistent with the pathway proceeding via a TSNM. Although                     2). At 17 s, a metastable crystallite with a diameter of less than 1 nm
more than 10 Fe atoms appear to be necessary and 17 Fe atoms                       can be observed in the Au cluster (red arrow, Fig. 4a), which is con-
appear to be sufficient to produce an ordered crystalline nucleus,                 firmed by analysis of the corresponding FFT pattern (Fig. 4b). This
it must be noted that the critical number of atoms may be differ-                  tiny crystallite dissociates in the following 5 s and reappears again at
ent under conditions that differ from those in our experiments, as                 23 s. When the diameter of the crystallite reaches ~1 nm, it becomes
electron-beam irradiation has previously been shown to affect the                  stable over extended periods of time, with a well-ordered structure
nucleation process11,25. Being continuously irradiated by the electron             of the (111) face of Au observed. From this point, the nucleation

Nature Chemistry | www.nature.com/naturechemistry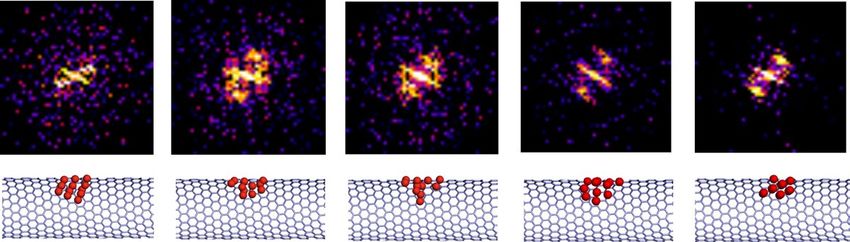
Articles                                                                                                                                                        NAtuRe CHemIstRy

 a

     0s                                                                 141 s                                  183 s                     216 s                 260 s                   345 s
                 Cluster A                         Cluster B

     60 s                                                               151 s                                  185 s                     225 s                 271 s                   370 s

     110 s                                                              157 s                                  187 s                     235 s                 282 s                   390 s

     123 s                                                              165 s                                  197 s                     243 s                 308 s                   412 s

     135 s                                                              177 s                                  206 s                     251 s                 330 s                   432 s

                             Cluster delivery process                  Coalescence                                 Metastable amorphous state                            Ordered crystallite

 b                                                                                  c
  0s         Cluster A 0 s      Cluster B 110 s Cluster A 110 s Cluster B
                                                                                                       2.00 × 10⁶                                                           Ordered crystallite

                                                                                                                                   Cluster A
                                                                                                       1.75 × 10⁶                  Cluster B
                                                                                                                                   Coalesced cluster
  141 s Cluster A 141 s Cluster B 183 s Cluster A 183 s Cluster B                                      1.50 × 10⁶
                                                                                                                                              Coalescence
                                                                                Crystallinity (a.u.)

                                                                                                                   6
                                                                                                       1.25 × 10           Cluster delivery                 Metastable
                                                                                                                              process                       amorphous
                                                                                                                                                              state
  185 s                                    243 s                                                       1.00 × 10⁶
                       206 s                                   282 s

                                                                                                       7.50 × 10⁵

                                                                                                       5.00 × 10⁵
  308 s                345 s               412 s               432 s

                                                                                                       2.50 × 10⁵

                                                                                                                       0        50      100      150   200      250      300    350     400       450
                                                                                                                                                   Observation time (s)

Fig. 5 | Electron-beam-stimulated nucleation of Re crystallite by coalescing two amorphous sub-nanometre Re clusters. a, Time-series AC-HRTEM
images showing the four key stages of Re crystallite nucleation, starting with two amorphous sub-nanometre Re clusters (Supplementary Video 3). From
0 s to 135 s, one amorphous cluster located at the left of the SWNT translates and attaches to another amorphous cluster located at the right of the SWNT,
which is the first stage of Re nucleation, the ‘cluster delivery process’. From 141 s to 183 s, the two clusters contact each other and then coalesce into one
amorphous cluster, which is the second stage, ‘coalescence’. The coalesced amorphous cluster ceaselessly changes its structure from 185 s to 282 s, in the
‘metastable amorphous state’ stage. At 308 s, a crystallite is formed and continues restructuring for a further 124 s, in the ‘ordered crystallite’ stage. Scale
bar, 1 nm. b, FFT patterns of the corresponding areas framed by white dotted boxes in a, analysing the periodic structural information of the Re cluster and
crystallite. Scale bar, 5 nm−1. c, Quantification of the degree of crystallization for the Re clusters at the different stages depicted in a. Cluster A and cluster B
are, respectively, the small Re clusters on the left and right sides of the image at the beginning of the experimental image series.

process gradually extends from the tiny crystallite to the whole Au                                         areas marked with red frames (Fig. 4a,b). By evaluating the inten-
cluster in the following 348 s, reaching a final crystallite size that is                                   sity of the spots corresponding to crystalline gold in the FFT pat-
~2 nm long and ~1 nm wide at 370 s. The Au crystallite maintains                                            terns, the degree of crystallinity can be estimated (Fig. 4c), showing
its orientation in the first 28 s of the nucleation process from 23 s                                       an abrupt increase of the atomic ordering in the Au cluster during
to 51 s and subsequently rotates or transforms, displaying different                                        heterogeneous nucleation that demonstrates that crystallization of
orientations from 51 s to 330 s. During the final stage of nucleation                                       Au has occurred from an amorphous precursor.
from 331 s to 370 s, the Au crystallite rotates or transforms again                                             The maximum transferred kinetic energy (ET_max) from the inci-
to the original (111) face, as can be seen in the FFT patterns of the                                       dent 80-keV electrons to the Au atoms is 0.96 eV (Supplementary

                                                                                                                                               Nature Chemistry | www.nature.com/naturechemistry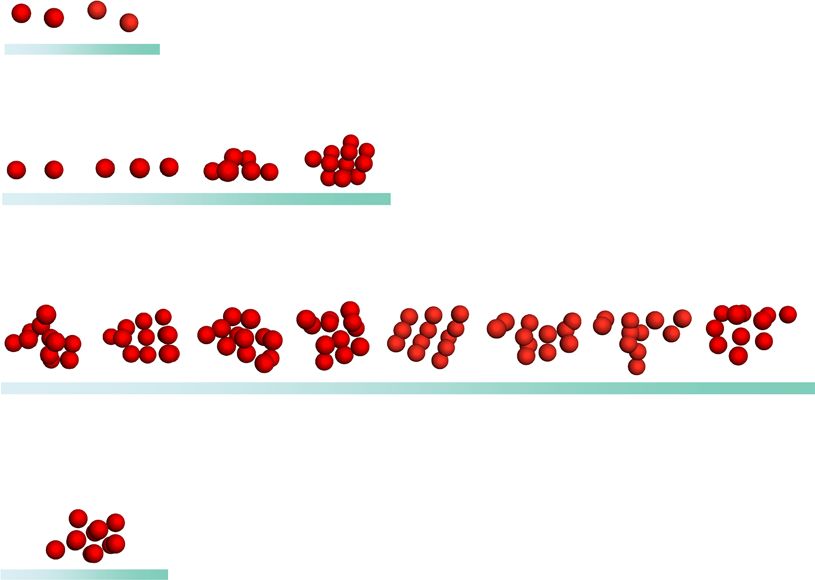
NAtuRe CHemIstRy                                                                                                                          Articles
Section 2, in which the corresponding differential cross-section as             sub-2 nm range and the number of atoms necessary for successful
well as the total cross-section of elastic scattering is included). Thus,       crystallization of both γ-Fe and Re lies between 10 and 20. The com-
when being irradiated by the electron beam, the total free energy of            bined use of a SWNT as the substrate for heterogeneous nucleation
the Au cluster increases, allowing it to overcome the energy barrier            and the channel for delivery of metal atoms and the electron beam
for transformation from amorphous to crystalline (Supplementary                 as a source of energy to simultaneously drive the process and act as
Fig. 5 and Supplementary Section 4). Previous work has demon-                   an imaging tool sheds light on the formation of a crystal nucleus
strated that energy transferred from the electron beam can influ-               at the sub-nanometre level—a challenging size range for any other
ence, melt and even vaporize the different metal nanocrystals28.                analytical method. These results are particularly important for Fe,
In the case of Au, the metastable amorphous cluster dynamically                 Au and Re in the carbon-rich environments present in a variety of
changes the atomic structure before finally crystallizing under the             industrial contexts, including Fischer–Tropsch catalysis, growth of
influence of the electron beam (Fig. 4d). Therefore, we can conclude            graphene by chemical vapour deposition or steel manufacturing.
that the size of the amorphous Au cluster is smaller than the critical
size for crystallization under sample preparation conditions but                Online content
larger than the critical size for crystallization under the TEM obser-          Any methods, additional references, Nature Research report-
vation conditions; that is, only under the influence of electron-beam           ing summaries, source data, extended data, supplementary infor-
irradiation has it enough energy to overcome the energy barrier to              mation, acknowledgements, peer review information; details of
crystallization. It should be noted that our experiments reveal a               author contributions and competing interests; and statements of
discernible Au crystallite with a radius of ~0.45 nm, which is much             data and code availability are available at https://doi.org/10.1038/
smaller than the crystal nucleus of 2 nm observed for this metal in             s41557-020-0538-9.
the aqueous solution of a liquid TEM cell11 due to the different con-
ditions for nucleation.                                                         Received: 1 April 2019; Accepted: 31 July 2020;
                                                                                Published: xx xx xxxx
Re crystal nuclei formed by coalescence. Increases in the number
of atoms in the cluster help to overcome the free-energy barrier and            References
                                                                                1. Myerson, A. S. & Trout, B. L. Nucleation from solution. Science 341,
promote the nucleation process. Therefore, the coalescence of clus-                 855–856 (2013).
ters, typically ignored by CNT, can be an important process for nucle-          2. Kashchiev, D. Thermodynamically consistent description of the work to form
ation as it enables a rapid increase of the cluster size (Supplementary             a nucleus of any size. J. Chem. Phys. 118, 1837–1851 (2003).
Section 4). We observe this effect by imaging the coalescence of two            3. Sleutel, M., Lutsko, J., Driessche, A. E. S. V. A. N., Durán-Olivencia, M. A. &
stable amorphous Re clusters into a larger amorphous metastable                     Maes, D. Observing classical nucleation theory at work by monitoring phase
                                                                                    transitions with molecular precision. Nat. Commun. 5, 5598 (2014).
cluster that subsequently crystallizes into a Re crystallite. At the            4. Habraken, W. J. E. M. et al. Ion-association complexes unite classical and
beginning of the TEM time series, two pre-existing sub-nanometre                    non-classical theories for the biomimetic nucleation of calcium phosphate.
amorphous Re clusters with ~10 atoms each are present in the host                   Nat. Commun. 4, 1507 (2013).
SWNT (Fig. 5). The left cluster is mobile, translating along the cav-           5. Dey, A. et al. The role of prenucleation clusters in surface-induced calcium
ity of the SWNT. The right cluster is fixed on the SWNT by metal–                   phosphate crystallization. Nat. Mater. 9, 1010–1014 (2010).
                                                                                6. Erdemir, D., Lee, A. Y. & Myerson, A. S. Nucleation of crystals from solution:
carbon bonding and partly covered by a carbon shell, which can be                   classical and two-step models. Acc. Chem. Res. 42, 621–629 (2009).
regarded as the substrate for heterogeneous nucleation. At 135 s, the           7. De, Y. et al. Crystallization by particle attachment in synthetic, biogenic and
left cluster translates and attaches to the carbon shell of the right               geologic environments. Science 349, aaa6760 (2015).
cluster. They come into contact briefly on two occasions via a single           8. Gebauer, D. & Cölfen, H. Prenucleation clusters and non-classical nucleation.
                                                                                    Nano Today 65, 564–584 (2011).
Re atom at 151 s and 177 s, and then completely coalesce in 3 s from
                                                                                9. Vekilov, P. G. The two-step mechanism of nucleation of crystals in solution.
183 s to 185 s. The resultant cluster contains ~20 atoms of Re; this                Nanoscale 2, 2346–2357 (2010).
appears to be above the critical number allowing the metal to over-             10. Lutsko, J. F. & Nicolis, G. Theoretical evidence for a dense fluid precursor to
come the free-energy barrier for crystallization (Supplementary                     crystallization. Phys. Rev. Lett. 6, 0461024 (2006).
Fig. 6 and Supplementary Section 4). The process of crystallization             11. Loh, N. D. et al. Multistep nucleation of nanocrystals in aqueous solution.
                                                                                    Nat. Chem. 9, 77–82 (2017).
starts with the formation of a metastable amorphous state at 185 s,             12. Nielsen, M. H., Aloni, S. & De Yoreo, J. J. In situ TEM imaging of CaCO3
followed by reorganization of Re atoms into a crystallite between                   nucleation reveals coexistence of direct and indirect pathways. Science 345,
185 and 308 s, which is slightly faster than the nucleation we observe              1158–1162 (2014).
in the case of γ-Fe. At 308 s, the Re crystallite with a recognizable           13. Gal, A. et al. Calcite crystal growth by a solid-state transformation of
crystalline structure is observed, followed by 124 s of restructur-                 stabilized amorphous calcium carbonate nanospheres in a hydrogel. Angew.
                                                                                    Chem. Int. Ed. 52, 4867–4870 (2013).
ing while maintaining crystallinity, which can be clearly observed              14. Navrotsky, A. Energetic clues to pathways to biomineralization: precursors,
as distinguishable lattice planes in the ‘ordered crystallite’ stage and            clusters and nanoparticles. Proc. Natl Acad. Sci. USA 101, 12096–12101 (2004).
quantified by FFT (Fig. 5b,c). The overall crystallite formation of Re          15. Baumgartner, J. et al. Nucleation and growth of magnetite from solution.
follows the same TSNM pathway as Au and Fe, with the only differ-                   Nat. Mater. 12, 310–314 (2013).
ence that the critical size (or number of atoms) required for crystal-          16. Galkin, O., Chen, K., Nagel, R. L., Hirsch, R. E. & Vekilov, P. G. Liquid–liquid
                                                                                    separation in solutions of normal and sickle cell hemoglobin. Proc. Natl Acad.
lization is achieved by coalescence of two amorphous Re clusters.                   Sci. USA 99, 8479–8483 (2002).
                                                                                17. Wolf, S. E., Leiterer, J., Kappl, M., Emmerling, F. & Tremel, W. Early
Conclusions                                                                         homogenous amorphous precursor stages of calcium carbonate and
We have imaged the heterogeneous nucleation of three different                      subsequent crystal growth in levitated droplets. J. Am. Chem. Soc. 130,
metals, γ-Fe, Au and Re, in a SWNT, with atomic resolution. All                     12342–12347 (2008).
                                                                                18. Gebauer, D., Völkel, A. & Cölfen, H. Stable prenucleation calcium carbonate
three nucleation processes observed under electron-beam irra-                       clusters. Science 322, 1819–1822 (2008).
diation and at room temperature are consistent with a TSNM                      19. Sellberg, J. A. et al. Ultrafast X-ray probing of water structure below the
framework, proving the validity of this theoretically postulated                    homogeneous ice nucleation temperature. Nature 510, 381–384 (2014).
mechanism14. We have directly observed the existence of a meta-                 20. Bera, M. K. & Antonio, M. R. Crystallization of Keggin heteropolyanions
stable amorphous precursor and demonstrated its necessity for the                   via a two-step process in aqueous solutions. J. Am. Chem. Soc. 138,
                                                                                    7282–7288 (2016).
crystallite nucleation processes. The size and number of atoms in               21. Yau, S.-T. & Vekilov, P. G. Direct observation of nucleus structure and
the amorphous precursor are critically important for the emergence                  nucleation pathways in apoferritin crystallization. J. Am. Chem. Soc. 123,
of a crystallite. In the case of all three metals the critical size is in the       1080–1089 (2001).

Nature Chemistry | www.nature.com/naturechemistry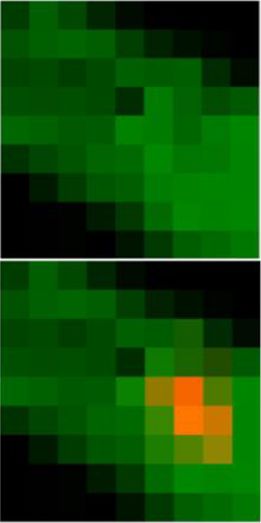
Articles                                                                                                                                NAtuRe CHemIstRy
22. Lupulescu, A. I. & Rimer, J. D. In situ imaging of silicalite-1 surface            29. Cao, K. et al. Comparison of atomic scale dynamics for the middle and late
    growth reveals the mechanism of crystallization. Science 344,                          transition metal nanocatalysts. Nat. Commun. 9, 3382 (2018).
    729–732 (2014).                                                                    30. Khlobystov, A. N. Carbon nanotubes: from nano test tube to nano-reactor.
23. Pusey, P. N. & van Megen, W. Phase behaviour of concentrated suspensions               ACS Nano 5, 9306–9312 (2011).
    of nearly hard colloidal spheres. Nature 320, 340–342 (1986).                      31. Zoberbier, T. et al. Interactions and reactions of transition metal clusters
24. Tsarfati, Y. et al. Crystallization of organic molecules: nonclassical mechanism       with the interior of single-walled carbon nanotubes imaged at the atomic
    revealed by direct imaging. ACS Cent. Sci. 4, 1031–1036 (2018).                        scale. J. Am. Chem. Soc. 134, 3073–3079 (2012).
25. Zheng, H. et al. Observation of single colloidal platinum nanocrystal growth       32. Somada, H., Hirahara, K., Akita, S. & Nakayama, Y. A molecular linear motor
    trajectories. Science 324, 1309–1312 (2009).                                           consisting of carbon nanotubes. Nano Lett. 9, 62–65 (2009).
26. Evans, J. E., Jungjohann, K. L., Browning, N. D. & Arslan, I. Controlled           33. Warner, J. H. et al. Capturing the motion of molecular nanomaterials
    growth of nanoparticles from solution with in situ liquid transmission                 encapsulated within carbon nanotubes with ultrahigh temporal resolution.
    electron microscopy. Nano Lett. 11, 2809–2813 (2011).                                  ACS Nano 3, 3037–3044 (2010).
27. Sosso, G. C. et al. Crystal nucleation in liquids: open questions and              34. Ran, K., Zuo, J. –M., Chen, Q. & Shi, Z. Electron beam stimulated molecular
    future challenges in molecular dynamics simulations. Chem. Rev. 116,                   motions. ACS Nano 5, 3367–3372 (2011).
    7078–7116 (2016).
28. Skowron, S. T. et al. Chemical reactions of molecules promoted and                 Publisher’s note Springer Nature remains neutral with regard to jurisdictional claims in
    simultaneously imaged by the electron beam in transmission electron                published maps and institutional affiliations.
    microscopy. Acc. Chem. Res. 50, 1797–1807 (2017).                                  © The Author(s), under exclusive licence to Springer Nature Limited 2020

                                                                                                                     Nature Chemistry | www.nature.com/naturechemistry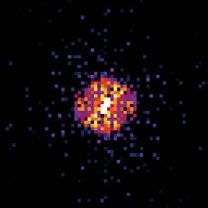
NAtuRe CHemIstRy                                                                                                                                    Articles
Methods                                                                               Acknowledgements
Materials. Arc-discharge SWNTs were annealed in air to open their termini. The        K.C. acknowledges financial support from the China Scholarship Council (CSC). J.B.
organometallic complexes Fe(C5H5)2, Au(CO)Cl and Re2(CO)10 were respectively          and U.K. acknowledge support from the ‘Graphene Flagship’ and DFG within the project
sealed under vacuum in a quartz ampoule and heated at a temperature slightly          KA 1295-33 as well as the DFG and the Ministry of Science, Research and the Arts (MWK)
above the vaporization point of ferrocene (300 °C), Au(CO)Cl (125 °C) and             of Baden-Wuerttemberg within the frame of the SALVE (Sub Angstrom Low-Voltage
Re2(CO)10 (150 °C) for three days to ensure complete penetration of the SWNT by       Electron microscopy) project. T.W.C. and A.N.K. acknowledge EPSRC for financial support
the ferrocene, Au(CO)Cl and Re2(CO)10 vapours. The samples were then rapidly          and the Nanoscale & Microscale Research Centre (nmRC) and the Centre for Sustainable
cooled to room temperature and the SWNTs washed with tetrahydrofuran (100 ml)         Chemistry, University of Nottingham, for access to instrumentation. E.B. acknowledges a
to remove any species from the outside of the SWNTs. The samples were then            Royal Society Wolfson Fellowship for financial support. Calculations were performed using
heated at 500 °C for 3 h under argon in a Pyrex tube to remove the ligands.           the High Performance Computing facility at the University of Nottingham. Z.L. and K.S.
                                                                                      acknowledge support from a JST Research Acceleration Program and the Japan Society for
TEM imaging and simulations. The materials were dispersed in methanol                 the Promotion of Science KAKENHI Grant JP 25107003.
and drop-cast onto lacey carbon-coated copper TEM grids. The time-series
AC-HRTEM images in Supplementary Videos 1–3 were obtained on an image-side            Author contributions
Cs-corrected FEI Titan 80-300 TEM operated at 80 kV at room temperature.              R.L.M. prepared the samples. C.T.S. carried out initial analysis of the samples. T.W.C.
The TEM specimen was heated in air at 150 °C for 5 min shortly before insertion       developed the methodology of filling nanotubes with metal precursors. Z.L., J.B. and K.S.
into the TEM column. The HAADF-STEM imaging and corresponding EELS                    performed the EELS mapping of the sample. K.C. and J.B. investigated of the sample by
spectrum in Fig. 1 were performed on a JEOL 2100F system with a cold                  AC-HRTEM and recorded the videos of nucleation. K.C., J.B., A.N.K. and U.K. discussed
field-emission gun and an aberration DELTA-corrector for the illumination system      the results and analysed the data. E.B. and S.T.S. carried out theoretical modelling.
operated at 60 kV. TEM image simulation was carried out using the multislice          K.C., J.B., A.N.K. and U.K. drafted the manuscript. All the authors have revised the
program QSTEM. Note that γ-Fe was observed to keep its crystalline structure          manuscript. U.K. and A.N.K. supervised the research.
after it formed during the experiment (197 s to 336 s), but the related images were
not acquired because we did not realize the importance of this observation until      Competing interests
the cutting process started.                                                          The authors declare no competing interests.

Data availability                                                                     Additional information
All data supporting the findings of this study are available in the                   Supplementary information is available for this paper at https://doi.org/10.1038/
manuscript or the Supplementary Information. The data for the electron                s41557-020-0538-9.
elastic scattering cross-section that support the findings of this study
are publicly available online at https://www.nist.gov/publications/                   Correspondence and requests for materials should be addressed to A.N.K. or U.K.
nist-electron-elastic-scattering-cross-section-database-version-40.                   Reprints and permissions information is available at www.nature.com/reprints.

Nature Chemistry | www.nature.com/naturechemistry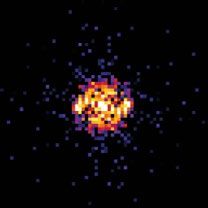
You can also read


