Healthy Foods Healthy Communities - Measuring the Social and Economic Impact of Food Co-ops - ICA Group
←
→
Page content transcription
If your browser does not render page correctly, please read the page content below

Healthy Foods
Healthy Communities

Measuring the Social and Economic
     Impact of Food Co-ops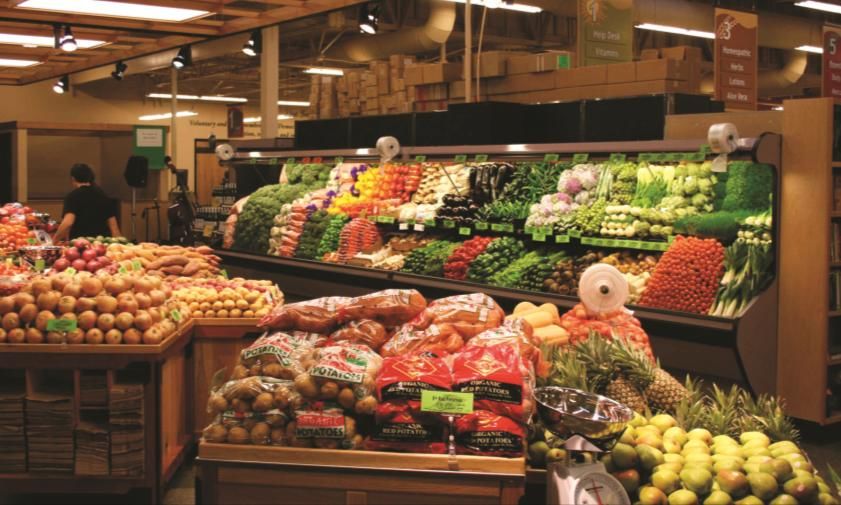
Table of Contents
Healthy Foods Healthy Communities: .............................................................................. 3
The Social and Economic Impact of Food Co-ops ......................................................... 3
Supporting Local Food Systems.......................................................................................... 5
   Defining Local ..................................................................................................................... 5
   Engaging the Local Food System ..................................................................................... 6
Creating Quality Jobs ........................................................................................................... 7
Local Economic Impact ........................................................................................................ 9
   The Multiplier Effect ........................................................................................................ 10
Environmental Stewardship ............................................................................................... 11
   Recycling ............................................................................................................................ 11
   Energy Conservation ...................................................................................................... 13
   Refrigerant Containment ............................................................................................... 14
   Carbon Footprint ............................................................................................................ 15
Promoting Healthy & Sustainable Foods ........................................................................ 16
About the Report ................................................................................................................ 17
   Data Sources .................................................................................................................... 17

Page 2                                                                                          www.strongertogether.coop
Healthy Foods Healthy Communities:
The Social and Economic Impact of Food Co-ops
The United Nations has declared 2012 the International Year of Cooperatives to highlight the
important role that cooperatives play in creating employment and strengthening communities
across the globe. In the United States, retail food cooperatives have a long and successful
history. From the pioneering of nutritional labeling, to the introduction of natural and organic
foods, food co-ops have played a leading role in bringing healthy innovations to the markets
they serve. Today, NCGA’s 128 co-ops continue this tradition with a strong emphasis on
supporting local food systems and careful attention to environmental sustainability.

NCGA’s member and associate food co-ops operate 165 stores, generate over $1.4 billion in
annual revenue and are owned by over 1.3 million consumer owners. In the spirit of the
International Year of Cooperatives and its theme that “Cooperative Enterprises Build a Better
World,” NCGA undertook a study to document the social and economic impact that our
affiliate cooperatives have on their local communities. The study was conducted by the ICA
Group, a not-for-profit consulting firm with expertise in cooperatives, economic development,
and business research.

Page 3                                                            www.strongertogether.coop

In evaluating the difference food cooperatives make in the communities they serve five broad
categories of impact were assessed:
Supporting Local Food Systems
Employment and Job Quality
Economic Impact
Environmental Stewardship
Promoting Healthy & Sustainable Foods
For each of these categories we were Food Co-op Facts
interested in understanding not only Average Members per Co-op 6,400
the impact of food cooperatives but Impact Per Co-op
also how these impacts differ from
Annual Sales $10 Million Sales From Members 60%
those of conventional grocers.
Co-op Conventional
Accordingly our research focused on
Store Size
both the cooperative and conventional
segments of the grocery industry in Total Square Feet 15,000 33,300
order to provide an appropriate Staff / $1 million sales 9.3 5.6
context for evaluating food co-op Sales / square foot $10.37 $ 8.55
performance. In addition to reviewing Compensation
industry data for both the Average Hourly Wage $14.31 $13.35
conventional and cooperative sectors,
% Eligible for Benefits 68% 56%
original survey work was undertaken
Local Impact
to explore a number of issues in more
detail. Purchases Locally Sourced 20% 6%
Local Suppliers 157 65
Owned by local residents, food
Economic Multiplier 1.60 1.36
cooperatives are naturally community
focused. We found that cooperatives Donations, % of Income (Cash) 13% 4%
provide greater access to healthy Healthy Foods
food, create more jobs per square Organic Groceries 48% 2%
foot, return less material to the waste Organic Produce 82% 12%
stream, are more energy efficient, and Environmental Impact
source a far greater proportion of
Energy Star Rating 82 50
product locally than their
Metric Tons CO2 / $1M Sales 51 74
conventionally structured
competitors. In addition, they engage Plastic Recycled 81% 29%
in extensive philanthropic activity and Cardboard Recycled 96% 91%
donate 13% of net profits to charity. Food Waste Composted 74% 36%
Page 4 www.strongertogether.coop
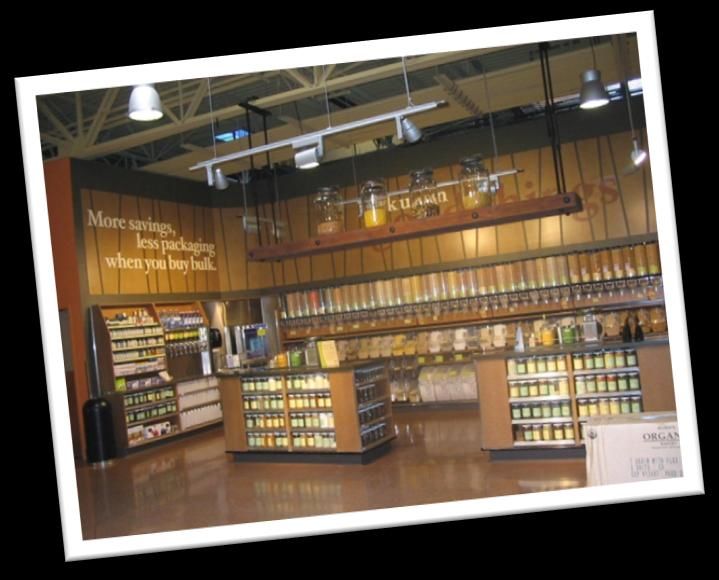
Supporting Local Food Systems
      Supporting local food systems is about more than just providing fresh, locally produced
      products to customers; strengthening the connections between consumers and producers is an
      investment in the community. It promotes the health of the local economy by ensuring that
      more money spent locally stays in the community, and it promotes food safety by shortening
      the supply chain between producers and consumers. Assessing the extent to which a grocery
      store supports its local food system first requires defining what is meant by “local.”

      Defining Local
      There is no single, commonly accepted definition of ‘local’ food. Oft cited definitions include
      food produced within the state or 100 miles of where it is sold. For consumers, issues beyond
      geography such as sustainable production techniques or fair farm labor practices may be
      considered as well.

      Our survey findings indicate that some grocery stores define “local” in terms of distance while
      others use political boundaries. While criteria vary from operator to operator, cooperatives
      generally appear to have a somewhat narrower definition of local than conventional grocers.
      Two thirds of NCGA co-ops define local as either within their state, within a multi-county
      region, or within 100 miles. In the conventional grocery sector, slightly less than half of
      operators use this same definition.

                                How Grocers Define Local Food
                                                                    200 miles,       300 Miles,
                                                                      17%               7%
   100 miles,                         200 miles,                                                400 Miles,
     32%                                16%                                                        3%
                                                          100 miles,
                                                             14%                                    County,
                                                                                                       3%
                                            300 Miles,                                              Multi-
                           Co-ops              5%                          Conventional            County,
                                            400 Miles,                                               3%
Multi-State                                    2%
Region, 14%                               Multi-
                                         County,           Multi-State
                                                                                                     Within
                Within                    11%               Region,
                                                                                                   State, 28%
              State, 20%                                     24%

                                                                                   Distance Boundary
                                                                                   Political Boundary

      Page 5                                                             www.strongertogether.coop
Engaging the Local Food System
One of the biggest obstacles small farmers face is engaging retailers that are willing to sell their
products. Small farms’ limited production volumes and less predictable supply, coupled with
many retailers’ centralized purchasing constraints, keep most large grocers from supporting the
local food system in a significant way. Cooperatives, on the other hand, are by their nature
locally-owned and purchasing decisions are made at the store level. Co-ops’ organizational
structure enables them to work closely with local growers and producers to establish
sustainable business relationships.

Food co-ops have been working to strengthen the linkage between local producers and
consumers for decades, and today, the typical co-op works with over 150 individual local
farmers and food producers. In contrast, our survey findings indicate that a conventional grocer
works with 65 local farmers and food producers. While the average conventional grocery
store sources slightly less than 6% of its food purchases from local sources, the average co-op
purchases almost 20% of the products it sells from local sources.

Comparing purchases by department, it is clear that while the conventional sector is able to
source a non-trivial share of its produce from local sources, co-ops source over 40% more and
also significantly outperform the conventional sector in every other department.

                 Local Purchasing Co-op vs. Conventional

         HABA      2%           8%
                                                                         Co-op
     Grocery               5%        11%                                 Conventional

  General
                    2%               11%
 Merchandise

          Bulk             5%               15%

      Produce                              14%    20%

         Dairy                  9%                                31%

          Deli        3%                                                35%

         Meats             5%                                                           45%

Page 6                                                              www.strongertogether.coop
Creating Quality Jobs
Retail food cooperatives are efficient and prolific job creators. The average food co-op creates
9.3 jobs for every million dollars in sales. A typical co-op earning $10 million a year in revenue
provides employment for over 90 workers. A conventional grocer creates only 5.8 jobs per
million dollars in sales as traditional grocers tend to have a greater reliance on automation and
more centralized management functions including human resources, accounting, and purchasing.

In total, NCGA’s 128 food co-ops employ over 12,000 workers nationally. For cashiers, who
comprise the largest proportion (34%) of all grocery store employees, the average hourly wage
at co-ops is 7% higher than at grocery stores nationally. Although hourly wages for co-op
workers in some of the occupations that make up the largest portion of the grocery workforce
tend to be slightly higher than in the conventional sector, overall, co-ops generally pay
comparable wages to their traditionally structured competitors.1

                   Average Hourly Wage for Major Occupations
            $10.94                            $11.09       $11.15
                          $10.59                                               $10.66
                                                                                             $10.00

            Food Prep Worker                     Stock Clerk                         Cashiers
                                          Co-ops         Conventional

In addition to hourly wages and salaries, most co-ops also pay bonuses and/or offer profit
sharing to employees. Considering all employees and including bonuses and profit sharing, co-
op employees earn an average of $14.31 per hour compared to $13.35 for their peers in the
conventional sector.

1
 Hourly wage data for the conventional sector is based on information from the Bureau of Labor Statistics (BLS).
Occupational wages can vary significantly from one labor market to another. The chart compares national
averages for both co-ops and conventional grocers as city, or even state, level data regarding occupational wages
by industry is not available from the BLS.

Page 7                                                                       www.strongertogether.coop
While wages are a common measure of job
quality, benefits and workplace culture are                          Percent of Staff Eligible for
important factors as well. Overall, 61% of                               Health Insurance
workers at co-ops have full time jobs and all
full time employees receive paid vacation.
At the typical co-op, individuals who work                                                                   56%56%
more than 30 hours per week are eligible
for health insurance. Nationally, 68% of all                         68%                            Conventional
co-op employees (full time and part time)
are eligible for health insurance.       On
average, co-op’s pay over 80% of eligible                                                                   45%45%
employee health care insurance premium
costs. In the conventional sector, fewer                  NCGA Co-ops
                                                                                                  Conventional
than half of workers are full time and only                                                        (under $10M in Sales)

56% of workers are eligible for health
insurance.

                                                                       Co-op                Conventional
          Percent Full Time                                             61%                     43%
          Percent Part Time                                             39%                     57%
          Percent Eligible for Health Insurance                         68%                     56%
          Hours Worked to Qualify for Insurance                          31                      30

Among the core cooperative principles are democracy, education and concern for community.
The workplace culture in cooperatives reflects these principles with a strong emphasis on
participatory management and benefits tailored to meet workers’ needs including paid time off
and employee discounts. Over a third of NCGA food co-ops practice open book management
and a quarter utilizes self-directed work teams. A series of employee satisfaction surveys has
confirmed that co-op employees highly value their workplace culture and benefits.

                           Co-op Employee Satisfaction
               I am proud to work for the co-op.                                                           4.3
             My supervisor encourages us to share
             our ideas, suggestions and concerns.                                                          4.1
               The staff discount benefit meets
                                                                                                           4.4
                 my needs/is valuable to me.
                The paid time off benefit meets
                 my needs/is valuable to me.                                                               4.1
                                                      Strongly              Partialy            Strongly
                                                                 Disagree               Agree
                                                      Disagree               Agree               Agree

                                                    Source: Carolee Colter & Helena O'Connor, CDS Consulting Co-op

Page 8                                                                                 www.strongertogether.coop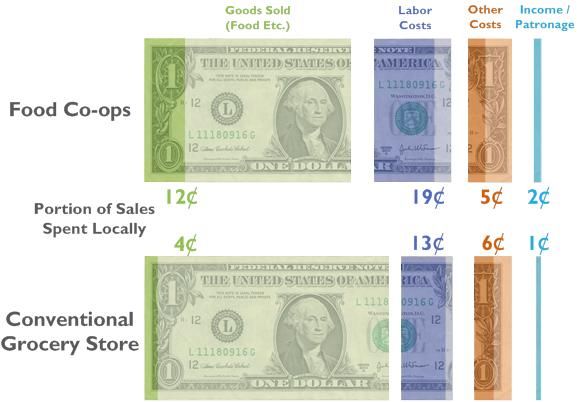
Local Economic Impact
Grocery stores play an important role in local economies, primarily as employers but also as
purchasers of goods and services. Because co-ops source a far greater proportion of their
products locally and spend more on labor, they have a bigger impact on the local economy than
a typical traditional grocer of comparable size would. A conventional grocer spends 72% of
each dollar of revenue to purchase inventory, but only 4% is spent on locally sourced products.
The average co-op spends 62% of every dollar in revenue on inventory, 12% of which is spent
on locally sourced products.

Co-ops also spend more on labor as a percentage of sales than conventional grocers. 19% of
co-op revenue is spent on local wages and benefits compared to just 13% in conventional
grocers. The proportion of other expenditures for supplies, maintenance and other services
spent locally is similar for co-ops and conventional grocers. In total, a co-op spends an
estimated 38% of revenues locally while a conventional grocer spends 24%.2

2
  The estimate of local spending assumes that co-ops and conventional grocers spend the same proportion of their
labor costs and “other” expenditures locally. It also assumes that 100% of store profit is spent locally. In practice,
profits at investor owned grocers may not be retained locally. Co-ops, because they are locally owned, retain
profits at the store level or pay them out as dividends to local owners.

Page 9                                                                           www.strongertogether.coop

The Multiplier Effect
The economic impact a firm has on its local economy is greater than the sum of its local
spending because a portion of money spent locally recirculates, creating what economists refer
to as a multiplier effect. For example, cooperatives purchase food from local farmers. Farmers
in turn use some of the money they receive from cooperatives to buy supplies from local
sources, hire local technicians to repair their equipment, and purchase goods and services from
local retailers. Similarly, store employees spend a share of the wages they receive locally on
various goods and services such as food, entertainment, and clothing.

Economic multipliers are useful for modeling how money circulates through an economy and to
broadly estimate the economic impact of business activities. The relative impact of a
cooperative compared to a conventional grocer can be estimated by applying appropriate
multipliers to their local spending. In terms of local economic impact, holding store size
constant, co-ops differ from conventional grocers primarily in the degree to which they source
inventory locally and the amount that they spend on wages and benefits. Taking           these
differences into account, and multiplying wages by a suitable wage multiplier for the grocery
industry and food purchases by a multiplier for spending on agricultural products, co-ops are
found to have a local economic multiplier of 1.60 compared to 1.36 for a conventional grocery
store. 3

A co-op with $10 million in
annual sales generates $16                     For every $1,000 a shopper
million of local economic impact.
A conventional grocery store of             spends at their local food co-op,
the same size, in the same
community, would have an                  $1,604 dollars in economic activity
annual economic impact of $13.6           is generated in their local economy
million – meaning that simply by
choosing to support and shop at              – $239 more than if they had
a food co-op, a community can
increase its total economic                   spent that same $1,000 at a
activity by over $2.4 million a             conventional grocer in the same
year.
                                                       community.

3
 The wage multiplier is from IMPLAN 2010 and the food purchase multiplier from the USDA’s RIMS II. A more
detailed explanation of this analysis is included in the Data Sources section.

Page 10                                                                 www.strongertogether.coop
Environmental Stewardship
For a consumer it can be difficult to evaluate the environmental performance of a grocery store
as some of the most important elements of conservancy – recycling, energy efficiency, and
containment of harmful refrigerant – may not be readily apparent. In a co-op, consumer owners
have the ability to influence their store’s environmental policy. As a result, co-ops have been
extremely proactive in their efforts to minimize the environmental impact of their operations
through education, product selection, and sustainable business practices. Many co-ops evaluate
management not only on financial results but on their environmental performance as well. Co-
ops’ strong focus on environmental stewardship is reflected in their impressive performance in
conserving natural resources.
Recycling
From the pallets and cardboard crates
wrapped in plastic film that product is Recycling Rates
shipped in, to the clippings and scraps
96%
generated by florist, deli, and bakery
91%
departments, grocery stores generate a
significant amount of waste. A hallmark of a 81%
retailer’s environmental stewardship is how
they deal with this waste; whether they 74%
send it to a landfill or incinerator, or take
the steps necessary to recycle it. In recent
years grocers and food manufacturers have
made significant progress in reducing
packaging, improving shipping efficiency, and
increasing recycling.
36%
Although data on recycling rates for 29%
supermarkets nationwide is not available, a
California government report that looked
at recycling rates among 30 grocery stores
provides useful context to consider co-op
recycling rates. Established markets for
waste cardboard and the relative ease with
which it can be handled lead to high rates Food Waste Plastics Cardboard
of cardboard recycling. The California study
Conventional Co-ops
found that supermarkets recycle 91% of the
Page 11 www.strongertogether.coopcardboard waste they generate, an impressive figure given that cardboard represents roughly
half of a typical grocery store’s waste. The typical NCGA food co-op recycles 96% of its
cardboard waste.
Plastic and food waste often have less economic value and can be more difficult to recycle,
resulting in lower rates of recycling. In the conventional sector, supermarkets compost 26% of
food waste and other organic material and recycle 29% of the plastic waste they generate. The
average NCGA food co-op recycles 81% of its plastic waste and composts 74% of its food
waste and other organic material.
Given the volume of material entering a typical food co-op and the environmental
consequences of sending waste to a landfill or incinerator, the positive impact of co-ops’
recycling efforts are dramatic. Of the average 59 tons of cardboard waste a co-op generates
annually, approximately 56 tons are recycled. NCGA food co-ops recycle an estimated 9,308
tons of cardboard each year. Recycling this waste, rather than sending it to a landfill or an
incinerator reduces greenhouse gas emissions by the equivalent of 27,738 metric tons of carbon
dioxide.
In addition to cardboard, NCGA food co-ops recycle an estimated 648 tons of plastic and
compost approximately 3,756 tons of organic material annually. Diverting this material from the
waste stream reduces greenhouse gas emissions by the equivalent of 2,297 metric tons of
carbon dioxide. On net, the higher proportion of recycling by food co-ops compared to
conventional supermarkets reduces carbon dioxide emissions by 1,277 more metric tons per
year.
The Reduction in CO2 Emissions from
Co-ops’ Recycling is Equivalent to:
CO2 emissions from the electricity
Cardboard
use of 3,459 homes for one year
Carbon sequestered by 20,744
Plastic
tree seedlings grown for 10 years
Compost CO2 emissions from burning
8.1 railcars’ worth of coal
Page 12 www.strongertogether.coopEnergy Conservation
Food co-ops have undertaken a wide range of projects designed to reduce their consumption
of natural resources. From efforts designed to conserve and recapture water like installing a
green roof or a rain catchment system to projects that generate or offset energy use such as
installing solar panels and geothermal heat, co-ops have been in the vanguard of resource
conservation. These investments in conservation have helped co-ops outperform conventional
grocers in respect to energy efficiency.
The US Environmental Protection Agency (EPA) has established an Energy Star rating for
grocery stores that allows operators to assess their building’s energy efficiency relative to
similar grocers nationwide. The EPA rates stores on a scale of 1 to 100 taking into account
location, size, refrigeration capacity, and other factors that contribute to energy consumption.
A rating of 50 indicates average energy performance, while a rating of 75 or higher is an
indication of “top performance” and qualifies a store for Energy Star certification. Using the
Energy Star rating system it is possible to compare a food co-op’s energy efficiency to their
conventionally structured peers.
50 Average Score for Industry
Co-op Average Score
Industry Avg. (Energy Star Rated)
Co-op Avg. (Energy Star Rated)
82
88
93
Least Efficient Most Efficient
By entering energy consumption data for NCGA food co-ops into the EPA’s “Portfolio
Manager” software, an Energy Star rating was estimated for each co-op. The 42 co-ops scored
an average of 82 compared to an overall grocery industry average of 50. Fully 71% of the
NCGA co-ops have ratings that would qualify for Energy Star certification. Co-ops qualifying for
Energy Star certification had an average score of 93 compared to an average score of 88 for the
roughly 1,900 Energy Star certified conventional supermarkets.
Page 13 www.strongertogether.coopRefrigerant Containment
Refrigeration can account for as much as a third of a typical grocery store’s electricity usage
and the refrigerants used in refrigeration systems have a greenhouse warming potential many
thousand times that of carbon dioxide. Therefore, reducing refrigerant leaks and carefully
maintaining refrigeration systems can help significantly reduce a grocery store’s carbon
footprint.
NCGA food co-ops report that in 2011 they had an average refrigerant leak rate of 8%,
significantly less than the EPA estimated average of 25% for the industry overall. Across the
country, co-ops have made efforts to reduce the environmental impact of their refrigeration
systems. Eighty-one percent (81%) of co-ops have installed night curtains on their open
refrigerators and 62% have installed LED lighting that emits less heat in the chill case. Fifty-two
percent (52%) have taken steps to improve the efficiency of their refrigeration system, including
14% that have installed advanced refrigeration systems that are more efficient and less prone to
leak. These efforts have enabled co-ops to achieve a refrigerant leak rate that is lower even
than the 13% average leak rate of the industry leaders that collect and report data to the EPA’s
Green Chill Partnership.
Impact of Refrigerant Leak Rate on
Greenhouse Gas Emissions
116
Metric Tons
370
Metric Tons
Co-op Average: Industry Average:
8% Leak Rate 25% Leak Rate
Reducing refrigerant leak rates has tremendous environmental benefit. For a system that holds
1,000 pounds of the refrigerant R-404A, a leak rate of 25% would release 250 pounds of gas
into the atmosphere each year; the equivalent of 370 metric tons of carbon dioxide. For a co-
op with the same 1,000 pound system and a leak rate of 8%, the 100 pounds of R-404A leaked
is the equivalent of releasing 116 metric tons of carbon dioxide. With 165 co-op stores across
the country, the average reduction of 254 metric tons per store yields a total carbon reduction
of roughly 42,000 metric tons; the equivalent of the amount of carbon sequestered annually by
8,927 acres of pine forest.
Page 14 www.strongertogether.coopCarbon Footprint
Heating, electricity, transportation Product Transport, 27%
and refrigerant leakage all Heating, 9%
contribute to grocery store
greenhouse gas generation. As Refrigerant
Leakage, 24%
more companies have begun
disclosing carbon footprint
information and making public Source of Co-op
C02-e Emissions
commitments to reduce their
greenhouse gas emissions it is
becoming more practical to Electricity, 40%
compare environmental
performance in terms of carbon
emissions. For grocery stores, the most obvious measures to compare are total carbon
emissions per square foot, which addresses the energy used to heat and cool spaces of various
sizes; and emissions per dollar of sales, which controls for the impact of sales volume on energy
consumption.
A retailer’s carbon footprint relates not only to its environmental practices and scale of
operations but also to the specific sector within which it operates. The Carbon Disclosure
Project, a not for profit which collects corporate carbons emissions data includes information
on a handful of supermarkets with which co-op performance can be compared. The average
co-op produces 39.4 metric tons of carbon dioxide equivalents for every 1,000 square feet of
space. Grocery stores that furnish data to the Carbon Disclosure Project report emissions in
the range of 33 to 69 metric tons per 1,000 square feet with an average of 39. While co-op
emissions per square foot are comparable to conventional stores, co-ops sell more per square
foot than conventional grocers and thus their emissions measured on a ton per dollar of sales
basis are lower. Co-ops generate 50.6 metric tons of carbon dioxide equivalents per million
dollars of sales compared to 73.7 metric tons for grocery stores that furnish data to the
Carbon Disclosure Project.
Based on estimates from a carbon footprint calculator provided by the US Environmental
Protection Agency, the average co-op generates the equivalent of 565 metric tons of carbon
dioxide per year. Two thirds of this total is attributable to electricity consumption and the fuel
used to transport products to the store.
NCGA food co-ops are continuing to work to reduce their carbon footprint. Seven percent
(7%) of co-ops are now LEED certified and 29% of co-ops have installed solar panels compared
to just 7% of conventional stores. Additionally, 27% of co-ops purchase green energy from their
power company and 10% of total electricity consumption is offset through the purchase of
renewable energy credits.
Page 15 www.strongertogether.coopPromoting Healthy & Sustainable Foods Each year in the United States, more than one billion pounds of pesticides are released into the environment. Organic farming helps protect the environment and consumers by eschewing the use of harmful pesticides. NCGA food co-ops generate roughly $183 million dollars in organic produce sales each year and play an important role in the promotion of organic farming. Co- ops’ extensive offerings of organic foods are a key part of what distinguishes them from conventional supermarkets. While nationally 12% of all fruit and vegetable sales are organic, in the typical food co-op organics make up 82% of produce sales. Co-ops’ commitment to healthy food goes beyond the produce Organic Products Sold Per Day in the aisle. Eighty-nine percent (89%) Grocery, Frozen, Refrigerated Departments of the meat sold at co-ops is sustainably raised, and 75% of co- = 50 Products ops have product policies that restrict certain ingredients, such as genetically modified products or high fructose corn syrup. According to data supplied by SPINS, a firm which tracks sales of natural products at more than 32,000 grocery stores, organic products account for 1.5% of sales Co-op Conventional in the grocery, refrigerated, and Average Average frozen food departments of conventional supermarkets. Among NCGA’s food co-ops, organics make up 48% of sales in these same departments. On average, the typical food co-op sells 1,273 organic products each day, exclusive of fresh meat, produce and bulk products. Co-ops recognize that education is an important part of empowering consumers to make informed shopping choices. Eighty-three percent (83%) of co-ops offer classes on healthy eating and nutrition and 10% of co-ops have nutritionists available to consult with customers. Consumer education also takes place through store signage highlighting product origins and other characteristics. From shelf hangers indicating a product is local or produced by a co-op to labels showing which products are gluten free, food co-ops give shoppers the information they need to make the choices that are best for their families. Twenty-one percent (21%) of products sold by co-ops carry a gluten free label, and 3% carry the Whole Grain Council Certified stamp. Within the grocery, refrigerated, and frozen departments, 9% of co-op sales are Non-GMO Project Verified. In conventional grocery stores, only 0.4% of sales in these same departments are Non-GMO Project verified. Page 16 www.strongertogether.coop
About the Report
National Cooperative Grocers Association (NCGA) is a business services cooperative
for retail food co-ops located throughout the United States. NCGA helps unify natural food co-
ops in order to optimize operational and marketing resources, strengthen purchasing power,
and ultimately offer more value to natural food co-op owners and shoppers everywhere.
www.ncga.coop

The ICA Group is a national not-for-profit consultancy based in Brookline, Massachusetts
focused on the development and support of initiatives that build economic security. ICA’s
programmatic focus areas include; cooperative development, social purpose venture planning,
and research and evaluation services for not-for-profits. www.ica-group.org, (617) 232-8765

Data Sources
Numerous data sources were consulted to develop this report including industry and
government data; food cooperative financial data collected by CoopMetrics for NCGA; and
previous survey data collected by NCGA. To augment this information, the ICA Group
developed two surveys, one targeted to NCGA food co-ops and the other to the conventional
grocery industry.

The bulk of the co-op results are derived from a survey that was distributed via email to 124
NCGA food co-ops in February 2012. The survey contained 70 questions relating to the five
domains of interest. A total of 78 co-ops completed the survey, a 63% response rate. The
primary sources used to inform the research are discussed below organized by issue area.

Corporate Sustainability Reports were sought from the largest 75 supermarket chains in the
country. Sustainability reports were reviewed for the 17 supermarket companies that make
them publicly available including: Whole Foods, Safeway, Kroger, Costco, Walmart, Supervalu,
Loblaw Companies, Publix Supermarkets, Ahold USA, Delhaize America, Sobeys, Spartan
Stores, Brookshire Grocery Co., and Metro.

Local Food Systems: Data on co-op local sourcing was collected using the survey
instrument. Two previous academic studies that examined the role food co-ops play in the
local food economy reported findings consistent with the survey results.

There is almost no publicly available research on local sourcing in the conventional grocery
sector. To develop a benchmark with which to compare food co-ops’ local purchasing an
electronic survey was sent to 344 purchasing professionals in the conventional grocery sector.
This survey had a response rate of 8.4%, representing approximately 969 stores or 2.7% of the
total grocery stores in the US.

Page 17                                                         www.strongertogether.coop
Employment and Job Quality: Compensation and benefit data for the food co-ops was
retrieved from CoCoFiSt, a database developed by CoopMetrics for NCGA that contains
detailed financial data on nearly all NCGA food co-ops. This data was supplemented by survey
data on occupational wages, and employee benefits.

Wage and benefit data for the conventional sector came from the Bureau of Labor Statistics,
the US Census Bureau, the Food Marketing Institute, the National Grocers Association, and
Progressive Grocer magazine.

Economic Impact: The economic impact multiplier presented in this report was calculated
using the LM3 model, a tool developed by the New Economic Foundation, a UK based
independent think-and-do tank. A grocery industry wage multiplier from IMPLAN 2010 and an
agricultural purchase multiplier derived from the RIMS II data set were used as inputs in the
model. IMPLAN is an economic input-output modeling system originally developed by the US
Forest Service that is now maintained by a private company. It is widely used to estimate the
economic impact of changes in business activity. RIMS II, developed by the US Bureau of
Economic Affairs, is another commonly used input-output model. RIMS II and IMPLAN
multipliers use economic data from various government sources to model the interrelationships
among economic activity in a region.

The goal in calculating the economic multiplier was not to determine the total economic impact
of an individual co-op in a particular community, but rather the relative difference in impact
between an average co-op and an average conventional grocery store of the same size. Applying
the same wage and purchasing multipliers to the activities of both types of store revealed the
economic impact of their differences in purchasing behavior and cost structure. Cost structure
data for the co-op sector was derived from CoCoFiSt. The Food Marketing Institute’s “The
Food Industry Speaks 2011,” provided the relevant data for the conventional sector.

Environmental Stewardship: Data used to calculate the environmental impact of co-ops
came primarily from the ICA survey instrument supplemented by follow up interviews. Data for
the conventional sector came from government sources, corporate social responsibility
reports, data submitted to the Carbon Disclosure Project, and academic and industry studies.

Conventional grocery recycling rates were derived from a California report on recycling in
urban supermarkets. This data was crosschecked against data from corporate social
responsibility reports. Given that California has an overall recycling rate higher than the
national average, the recycling rates assumed for conventional supermarkets may be greater
than actual national averages. Greenhouse gas emissions and their equivalencies from co-op
recycling efforts were calculated using the EPA’s Waste Reduction Model (WARM) and Carbon
Equivalency Calculators.

Page 18                                                         www.strongertogether.coop
The initial Energy Star ratings presented in this report were determined by entering co-op
energy consumption data into the EPA’s “Portfolio Manager” software. Comparative data came
from information published on the EPA’s website.

Refrigeration leakage data was reported by co-ops as part of the ICA survey. Comparative
benchmark data was sourced from reports published by the EPA’s Green Chill Partnership.

The carbon footprint presented in this report was calculated using the EPA’s Simplified GHG
Emissions Calculator (SGEC) which is based on a corporate greenhouse gas inventory protocol
developed by the World Resources Institute (WRI) and the World Business Council for
Sustainable Development (WBCSD). Data on the conventional grocery stores came from
reports published on the Carbon Disclosure Project website.

Promoting Healthy & Sustainable Foods: Data on healthy and sustainable foods came
from the tracking firm SPINS. SPINS tracks every product with a UPC symbol that is scanned
through an NCGA co-op’s point of sale system. These items are crosschecked against the
SPINS product library of over 190,000 individual products with verified natural attributes
including organic content, gluten free, and Non-GMO Project Certified. Through a partnership
with Nielson Scantrack, SPINS is also able to provide information on products sold in the
conventional grocery sector. Although the majority of packaged grocery merchandise and
products in the frozen or refrigerated section are UPC coded, meat, produce, and bulk items
are generally not. Accordingly, these latter items are not included in the SPINS data.

References
Local Food Systems & Employment and Job Quality
2011 Independent Grocers Financial Survey, National Grocers Association
       http://www.nationalgrocers.org/resource-center/nga-research/independent-grocers-financial-survey
Annual Financial Review 2011, Food Marketing Institute.
       http://www.fmi.org/forms/store/ProductFormPublic/search?action=1&Product_productNumber=2335
Co-op Employee Satisfaction Surveys. Carolee Colter & Helena O'Connor, CDS Consulting Co-op
       http://www.cdsconsulting.coop/consultants/carolee-colter
       http://www.cdsconsulting.coop/consultants/helena-oconnor
Chronicle of Philanthropy, Charitable Giving at Major Corporations.
       http://philanthropy.com/section/Corporate-Giving/449/
Crunching the Numbers, Progressive Grocer‘s 78th Annual Report of the Grocery Industry,
        Progressivegrocer.com, April 2011
The Distribution of Local Food through Consumer Cooperatives in the Northeast. Michahelles, M.
        Thesis Presentation. University of Vermont. May 2008.
The Effectiveness of Local Food Marketing Strategies of Food Cooperatives, Katchova, A., Woods, T.
        University of Kentucky. Unpublished Paper.
The Food Retailing Industry Speaks 2011, Food Marketing Institute.
       http://www.fmi.org/forms/store/ProductFormPublic/search?action=1&Product_productNumber=2333
The Grocery Stores Wage Distribution: A Semi-Parametric Analysis of the Role of Retailing and Labor

Page 19                                                                    www.strongertogether.coop
Market Institutions, Budd, J., McCall, B. Industrial and Labor Relations Review, Vol. 54. No. 2A.
Local Food as Economic Development. Meter, K., Cross Roads Resource Center, 2008
http://www.crcworks.org/lfced.pdf
Supermarket Sales by Department – Percent of Total Supermarket Sales, Food Marketing Institute:
http://www.fmi.org/docs/facts_figs/grocerydept.pdf
U.S. Grocery Shopper Trends 2011, Food Marketing Institute.
http://www.fmi.org/forms/store/ProductFormPublic/search?action=1&Product_productNumber=2331
The U.S. Food Marketing System: Recent Developments, 1997-2006. Martinez, S. (2007, May). United
States Department of Agriculture, Economic Research Service:
http://www.ers.usda.gov/publications/err42/err42.pdf.
US Bureau of Labor Statistics, Labor Force Statistics from the Current Population Survey
Economic Impact
Economic Impacts of Connecticut’s Agricultural Industry, Rigoberto A. Lopez et al., University of
Connecticut Department of Agricultural and Resource Economics, 2010
The Grocery Industry in Ohio Impact Study, John Dunham and Associates, March 2011
http://www.ohiogrocers.org/assets/pdf/About_Us/ohio_grocery_retail_impact_study_results_and_methodology_3_23_11.pdf
The Money Trail, Measuring your impact on the local economy using LM3. Justin Sacks, New Economic
Foundation. December 2002. http://www.neweconomics.org/publications/money-trail
Local Works! Examining The Impact Of Local Business On The West Michigan Economy. Civic
Economics, September 2008.
Research on the Economic Impact of Cooperatives, Deller, S., Hoyt, A., Hueth, B, Sundaram-Stukel, R.
University of Wisconsin Center for Cooperatives Revised June 19, 2009.
http://reic.uwcc.wisc.edu/groceries/
Vermont Food Industry Economic Impact Study, John Dunham and Associates, 2011
http://www.vtgrocers.org/files/files/Vermont%20Summary%20Results%20and%20Methodology%2012%207%2011.pdf
Why Local Linkages Matter: Findings from the Local Food Economy Study. Viki Sonntag, Sustainable
Seattle. April 2008
Environmental Stewardship
Environmental Implications of the Foodservice and Food Retail Industries. Davies, T., Koninsky, D.;
Resources for the Future Working Paper 00-11. March 2000.
Demonstration of Water Conservation Opportunities in Urban supermarkets. Aquacraft, Inc. Water
Engineering and Management, Submitted to: Metropolitan Water District of Southern California
California Department of Water Resources/U.S. Bureau of Reclamation CalFed Bay-Delta
Program. July 21, 2004.
The GreenChill Partnership [PowerPoint Presentation]. Witman, Keilly, USA Environmental Protection
Agency’s Stratospheric Protection Division.
http://www.epa.gov/ozone/partnerships/greenchill/downloads/RSES_GreenChill%20Presentation.pdf
GreenChill Credited for Refrigerant Leak Reduction. Garry, Michael. Supermarket News, April 12,
2012. http://m.supermarketnews.com/sustainability/greenchill-credited-refrigerant-leak-reduction
Managing Energy Costs in Grocery Stores, Commercial Energy Advisor,. E Source Companies, LLC. 2006.
http://www.esource.com/BEA/demo/PDF/CEA_groceries.pdf
Sustainability and Recycling in the Food Industry 2007, Food Marketing Institute.
http://www.fmi.org/forms/store/ProductFormPublic/search?action=1&Product_productNumber=2210
Page 20 www.strongertogether.coopTargeted Statewide Waste Characterization Study: Waste Disposal and Diversion Findings for Selected
Industry. Cascadia Consulting Group, California Integrated Waste Management Board (CIWMB).
June 2006. Available at: http://www.calrecycle.ca.gov/Publications/Disposal/34106006.pdf
US Environmental Protection Agency, Simplified GHG Emissions Calculator (SGEC)
www.epa.gov/climateleaders/documents/sgec_tool_v3_1.xls
US Environmental Protection Agency, Simplified GHG Emissions Calculator (SGEC) design principles
http://www.epa.gov/climateleadership/documents/resources/design_princ_intro.pdf
US Environmental Protection Agency, Waste Reduction Model (WARM)
http://www.epa.gov/climatechange/wycd/waste/calculators/Warm_home.html
Promoting Healthy & Sustainable Foods
U.S. Organic Industry Overview 2011, Organic Trade Association
http://www.ota.com/pics/documents/2011OrganicIndustrySurvey.pdf
Page 21 www.strongertogether.coopYou can also read