Re-evaluation of biotin-streptavidin conjugation in Förster resonance energy transfer applications
←
→
Page content transcription
If your browser does not render page correctly, please read the page content below
Re-evaluation of biotin-streptavidin
                 conjugation in Förster resonance
                 energy transfer applications

                 Bahar Saremi
                 Ming-Yuan Wei
                 Yuan Liu
                 Bingbing Cheng
                 Baohong Yuan

Downloaded From: https://www.spiedigitallibrary.org/journals/Journal-of-Biomedical-Optics on 31 Jan 2021
Terms of Use: https://www.spiedigitallibrary.org/terms-of-use
Journal of Biomedical Optics 19(8), 085008 (August 2014)

                Re-evaluation of biotin-streptavidin conjugation in
                Förster resonance energy transfer applications
                Bahar Saremi,a,b,† Ming-Yuan Wei,a,b,† Yuan Liu,a,b Bingbing Cheng,a,b and Baohong Yuana,b,*
                a
                 University of Texas at Arlington, Department of Bioengineering, Ultrasound and Optical Imaging Laboratory, Arlington, 500 UTA Boulevard,
                Texas 76010, United States
                b
                 University of Texas at Arlington and University of Texas Southwestern Medical Center at Dallas, Joint Biomedical Engineering Program,
                Texas 75390, United States

                                 Abstract. Bioaffinity conjugation between streptavidin (SA) and biotin has been widely used to link donors and
                                 acceptors for investigating the distance-dependent Förster resonance energy transfer (FRET). When studying a
                                 commonly used FRET system of (QD-SA)-(biotin-DNA-dye) [donor: quantum dot (QD); acceptor: small organic
                                 fluorescent dye; and linker: deoxyribose nucleic acid (DNA) molecule via SA-biotin conjugation], however, a
                                 contradictory finding was recently reported in the literature. It was found that the FRET lost its dependence
                                 on the number of DNA base pairs when using a phosphate-buffered saline (PBS) solution. We found that
                                 the conflicted results were caused by the ionic strength of the adopted buffer solutions. Our results suggest
                                 that the dependent FRET on the number of DNA bases is favorable in a low-ionic-strength buffer, whereas
                                 in relatively high-ionic-strength buffers, the FRET loses the DNA length dependence. We propose that the
                                 independence is mainly caused by the conformational change of DNA molecules from a stretched to a coiled
                                 mode when the cations in the high-ionic-strength buffer neutralize the negatively charged backbone of DNA
                                 molecules, thereby bringing the acceptors close to the donors. © 2014 Society of Photo-Optical Instrumentation Engineers
                                 (SPIE) [DOI: 10.1117/1.JBO.19.8.085008]

                                 Keywords: Förster resonance energy transfer; quantum dots; fluorophores; streptavidin and biotin conjugation; deoxyribose nucleic
                                 acid; fluorescence lifetime.
                                 Paper 140203RR received Mar. 30, 2014; revised manuscript received Jul. 29, 2014; accepted for publication Aug. 6, 2014; published
                                 online Aug. 27, 2014.

                1       Introduction                                                                   Studies have observed distance-dependent FRET between
                Förster resonance energy transfer (FRET) is an optical phe-                        the QD and the dye when changing the number of the DNA
                nomenon in which an excited donor molecule can transfer its                        bases (or base pairs),13 and have also utilized FRET data for
                energy to an acceptor molecule to emit fluorescence photons                        single-molecule sensing12 and quantitative analysis of inter-
                at the acceptor emission wavelengths. The transfer efficiency                      or intramolecular distance.13–15 These results led to an assumed
                has been found to be highly dependent upon the donor-acceptor                      architecture for the (QD-SA)-(biotin-DNA-dye) system, which
                distance. Therefore, FRET has been commonly used as a tool                         stated that “the dye acceptors on the DNA will be located at
                for investigating inter- or intramolecular distances at a level of                 a uniform set of centrosymmetric distances from the central
                nanometers.1,2                                                                     QD.”4,16 Based on this model, the FRET should depend on
                    To efficiently observe FRET, donors and acceptors are usu-                     the DNA length or base number (or base pairs). However,
                ally linked via various conjugation structures such as amine-                      a recent study found a contradictory result. In this study,
                carboxyl reaction, thiol bonding, and bioaffinity binding.3–5                      the FRET was found to be independent of the number of
                Among numerous bioconjugation structures, streptavidin (SA)-                       DNA base pairs if the (QD-SA)-(biotin-DNA-dye) system
                biotin binding has been widely used because of its high affinity                   was adopted in phosphate-buffered saline (PBS) solution.4,16
                and specificity, facile nature, and commercial availability.6–8                    Therefore, a conclusion was drawn in the study that the
                For example, dye-labeled biotinylated deoxyribose nucleic                          (QD-SA)-(biotin-DNA-dye) system might have a very different
                acid (DNA) molecules (biotin-DNA-dye) have been attached                           architecture compared to the initially assumed one. A new archi-
                to a streptavidin-coated quantum dot (QD-SA) for FRET-                             tecture model for the (QD-SA)-(biotin-DNA-dye) system was
                based biomedical imaging9 and sensing.8,10–12 In the structure                     proposed based on the fact that each SA has four biotin binding
                                                                                                   sites. This new structure proposed that some biotinylated DNA
                of (QD-SA)-(biotin-DNA-dye), QD and dye serve as a donor
                                                                                                   molecules might radially extend outward from the SA-coated
                and an acceptor, respectively. Two major advantages of this
                                                                                                   QD surface and others could tangentially attach onto the SA-
                system are the large quantum efficiency of the QD and the
                                                                                                   coated QD surface (see Fig. 5 in Ref. 16). The latter is the reason
                capability of controlling the donor-acceptor distance by varying
                                                                                                   why some dyes might always be in close proximity to the QD
                the number of bases (single-stranded) or base pairs (double-
                                                                                                   surface so that the FRET becomes independent of the DNA
                stranded) of the DNA molecule (and, therefore, the length of
                                                                                                   base pairs. Thus, the authors questioned the use of an SA-biotin
                DNA).
                                                                                                   conjugation for linking a QD and DNAs for distance-dependent
                                                                                                   FRET applications.4,16
                *Address all correspondence to: Baohong Yuan, E-mail: baohong@uta.edu
                †
                    These authors contributed equally to this work.                                0091-3286/2014/$25.00 © 2014 SPIE

                Journal of Biomedical Optics                                               085008-1                                          August 2014   •   Vol. 19(8)

Downloaded From: https://www.spiedigitallibrary.org/journals/Journal-of-Biomedical-Optics on 31 Jan 2021
Terms of Use: https://www.spiedigitallibrary.org/terms-of-use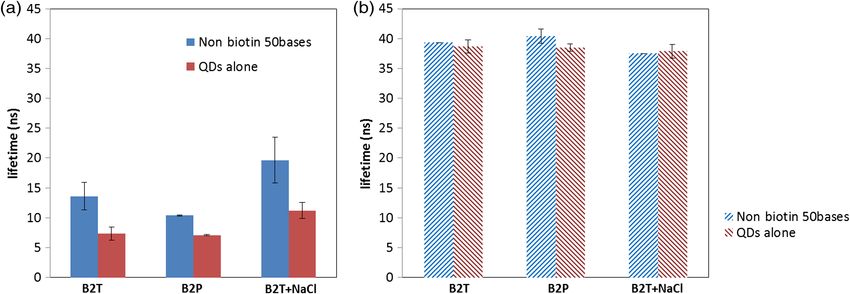
Saremi et al.: Re-evaluation of biotin–streptavidin conjugation in Förster resonance energy transfer applications

                    To further understand the (QD-SA)-(biotin-DNA-dye) sys-                        experiments. A TE buffer [10 mM Tris and 1 mM ethylenedia-
                tem, we investigated it from a different perspective (i.e., ionic                  minetetraacetic acid (EDTA) pH 7.5] was purchased from USB
                strength). Our data showed that the contradictory results in pre-                  Corporation (Cleveland, Ohio). Two percent BSA (weight-vol-
                vious publications might be caused by the chemical-physical                        ume ratio) were added into PBS, Tris, and TE buffers when used
                microenvironment of the DNA molecules as a result of the                           for conjugation.
                adoption of different buffer solutions (such as borate, Tris,
                PBS, and TE buffers). Therefore, we reevaluated the SA-biotin
                                                                                                   2.2     Methods
                conjugation in FRET applications under varying ionic strength
                conditions. The finding in the current work reveals that the con-                  2.2.1   Sample preparation
                troversial results between length-dependent and -independent
                FRET are mainly attributed to the ionic strength of the adopted                    Samples in the present work were prepared via three steps: con-
                buffer solutions. Accordingly, we conclude that the system of                      jugation between QD-SA and biotin-DNA-dye, separation of free
                (QD-SA)-(biotin-DNA-dye) is appropriate for investigating                          biotin-DNA-dye from the conjugates, and dilution of the conju-
                distance-dependent FRET if buffer solutions are appropriately                      gates. Note that the buffer for conjugation was denoted as the “C-
                selected.                                                                          buffer” and the buffer used to dilute the sample (by 30-fold in
                                                                                                   volume) prior to measurement was denoted as the “D-buffer.”
                2     Materials and Methods                                                            A general procedure for sample preparation is described as
                                                                                                   follows. In 100 μL of C-buffer, 1 pmol of QD655-SA was mixed
                2.1     Materials                                                                  with 10 pmol of BOAF. The sample was placed on the shaker
                                                                                                   (ThermoScientific, Asheville, North Carolina) at ∼6000 rpm for
                2.1.1    SA-coated QDs                                                             45 min at room temperature. After conjugation, the sample was
                The SA-coated QDs (QD655-SA, peak emission: 655 nm) were                           filtered using a 100 K molecular weight cut-off centrifugal filter
                purchased from Life Technologies (Grand Island, New York).                         (DNA FastFlow Device, purchased from EMD Millipore Ltd.,
                The QD655-SA are expected to be 15 to 20 nm in size, with                          Billerica, Massachusetts) to remove the unbound DNA mole-
                each functionalized with 5 to 10 SA molecules according to                         cules at 4000g for 20 min. The filtered sample was collected
                the production information provided by the vendor.17                               at 7000g for 3 min according to the manual. The resulting sam-
                                                                                                   ple was diluted to 3 mL with the D-buffer.
                2.1.2    Biotinylated oligonucleotides labeled with
                         Alexa Fluor 750                                                           2.2.2   Fluorescence lifetime measurement

                In total, six strands of 3′-biotinylated oligonucleotides (10, 25,                 A custom-built fluorescence lifetime measurement system was
                32, 40, 50, and 70 bases) and one additional strand of non-                        employed to measure the change in the donor’s and acceptor’s
                biotinylated oligonucleotide (50 bases) were obtained from                         lifetimes caused by FRET (Fig. 1). A nitrogen laser and a
                Integrated DNA Technology Inc. (Coralville, Iowa). All oligo-                      pumped-dye laser (nitrogen laser: OL-4300, dye laser: OL-
                nucleotides were labeled with Alexa Fluor 750 [N-                                  401, both from Optical Building Blocks Corporation,
                Hydroxysuccinimide (NHS) ester] at the 5′-end. The sequences                       Birmingham, New Jersey) were used to generate a light pulse
                of the oligonucleotides were: (1) 5-/5Alex750N/CAA CAATAC                          at 490 nm with a pulse width of ∼800 ps, using the OD 481
                A/3Bio/-3; (2) 5-/5Alex750N/CAA CAATAC ATC ATC TAC                                 dye (Optical Building Blocks Corporation). Collimation of
                CAT CAT C/3Bio/-3; (3) 5-/5Alex750N/CAA CAATAC ATC                                 the laser beam was achieved using two lenses (L1 and L2,
                ATC TAC CAT CAT CCA ACA AT/3Bio/-3; (4) 5-/                                        AC254-030, Thorlabs Inc., Newton, New Jersey). The intensity
                5Alex750N/CAA CAATAC ATC ATC TAC CAT CAT CCA                                       of the laser beam was controlled by a rotational neutral-density
                ACA ATA CAT CAT C/3Bio/-3; (5) 5-/5Alex750N/CAA                                    filter (Thorlabs Inc.), and a third lens (L3, A230TM-A, Thorlabs
                CAATAC ATC ATC TAC CAT CAT CCA ACA ATA CAT                                         Inc.) was used to couple the beam into a 200 μm multimode
                CAT CTA CCATCA TC/3Bio/-3; (6) 5-/5Alex750N/CAA                                    optical fiber (FT200EMT, Thorlabs Inc.). A laser beam from
                CAATAC ATC ATC TAC CAT CAT CCA ACA ATA CAT                                         the fiber was then collimated through a lens (L4, A230TM-
                CAT CTA CCATCA TCC AAC AAT ACA TCA TCT ACC                                         A, Thorlabs Inc.) to excite the sample.
                A/3Bio/-3; and (7) 5-/5Alex750N/CAA CAATAC ATC ATC                                     The spectral overlap of the donor (QD655) and the acceptor
                TAC CAT CAT CCA ACA ATA CAT CAT CTA CCATCA                                         (Alexa Fluor 750) as an FRET pair is shown in Fig. 2. The over-
                TC/-3. Biotinylated oligonucleotides labeled with Alexa Fluor                      lap between the QD655 emission (solid blue line) and the
                750 were denoted as BOAF.                                                          AF750 excitation (the dashed red line) spectra can be clearly
                                                                                                   seen; this is not significant but is acceptable. The relatively
                2.1.3    Buffer solutions                                                          small spectral overlap between QD655 and AF750 may lead
                                                                                                   to a relatively small FRET efficiency. However, this can be
                The QD’s incubation buffer [2% w/v bovine serum albumin                            easily compensated by our sensitive detection system and the
                (BSA) in 50 mM borate buffer, pH 8.3, containing 0.05%                             averaging method via multiple measurements. In our experi-
                sodium azide] was purchased from Life Technologies (Grand                          ment, the FRET signals have been clearly and stably measured,
                Island, New York), and was denoted as a borate buffer. PBS                         while the donor’s bleed-through was kept to a the minimum.
                packs (8 mM sodium phosphate, 2 mM potassium phosphate,                            A bandpass filter with a central wavelength of 485 nm and
                0.14 M NaCl, 10 mM KCl, pH 7.4) were purchased from                                a bandwidth of 20 nm (FF02-485/20, Semrock, Semrock, New
                Thermo Scientific (Rockford, Illinois). Tris (hydroxymethyl)                       York) was placed immediately after the lens to further clean the
                aminomethane (Tris) was obtained from Bio-Rad Laboratories,                        laser spectrum. Three neutral-density filters (OD 0.3, 0.4, and
                Inc. (Hercules, California). Tris buffer (10 mM Tris, adjusting                    0.6, Edmund Optics Inc., Barrington, New Jersey) were attached
                the pH to 8.0 with 1 M HCl), was prepared and used in the                          to the aforementioned bandpass filter only when measuring the

                Journal of Biomedical Optics                                               085008-2                                         August 2014   •   Vol. 19(8)

Downloaded From: https://www.spiedigitallibrary.org/journals/Journal-of-Biomedical-Optics on 31 Jan 2021
Terms of Use: https://www.spiedigitallibrary.org/terms-of-use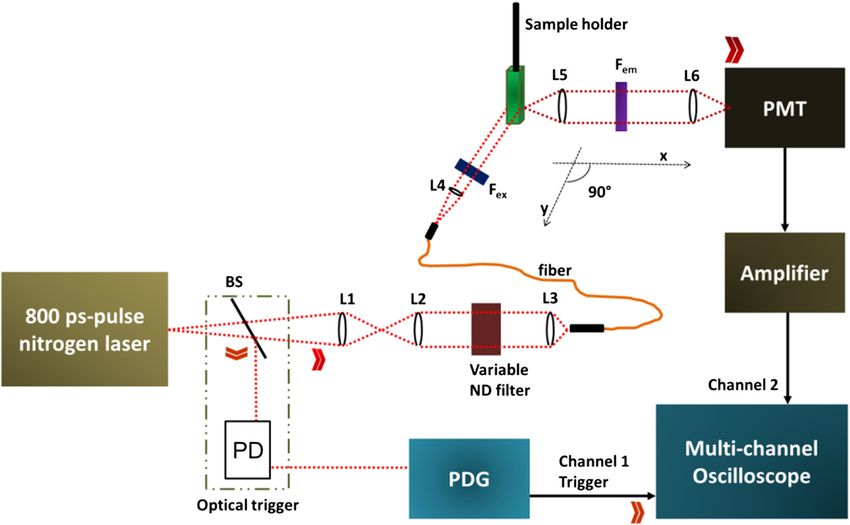
Saremi et al.: Re-evaluation of biotin–streptavidin conjugation in Förster resonance energy transfer applications

                                       Fig. 1 A schematic diagram showing the fluorescence lifetime measurement system. F ex , excitation
                                       filters; F em , emission filters; L, lens; PMT, photomultiplier tube; BS, beam splitter; PD, photodiode; PDG,
                                       pulse-delay generator; and ND filter, natural density filter.

                QD655 emission to prevent the PMT from possible saturation as                      optical delay of about 100 ns, which was sufficient time for
                a result of the much stronger fluorescence emission from QD655                     the electronic devices to respond for the best synchronization
                than from AF750. The emission filters for AF750 and QD655                          between the fluorescence emission pulses and data acquisitions.
                are a bandpass filter with a central wavelength of 785 nm and a                    An optical trigger device was placed between the laser system
                bandwidth of 62 nm (FF01-785/62, Semrock), and a bandpass                          and the fiber coupling system to split a small amount of the exci-
                filter with a central wavelength of 650 nm and a bandwidth of                      tation light from the laser and generate a voltage pulse via a fast
                60 nm (FF01-650/60, Semrock), respectively. A filter wheel                         photodiode. This voltage pulse was used to trigger a digital
                (CFW-6, Thorlabs Inc.) was used to switch between the two                          pulse-delay generator (PDG, DG645, Stanford Research
                emission filters. A pulse energy meter system (J-10MT-10KHZ                        Systems, Sunnyvale, California) and further trigger the oscillo-
                EnergyMax sensor or J-10Si-HE Quantum EnergyMax sensor                             scope for data acquisition. This setup provided very high accu-
                with the Labmax-Top laser power/energy meter, Santa Clara,                         racy of the synchronization between the fluorescence pulse and
                Sunnyvale, California) was used to measure the laser pulse                         data acquisition, therefore, a large amount of fluorescence
                energy. The emitted fluorescence photons were detected by a                        pulses could be acquired and averaged to improve the signal-
                photomultiplier tube (PMT, H10721-20, Hamamatsu, Japan).                           noise ratio. Each emission decay pulse recorded from the
                A broadband preamplifier (C5594, bandwidth from 50 kHz                             oscilloscope used for calculating fluorescence lifetime was an
                to 1.5 GHz, Hamamatsu, Japan) was used to convert the output                       average of 100 times of the excitation events. For each sample,
                of the PMT to a voltage signal and further amplify the signal.                     the experiment was repeated at least two times (therefore, the
                The voltage signal was then acquired by a multichannel and                         total number of the average is equivalent to at least 200).
                broadband oscilloscope (DPO 7254, 2.5 GHz, Tektronix,                              The mean and standard derivation (std) are calculated for
                                                                                                   each sample and are shown in the figures (i.e., mean  std).
                Beaveton, Oregon). The laser pulse was coupled into a 20-m
                                                                                                   Each sample was diluted to 3 mL and injected into a quartz
                long optical fiber (FT200EMT, Thorlabs Inc.) to generate an
                                                                                                   cuvette (Starna Cells, Atascadero, California) that was perpen-
                                                                                                   dicularly fixed to the path of the laser beam.

                                                                                                   2.2.3   Fluorescence lifetime calculation
                                                                                                   The system impulse response function was measured and
                                                                                                   used to deconvolve the acquired fluorescence decay data. The
                                                                                                   processed data were fitted to a single exponential decay function
                                                                                                   using MATLAB (Natick, Massachusetts). The fitting was done
                                                                                                   by an iterative numerical procedure until the best agreement
                                                                                                   with the experimental decay curve was achieved.

                                                                                                   2.2.4   AFM measurement

                Fig. 2 Plot showing the spectral overlap of the donor (QD655) and the              A 100 μL aliquot of each of the conjugated 70-base B2T and
                acceptor (Alexa Fluor 750) as an FRET pair.                                        B2P (B2T: the sample was incubated in borate buffer and

                Journal of Biomedical Optics                                               085008-3                                           August 2014   •   Vol. 19(8)

Downloaded From: https://www.spiedigitallibrary.org/journals/Journal-of-Biomedical-Optics on 31 Jan 2021
Terms of Use: https://www.spiedigitallibrary.org/terms-of-use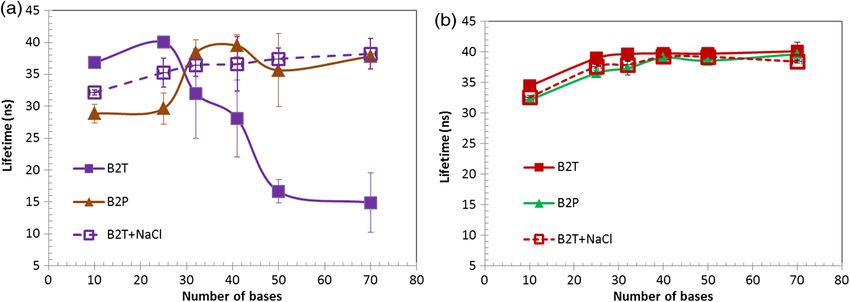
Saremi et al.: Re-evaluation of biotin–streptavidin conjugation in Förster resonance energy transfer applications
then diluted with Tris buffer. B2P: the sample was incubated in After an intensive investigation, however, we suspected that
borate buffer and then diluted with PBS buffer) samples were conclusion because the model did not take into consideration
deposited on a biotinylated coverslip, purchased from Microsur- the steric hindrance from the adjacent SAs and the QD. The
face, Inc. (#Bio_02, Englewood, New Jersey) and kept over- existence of the neighboring SAs on the QD might greatly
night in a humidified chamber at room temperature. The reduce the possibility of the laying-down binding mode because
resulting coverslip was rinsed three times with the same the space between each two adjacent SA molecules may be
D-buffer (Tris for B2T and PBS for B2P), shaken (∼2000 rpm) limited for fitting of the DNA or oligonucleotide. Instead,
for 3 min, and dried in the desiccator with vacuum. The meas- we found that the observed base pair-independent FRET
urement was performed with a Park XE70 AFM (Santa Clara, should be attributed to the buffer ionic strength which could
California), using a noncontact mode with ACTA probe. At least significantly affect the FRET of the (QD-SA)-(biotin-DNA-
10 locations were selected to measure each sample. “The root- dye) system.
mean-square (RMS) of the image roughness was calculated SA-coated QD655 (QD655-SA), which has a structure sim-
since it is a commonly used parameter in AFM to quantify the ilar to QD609-SA used in Ref. 16 with a longer peak emission
height, which is more sensitive to peaks and valleys than the wavelength (655 nm), was selected as a donor in this study.
average roughness.”18 A near-infrared fluorophore, Alexa Fluor 750 (AF750), was
adopted as the acceptor based on the reasonable spectral overlap
with the QD655-SA donor (see Fig. 2). Although a biotin was
2.3 System of (QD-SA)-(biotin-DNA-dye)
attached to the 3′-end of an oligonucleotide (a single-stranded
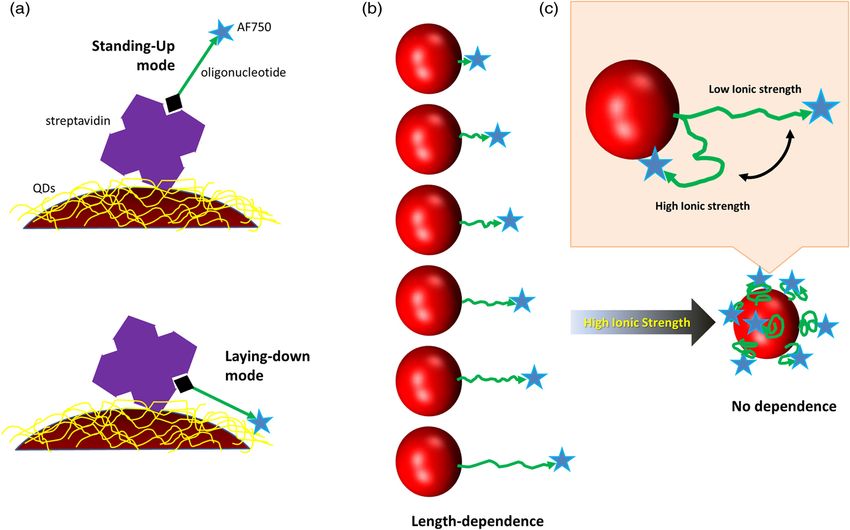
As mentioned in Ref. 16, two possible binding modes might DNA), the fluorophore of AF750 was labeled at the 5′-end.
exist between a biotinylated DNA and an SA attached on The AF750-labeled biotinylated oligonucleotide was denoted
a QD: standing-up and laying-down [Fig. 3(a)]. A significant as BOAF. Six oligonucleotides with base numbers of 10, 25,
FRET independent of the number of DNA base pairs was 32, 41, 50, and 70 were adopted (see details in Sec. 2). After
observed and attributed to the possibility of the laying-down conjugation, a QD655–SA∼BOAF structure was formed.
binding mode. In this mode, the acceptors labeled on the DNA While the bindings of biotin to SA occur in the C-buffer,
chains would stay within a much tighter area around the QD the oligonucleotide conformation (stretched or coiled) depends
donor than they would in the standing-up mode [see Fig. 3(a)]. on the D-buffer. It is reasonable to hypothesize that the
Fig. 3 (a) Illustration of two binding modes of biotinylated oligonucleotide to streptavidin-coated quantum
dots (QDs). Not to scale. (b and c) Illustration of our hypothesis in this work. At low-ionic strength, oligo-
nucleotide stretches from the QDs, leading to length-dependent FRET. At high-ionic strength, oligonu-
cleotide is more flexible but is prone to bending toward QDs. The separation distance between donor
and acceptor becomes smaller, falling well into the FRET range, so that no length-dependent FRET
was observed.
Journal of Biomedical Optics 085008-4 August 2014 • Vol. 19(8)
Downloaded From: https://www.spiedigitallibrary.org/journals/Journal-of-Biomedical-Optics on 31 Jan 2021
Terms of Use: https://www.spiedigitallibrary.org/terms-of-use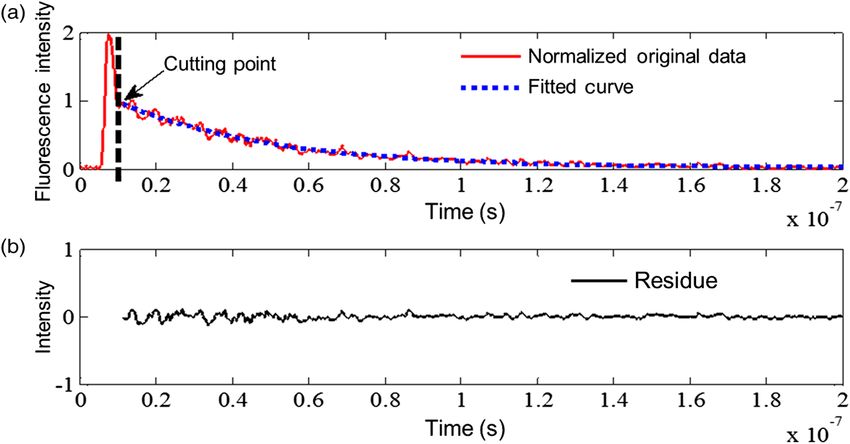
Saremi et al.: Re-evaluation of biotin–streptavidin conjugation in Förster resonance energy transfer applications

                donor-acceptor distance will correlate with the base number of                     the original decay curve. The lifetime was fitted by using the
                BOAF if the standing-up binding mode is dominant and the                           data after the cutting point. Remember that both the laser
                oligonucleotide is in the stretched conformation [see Fig. 3(b)].                  leakage and the direct excitation of the acceptors decay much
                Therefore, the measured FRET (indicated by the AF750 lifetime                      faster than the FRET signal. Therefore, the head part of the
                in this study) will depend on the base number of the oligonu-                      decay curve is the data that can possibly be contaminated by
                cleotide. Whenever the oligonucleotide transits from the                           the two types of noise.
                stretched to the coiled structure as a result of the change of
                the D-buffer, the donor-acceptor distance and thus the FRET                        3.2     Effect of Buffers (ionic strength) on FRET
                will lose correlation with the base number [see Fig. 3(c)]. By
                contrast, if the laying-down mode is dominant, the FRET                            When borate was used as a C-buffer and Tris as a D-buffer, for
                will not (or will very weakly) correlate with the base number,                     oligonucleotides with 10 bases, the fluorescence lifetime of the
                no matter the conformation of the oligonucleotide and the                          acceptor AF750 was found to be 36.9  0.59 ns [Fig. 5(a)],
                composition of the buffers. To characterize the FRET event, the                    which was significantly longer than the natural fluorescence
                fluorescence lifetimes of both the acceptor AF750 and the donor                    lifetime of AF750 (∼0.7 ns).19 There exists documented evi-
                QD655 were measured with a customized instrument (see                              dence that the lifetime of the acceptor increases in an FRET sys-
                Sec. 2.2.2 for details). Compared with intensity, the fluorescence                 tem,20,21 although it has been less rigorously studied than the
                lifetime is insensitive to the errors caused by unknown fluoro-                    increase of the donor’s lifetime. On the other hand, the average
                phore concentration variation, and is, therefore, more reliable.                   lifetime of the donor QD655 for all the bases was measured to be
                A molar ratio of QD655-SA to BOAF at 1 pmol∕10 pmol                                38.8 ns [Fig. 5(b)], consistent with the value given by the manu-
                was employed in the present study. Since each QD has 6 to                          facturer (∼30 to 40 ns). However, it should be noticed that the
                10 SA molecules according to the provided information from                         donor’s lifetime decreased when the acceptor (AF750)-labeled
                the vendor, Life Technologies, the molar amount of SA is 6                         10-base DNA linker was used. The lifetime of QD is decreased
                to 10 pmol. Consequently, the biotin-SA ratio in this study                        from 38.8 to 34 ns in Tris, while decreased from 38.8 to 32 ns in
                was ∼1 to 1.67. Such a relatively low ratio has the following                      PBS [Fig. 5(b)]. The result indicated an obvious FRET occur-
                advantages: (1) it can reduce the possibility of multiple BOAFs                    rence between QD655 and AF750. The lifetime reduction of the
                binding on one SA; and (2) the effect of acceptor concentration                    donor (from 38.8 to 32 or 34 ns) is not as significant as the life-
                on the FRET is minimized and the donor-acceptor distance is                        time lengthening of the acceptor (from 35 ns). This is
                the major factor affecting the FRET.                                               mainly attributed to the following factors: (1) the relatively low
                                                                                                   (∼10) acceptor per donor (APD) ratio in the conjugation step;
                                                                                                   (2) significantly higher extinction coefficient and quantum yield
                3     Results and Discussion
                                                                                                   of the donor (QD655) compared to the acceptor (AF750). The
                3.1     Fluorescence Lifetime Calculation                                          above factors contribute to the observation that the donor’s life-
                                                                                                   time had not been significantly affected by the acceptors.
                A tail fitting strategy was adopted to maximally remove two                            Apparently, the lifetime of AF750 in QD655–SA∼BOAF
                possible noises: (1) the laser leakage and (2) the emission                        was found to gradually decrease as the base number increased,
                from the acceptors (AF750) that are directly excited by the                        as shown by the purple curve with filled squares in Fig. 5(a).
                laser. The raw decay curve was truncated after an inflexion                        When the base number is greater than 50, no significant change
                point and then data-fitting via a single exponential function                      in the lifetime of AF750 is observed, which indicates that
                was performed. As an example, Fig. 4 shows the step-by-                            acceptors may be out of the FRET range and/or the background
                step process for the 25 base borate (C-buffer) to the Tris                         fluorescence is dominant. Therefore, the length-dependent
                (D-buffer) sample. The cutting point was selected based on                         FRET was observed in our system of QD655–SA∼BOAF.

                                       Fig. 4 Fluorescence lifetime calculation method. (a) Illustration of the decay curve for 25-base BOAF
                                       with borate as C-buffer and Tris as D-buffer and a single exponential tail fitting by setting a cut-off
                                       point. (b) Residues are shown versus time.

                Journal of Biomedical Optics                                               085008-5                                          August 2014   •   Vol. 19(8)

Downloaded From: https://www.spiedigitallibrary.org/journals/Journal-of-Biomedical-Optics on 31 Jan 2021
Terms of Use: https://www.spiedigitallibrary.org/terms-of-use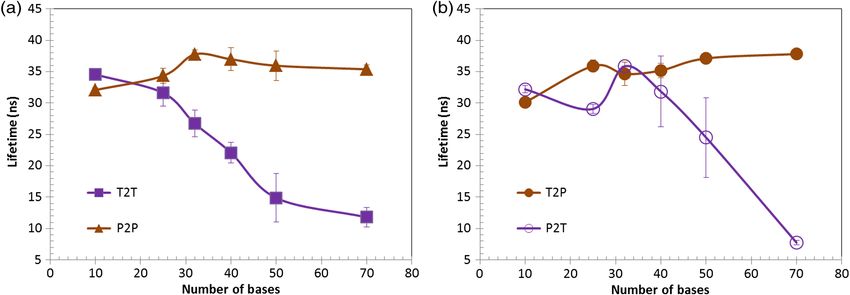
Saremi et al.: Re-evaluation of biotin–streptavidin conjugation in Förster resonance energy transfer applications

                                       Fig. 5 Fluorescence lifetimes of (a) the acceptor AF750 and (b) the donor QD655-SA vary as the base
                                       number of oligonucleotide increases. Excitation: 490 nm; emission: 785∕62 nm bandpass filter for
                                       (a) and 650∕60 nm bandpass filter for (b). B2T: the sample was incubated in borate buffer and then
                                       diluted with Tris buffer. B2P: the sample was incubated in borate buffer and then diluted with PBS buffer.
                                       B2T + NaCl: 140 mM NaCl was added into the B2T sample.

                This result provides strong evidence for our hypothesis of the                     at 50 and 70 bases significantly increase compared with those
                dominant standing-up mode in Fig. 3(a). The observed lifetimes                     measured in the Tris buffer. The lifetime fluctuates when the
                of 16.7  1.82 and 14.9  4.63 ns for the 50 and 70 bases sam-                     base increases (in a range of 6.1 ns with an average of
                ples could be partially attributed to the background fluorescence                  35 ns), suggesting a large FRET occurrence. This result implies
                noise (see Sec. 3.3). On the other hand, it has been observed that                 that the length-dependent FRET is favorable in a relatively low-
                when some gold nanoparticles22 or QDs23 are adopted as donors                      ionic-strength buffer (borate and Tris, 10 mM) as opposed to the
                (and dyes as acceptors), the FRET distance is much longer than                     length independence in a relatively high-ionic-strength buffer
                the conventional FRET distance between an organic dye donor-                       (PBS, 162.7 mM). To further investigate the effect of ionic
                acceptor pair. However, it is hard to quantify which mechanisms                    strength on the length-dependent or -independent FRET, we
                are dominant. This change may be caused by either one or both.                     implemented a straightforward experiment of adding ca.
                Figure 5(b) shows that the lifetime of the donor QD655 is rel-                     140 mM NaCl to the B2T samples (C-buffer: borate; D-buffer:
                atively stable for all oligonucleotide sequences (with an average                  Tris) and measuring the lifetime of AF750 again. As shown by
                lifetime 38.8 ns and varying within a range of 4.4 ns). This is                   the dashed purple curve with open squares in Fig. 5(a), the life-
                mainly attributed to the fact that the ratio of acceptor-donor was                 time of AF750 loses the length-dependence that is originally
                relatively low in the conjugation and that the donor’s lifetime                    observed in the Tris buffer and remains a relative stable value
                had not been significantly affected by the acceptors.                              for all oligonucleotide sequences (with an average of 36.5 ns
                    Interestingly, the length-dependent FRET disappears when                       and varies within a range of 3.6 ns). This length-independent
                the Tris is replaced with PBS as the D-buffer [the brown                           FRET resembles the result observed in the PBS buffer.
                curve with solid triangles in Fig. 6(a)]. The lifetimes of AF750                   Accordingly, we conclude that the length-dependent FRET is

                                       Fig. 6 Fluorescence lifetimes of the acceptor AF750 in QD655–SA∼BOAF with varying base numbers in
                                       different buffer solutions. T2T: the samples were conjugated in Tris buffer and then diluted with Tris
                                       buffer. P2P: the samples were conjugated in PBS buffer and then diluted with PBS buffer. T2P: the
                                       samples were conjugated in Tris buffer and then diluted with PBS buffer. P2T: the samples were con-
                                       jugated in PBS buffer and then diluted with Tris buffer. The excitation light and emission filters are
                                       the same as in Fig. 5.

                Journal of Biomedical Optics                                               085008-6                                        August 2014   •   Vol. 19(8)

Downloaded From: https://www.spiedigitallibrary.org/journals/Journal-of-Biomedical-Optics on 31 Jan 2021
Terms of Use: https://www.spiedigitallibrary.org/terms-of-use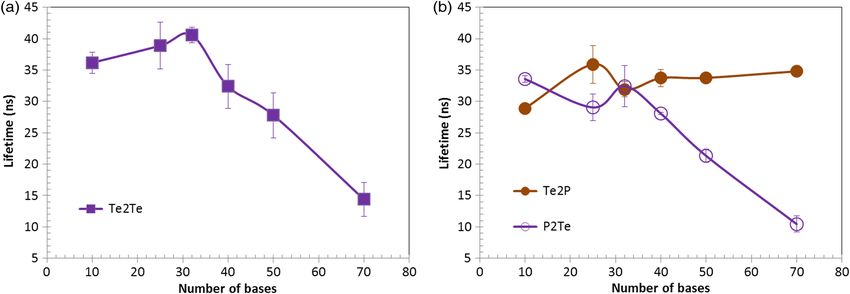
Saremi et al.: Re-evaluation of biotin–streptavidin conjugation in Förster resonance energy transfer applications

                favorable in low-ionic-strength buffers, such as 10 mM Tris, and                   solution is 3000 μL (30-fold dilution). As shown in Fig. 6(a),
                unfavorable in relatively high-ionic-strength buffers, such as                     a length-dependence of AF750 lifetime was observed for the
                PBS or Tris + NaCl. It has been reported that oligonucleotide                      T2T sample (Tris as both C- and D-buffers), while no depend-
                becomes more flexible when the ionic strength increases.14,24                      ence for the P2P sample (PBS as both C- and D-buffers) was
                The reason for this is that excess cations screen the negatively                   found. When the sample was conjugated in Tris and then diluted
                charged backbone of the oligonucleotide. At a low-ionic                            with PBS buffer (T2P), the dependence disappeared [Fig. 6(b)
                strength, oligonucleotide stretches outward from the QD655-                        brown curve with solid circles]. By contrast, when the sample
                SA, leading to the length-dependent FRET [Fig. 3(b)]. At                           was conjugated in PBS and diluted with the Tris buffer (P2T),
                a high-ionic strength, oligonucleotide is of high flexibility,                     the length-dependence of the AF750 lifetime reappeared [the
                making it prone to bend toward QD655-SA [Fig. 3(c)] and lose                       purple curve with open circles in Fig. 6(b)]. Taken together,
                the distance dependence. We also excluded the effect of pH on                      the use of PBS as a C-buffer is not able to significantly affect
                FRET by adjusting the pH from 6.0 to 9.0 (data not shown),                         the binding between BOAF and QD655-SA. It is worth noting
                although the difference in pH between the Tris buffer (8.0)                        that adding 2% (weight-volume ratio) BSA into the C-buffer is
                and the PBS buffer (7.4) used in this study was not significant.                   necessary to maintain good stability of the QD655-SA and
                    While the conformation of oligonucleotide can be altered at                    a relatively high viscosity of the solution for the centrifugal
                a high-ionic strength, another question is whether such a con-                     filtering process (see Sec. 2 for details).
                formation change will hinder the binding between BOAF and                              As long as the D-buffer (or the final solution) is Tris with an
                QD655-SA in the initiate conjugation step (in C-buffer). To                        ionic strength of ∼10 mM, a length-dependent FRET is observ-
                address this question, we investigated the lifetime change of                      able. In fact, such a low-ionic-strength Tris buffer has been
                AF750 in different combinations of Tris and PBS buffer                             widely used in the literature for investigating the DNA linked
                solutions (as C- or D-buffer, or both). Note that the total                        FRET system.4,8,10,11,15 Like Tris, TE is another commonly used
                volume for conjugation is 100 μL while the final diluted                           buffer with a lower ionic strength compared to PBS. We also
                                                                                                   obtained similar results when replacing Tris with the TE buffer
                                                                                                   (Figs. 7 and 8).
                                                                                                       Currently, it is unclear why the samples with 10 bases do not
                                                                                                   show the highest value in the acceptor’s lifetime in Figs. 5(a)
                                                                                                   and 8(a). Possible reasons may include: (1) self-quenching of
                                                                                                   acceptors may happen because the average distance between
                                                                                                   two adjacent acceptors becomes short when the DNA base is
                                                                                                   small; (2) FRET may become saturated if the donor-acceptor
                                                                                                   distance is so short; and (3) some system measurement errors
                                                                                                   may exist.

                                                                                                   3.3     Background Noise of Fluorescence (Measured
                                                                                                           From Control Samples)
                                                                                                   The lifetime of the AF750 with all the different lengths of the
                Fig. 7 Fluorescence lifetime of the acceptor AF750 in QD655–
                                                                                                   biotinylated DNA molecule along with the nonbiotinylated
                SA∼BOAF with varying base numbers in buffer solutions of B2Te
                and B2Te + NaCl. B2Te: the sample was incubated in borate buffer                   DNA was measured in PBS, Tris, and TE as a control of the
                and then diluted with TE buffer. B2Te + NaCl: 140 mM NaCl                          acceptor’s lifetime (Fig. 9). The calculated lifetimes are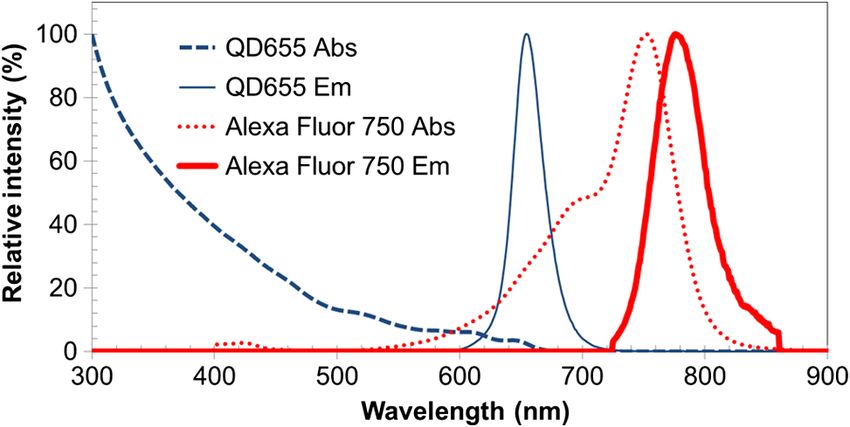
Saremi et al.: Re-evaluation of biotin–streptavidin conjugation in Förster resonance energy transfer applications

                                       Fig. 9 Lifetime of Alexa Fluor 750 in Tris, TE, and PBS versus the number of DNA bases for (a) biotiny-
                                       lated DNA and (b) 50 bases nonbiotinylated DNA.

                    To further evaluate the background fluorescent noise, another                  Compared with the QD655-SA alone samples, the lifetimes in
                two control samples were adopted: (1) QD655-SA alone and                           B2T and B2P increase [13.6  2.27 and 10.4  0.08 ns, respec-
                (2) QD655-SA with nonbiotinylated AF750-labeled oligonu-                           tively, see Fig. 10(a)]. However, these two values are much
                cleotides (50 bases). In Fig. 10(a), the lifetimes of the                          larger than the natural lifetime of AF750 (∼0.7 ns). This is
                QD655-SA alone samples in B2T and B2P are shown to be                              mainly attributed to the FRET between the QD655-SA and
                7.3  1.10 and 7.10  0.09 ns, respectively, when measured                         the remaining AF750 in the solution (although the same filtering
                using the AF750 emission filter (785∕62 nm). They are                              steps have adopted, a small amount of AF750-labeled oligonu-
                much shorter than the lifetime of the QD655-SA alone samples                       cleotides may remain in the solution). This type of FRET is
                (38.6  1.01 or 38.5  0.65 ns) in Fig. 10(b) when measured                        strongly dependent on the concentration of AF750 instead of
                using the QD emission filter (655∕60 nm). However, they are                        the base numbers of the oligonucleotides. After the filtering,
                much longer than the laser pulse width (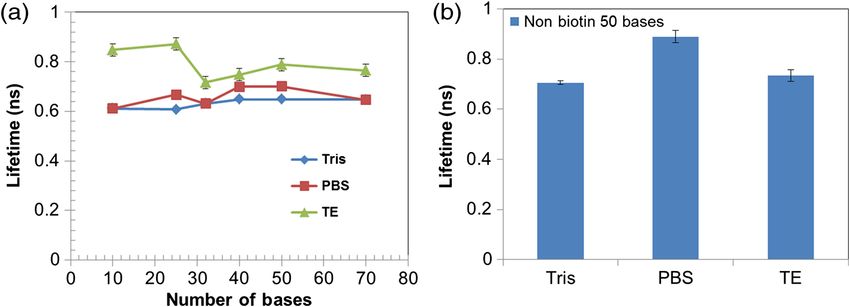
Saremi et al.: Re-evaluation of biotin–streptavidin conjugation in Förster resonance energy transfer applications

                which indicates that the remaining AF750 does not significantly                    by the direct excitation of the acceptor AF750 on the FRET sig-
                change the QD655 fluorescence emission properties. Similar                         nal can be very easily eliminated because its lifetime 35 ns. However, when QD655 is mixed
                donor and acceptor have comparable lifetimes, extinction coef-                     with nonbiotin DNA-dye, the measured acceptor lifetime is
                ficients, quantum yields, and widths of the emission spectra.                      between 10 and 20 ns (see the data in Fig. 10), which is
                This is mainly due to two reasons. (1) Usually, the donor chan-                    much shorter than the QD655 lifetime (>35 ns). Therefore,
                nel has a relatively weaker bleed-through from the acceptor                        the measured signal should not be caused by the reabsorp-
                emission than the acceptor channel has from the donor emission.                    tion-and-reemission effect. Instead, it is mainly caused by
                This is because the wavelength of the laser is usually close to the                the slight bleed-through from the QD655. In Figs. 5 and 7,
                excitation peak wavelength of the donor, but is far away from                      the dependence of the acceptor lifetime on the DNA length
                that of the acceptor, therefore, the donor emission is usually                     is eliminated when adding NaCl into the sample. This fact indi-
                stronger than the acceptor emission. (2) The donor is less likely                  cates that the measured signal from the acceptor channel
                to be excited (and further emit light) by the emission light of the                should not be caused by the reabsorption-and-reemission phe-
                acceptor because there is usually none or an ignorable spectral                    nomenon because this phenomenon is independent of NaCl
                overlap between the acceptor emission and donor excitation                         concentration. Therefore, the effect of reabsorption-and-
                spectra. In contrast, it is possible that some acceptors are directly              reemission is ignorable. The following reasons may explain
                excited (and further emit light) by the emission light of the                      why the effect of the reabsorption-and-reemission is ignorable
                donors because of the spectral overlap between the donor emis-                     in the adopted QD655-DNA-AF750: (a) both the donor and
                sion and acceptor excitation spectra. This type of phenomenon                      acceptor have a very low concentration (1 pmol donor and
                can be called reabsorption-and-reemission and is different from                    10 pmol acceptor) in our sample; (b) the acceptor has a low
                FRET (FRET does not involve donor emission).                                       quantum yield and small extinction coefficient; and (c) the
                    However, compared with the acceptor, if the donor has a                        spectral overlap between the donor and acceptor is small.
                much narrower emission spectrum, a much longer lifetime, a                             Here, we summarize and compare the possible signal com-
                much larger extinction coefficient, and a much higher quantum                      ponents in the acceptor channel of the adopted QD655-DNA-
                yield, the lengthening of the acceptor’s lifetime can be used and                  AF750: (a) when the acceptors (AF750) are well attached on
                may be even better as an FRET indicator.20,21 This is true for                     the donor (QD655) and they are within the FRET distance
                the FRET system adopted in this study (QD655-DNA-AF750).                           range, the FRET is the dominant effect; (b) when the acceptors
                The above parameters for QD655 and AF750 are listed in                             are attached on the donor but are separated so far that they are
                Table 1 for comparison.                                                            out of the FRET distance, two possible effects may be dominant:
                    The concern of the donor’s (QD655) bleed-through to the                        the bleed-through from donor (QD655) to acceptor (AF750) and
                acceptor (AF750) channel can be efficiently minimized because                      the FRET between the donors and those unattached free accept-
                QD655 has a narrow emission spectrum and almost no overlap                         ors (i.e., the residue of the free acceptors, because they are free
                with the pass band of the emission filter of the acceptor channel.                 and have a small possibility of reaching the vicinity of the
                This has been validated by the control sample (i.e., the sample                    donor); (c) the reabsorption-and-reemission may be the weakest
                with only QDs) in which the contribution of this type of noise is                  effect, and it does not show an observable effect in our results.
                weak. In addition, the effect of the fluorescence emission caused                      In contrast, using the donor’s lifetime shortening as the
                                                                                                   FRET indicator has some disadvantages. Specifically, to shorten
                                                                                                   a bright QD’s long lifetime (QD655 >35 ns), a large amount of
                Table 1 Comparison of fluorescence parameters of the donor and                     acceptors (AF750) is usually needed. This is because: (a) the
                acceptor studied in the current work.a                                             donor (QDs) usually has a much larger quantum yield and
                                                                                                   extinction coefficient, and a much longer lifetime than the
                                  Width of the                                                     acceptor (AF750); (b) all or the majority of donors (QDs) should
                                   emission                                                        have enough acceptors (AF750) to generate an obvious FRET
                                 spectrum (nm)                                  Extinction         (in contrast, if only a small portion of QDs are quenched by the
                                                      Lifetime   Quantum        coefficient        AF750, the lifetime will not significantly decrease).
                               FWHMb      FWTMc         (ns)      yield        (cm−1 M−1 )             When a large amount of acceptor (AF750) is used, it can
                QD655            ∼30        ∼65         >35         0.6       2,900,000 at
                                                                                                   generate some problems. (a) More residue of the free AF750
                (donor)                                                         488 nm             (unattached DNA-AF750) may exist in the sample (although
                                                                                                   a centrifugal filter was always used to get rid of the free
                AF750            ∼54        ∼108        0.7         0.12       240,000 at          DNA-AF750 as much as possible). These free dyes in the sam-
                (acceptor)                                                      749 nm             ple would also shorten the lifetime of the donor (QDs) (but not
                a
                  See the data from the manufacturer.17                                            the FRET that we are investigating). Thus, it is difficult to differ-
                b
                  Full width at the half maximum.                                                  entiate the effect of the free dye from the effect of the attached
                c
                 Full width at one-tenth of the maximum.                                           dye. (b) Therefore, the donor’s lifetime will also depend on the

                Journal of Biomedical Optics                                               085008-9                                           August 2014   •   Vol. 19(8)

Downloaded From: https://www.spiedigitallibrary.org/journals/Journal-of-Biomedical-Optics on 31 Jan 2021
Terms of Use: https://www.spiedigitallibrary.org/terms-of-use
Saremi et al.: Re-evaluation of biotin–streptavidin conjugation in Förster resonance energy transfer applications
acceptor concentration (the more AF750 residue in the sample 3.5 Further Evidence From Atomic Force
gives the shorter of the donor’s lifetime), which can be confused Microscopy
with the FRET we are investigating via the QD-DNA-dye
To further verify our hypothesis, AFM was employed to inves-
system.
tigate the attachment of the QD655–SA∼BOAF (70 bases) on
More importantly, it may not be practical to attach a large
the surface of a biotinylated coverslip (Bio_02, MicroSurfaces
amount of acceptors on one QD (donor). This is because the
Inc., Englewood, New Jersey). Since the 70 bases linker caused
number of the SA on each QD655 is limited ∼6 to 10 (based on
no FRET in low salt solutions but did cause a dramatic FRET
manufacturer provided data). Although each SA has four bio-
in high salt solutions, it was an all-or-nothing condition.
tin-binding sites, in practice it is highly possible that ∼1 to 2
Furthermore, it has a relatively long chain so that its conforma-
binding sites on each SA are not available for biotin-DNA-
tion change could be possibly be detected by AFM. Compared
AF750 because they may be blocked by the QD and/or the
with the biotinylated oligonucleotides, the biotins on the cover-
surrounding other SAs due to steric hindrance. Thus, the
slip have much smaller dimensions. Thus, the steric hindrance
number of the acceptors that can be attached on one donor
from the surrounding SAs on the QD655 can be dramatically
isSaremi et al.: Re-evaluation of biotin–streptavidin conjugation in Förster resonance energy transfer applications
by the manufacturer) were found to be 10 to 18 nm [see 2. H. Sahoo, “Forster resonance energy transfer—a spectroscopic nanor-
Fig. 11(c)]. After conjugation with QD655–SA∼BOAF, we uler: principle and applications,” J. Photochem. Photobiol. C 12(1),
20–30 (2011).
found that the height values of the peaks for the B2P sample
3. W. R. Algar, A. J. Tavares, and U. J. Krull, “Beyond labels: a review of
increased by 15 to 20 nm [Fig. 11(b)], which fits well in the the application of quantum dots as integrated components of assays,
diameter range of QD655-SA according to the vendor’s manual. bioprobes, and biosensors utilizing optical transduction,” Anal. Chim.
Because the sample was measured after the buffer solution Acta 673(1), 1–25 (2010).
had dried, the height contributed by oligonucleotide molecules 4. K. E. Sapsford et al., “Analyzing nanomaterial bioconjugates: a review
could hardly be observed. Consequently, we conclude that of current and emerging purification and characterization techniques,”
many more QD655–SA∼BOAFs are attached on the coverslip Anal. Chem. 83(12), 4453–4488 (2011).
5. I. L. Medintz et al., “Quantum dot bioconjugates for imaging, labelling
surface in the B2P buffer than in the B2T buffer. This result and sensing,” Nat. Mater. 4(6), 435–446 (2005).
indicates that the binding between the SA on QD655 and the 6. E. R. Goldman et al., “Avidin: a natural bridge for quantum dot-
biotin on the coverslip was more feasible in the B2P sample antibody conjugates,” J. Am. Chem. Soc. 124(22), 6378–6382
(with high-ionic strength) than in the B2T sample (with high- (2002).
ionic strength). Figure 11(d) shows a possible mechanism to 7. D. S. Lidke et al., “Quantum dot ligands provide new insights into
explain the above result. For the B2T sample, the oligonucleo- erbB/HER receptor-mediated signal transduction,” Nat. Biotechnol.
22(2), 198–203 (2004).
tide molecules may be stretched-out because of the low-ionic 8. C. Y. Zhang et al., “Single-quantum-dot-based DNA nanosensor,” Nat.
strength of the buffers [see the left panel in Fig. 11(d)]. Mater. 4(11), 826–831 (2005).
These stretched oligonucleotides may significantly reduce the 9. R. Roy, S. Hohng, and T. Ha, “A practical guide to single-molecule
possibility of the SAs on the QD655 conjugating with the bio- FRET,” Nat. Methods 5(6), 507–516 (2008).
tins on the coverslip. In contrast, for the B2P sample, the oligo- 10. C. Y. Zhang and L. W. Johnson, “Microfluidic control of fluorescence
nucleotide molecules may be significantly coiled because of resonance energy transfer: breaking the FRET limit,” Angew. Chem. Int.
Ed. 46(19), 3482–3485 (2007).
the high-ionic strength of the buffers [see the right panel in
11. M. Levy, S. F. Cater, and A. D. Ellington, “Quantum-dot aptamer bea-
Fig. 11(d)]. Thus, the possibility of the SAs on the QD655 cons for the detection of proteins,” Chembiochem 6(12), 2163–2166
being exposed to the biotins on the coverslip can dramatically (2005).
increase, which leads to the immobilization of the QD655. The 12. C. Y. Zhang and L. W. Johnson, “Quantum-dot-based nanosensor for
above result may be considered an additional evidence for veri- RRE IIB RNA-Rev peptide interaction assay,” J. Am. Chem. Soc.
fying our hypothesis about the effect of the buffer ionic strength 128(16), 5324–5325 (2006).
on the conformation change of the oligonucleotides. 13. M. C. Murphy et al., “Probing single-stranded DNA conformational
flexibility using fluorescence spectroscopy,” Biophys. J. 86(4), 2530–
2537 (2004).
4 Conclusions 14. H. Chen et al., “Ionic strength-dependent persistence lengths of single-
stranded RNA and DNA,” Proc. Natl. Acad. Sci. U. S. A. 109(3), 799–
In the buffers with low-ionic strength (such as borate, Tris, and 804 (2012).
TE buffer), length-dependent FRET between QD655-SA and 15. S. Hohng and T. Ha, “Single-molecule quantum-dot fluorescence
BOAF was confirmed by the observation of the acceptor resonance energy transfer,” Chemphyschem 6(5), 956–960 (2005).
AF750s fluorescence lifetime. In the buffers with high-ionic 16. K. Boeneman et al., “Quantum dot DNA bioconjugates: attachment
strength (such as PBS and NaCl-added Tris), a strong length- chemistry strongly influences the resulting composite architecture,”
ACS Nano 4(12), 7253–7266 (2010).
independent FRET was observed. The independence was likely
17. I. Johnson and M. T. Z. Spence, “Molecular probes handbook, a guide to
attributed to the increased flexibility of the oligonucleotide fluorescent probes and labeling technologies,” http://www.lifetechnologies
chain when the cations screen the negatively charged backbone .com/us/en/home/references/molecular-probes-the-handbook.html (28 July
of the oligonucleotide. This flexibility increases the possibility 2014).
of the terminal-attached acceptors (AF750) approaching the 18. E. S. Gadelmawla et al., “Roughness parameters,” J. Mater. Process
vicinity of the donor. If the buffer solutions and the SA-biotin Technol. 123(1), 133–145 (2002).
molecular ratio are appropriately selected, we draw the follow- 19. M. Hassan et al., “Fluorescence lifetime imaging system for in vivo
studies,” Mol. Imaging 6(4), 229–236 (2007).
ing conclusions based on the above data: (1) the system of (QD-
20. J. R. Lakowicz, Principles of Fluorescence Spectroscopy, Springer,
SA)-(biotin-DNA-dye) is appropriate for investigating the New York (2006).
distance-dependent FRET between the QD and the dye if they 21. S. L. Shorte and F. Frischknecht, Imaging Cellular and Molecular
are linked by a single-stranded DNA, and (2) the effect of the Biological Functions, Springer, Berlin (2007).
SAs multiple binding modes on the FRET (proposed in Ref. 16) 22. S. Mayilo et al., “Long-range fluorescence quenching by gold nanopar-
may not be dominant compared with the effect of the buffer ticles in a sandwich immunoassay for cardiac troponin T,” Nano Lett.
ionic strength. 9(12), 4558–4563 (2009).
23. H. E. Grecco et al., “Ensemble and single particle photophysical pro-
per-ties (two-photon excitation, anisotropy, FRET, lifetime, spectral
Acknowledgments conversion) of commercial quantum dots in solution and in live cells,”
This work was supported in part by funding from the NIH/ Microsc. Res. Tech. 65(4–5), 169–179 (2004).
NIBIB 7R15EB012312-02 (B. Yuan), the CPRIT RP120052 24. J. Ambia-Garrido, A. Vainrub, and B. M. Pettitt, “A model for structure
(B. Yuan), and the NSF CBET-1253199 (B. Yuan). The authors and thermodynamics of ssDNA and dsDNA near a surface: a coarse
grained approach,” Comput. Phys. Commun. 181(12), 2001–2007
are grateful to Dr. K. Nguyen and Dr. Y. Hong for sharing lab (2010).
equipment for this study, and to Dr. Y. Pei for constructive
discussion.
Bahar Saremi received her BS degree from Amirkabir University of
Technology in Iran and is currently working toward the PhD degree in
References bioengineering at the University of Texas at Arlington, Texas, USA.
Her current research has been about developing contrast agents
1. L. Stryer, “Fluorescence energy-transfer as a spectroscopic ruler,” and investigating the properties of dyes with potential for further
Annu. Rev. Biochem. 47, 819–846 (1978). applications in fluorescence imaging systems.
Journal of Biomedical Optics 085008-11 August 2014 • Vol. 19(8)
Downloaded From: https://www.spiedigitallibrary.org/journals/Journal-of-Biomedical-Optics on 31 Jan 2021
Terms of Use: https://www.spiedigitallibrary.org/terms-of-useSaremi et al.: Re-evaluation of biotin–streptavidin conjugation in Förster resonance energy transfer applications
Ming-Yuan Wei received the PhD degree in environmental science Bingbing Cheng received the bachelor of engineering degree in bio-
from the Chinese Academy of Science, Beijing, China, in 2009. He medical engineering from Beijing Jiaotong University, Beijing, China,
was a postdoctoral research associate at West Virginia University. in 2011. He is currently working toward the PhD degree with Professor
In June 2012, he joined with Professor Baohong Yuan’s group in Baohong Yuan’s group in the Ultrasound and Optical Imaging
the Department of Bioengineering, University of Texas at Arlington, Laboratory, Department of Biomedical Engineering, University of
Arlington, Texas, USA. His current research interests include the Texas at Arlington, USA. His current research interests include the
development of contrast agents for ultrasound-switchable fluores- development of ultrasound-switchable fluorescence imaging contrast
cence imaging with thermoresponsive polymer or nanoparticles and agents based on thermosensitive polymer or nanoparticles and envi-
environment-sensitive fluorophores. ronment-sensitive fluorophores.
Yuan Liu received the BS degree in biomedical engineering from Baohong Yuan received the BS degree in microelectronics from the
Huazhong University of Science and Technology, Wuhan, China, Harbin Institute of Technology, Harbin, China, in 1997, and the PhD
in 2008, and the MS degree in biomedical engineering from The degree in biomedical engineering from the University of Connecticut,
Catholic University of America, Washington, D.C., USA, in 2010. USA, in 2006. He is currently an associate professor of biomedical
She is finishing her PhD degree in bioengineering at the University engineering at the University of Texas at Arlington, USA. His research
of Texas at Arlington, USA. Her research interests include developing interest is to explore and develop new imaging technology, including
ultrasound-mediated fluorescence imaging techniques, optical and contrast agents and instruments, for understanding cancer mecha-
ultrasound contrast agents, and imaging systems for fast microbubble nisms, early detecting and diagnosing cancers, and monitoring
motion detection. cancer treatment efficiency.
Journal of Biomedical Optics 085008-12 August 2014 • Vol. 19(8)
Downloaded From: https://www.spiedigitallibrary.org/journals/Journal-of-Biomedical-Optics on 31 Jan 2021
Terms of Use: https://www.spiedigitallibrary.org/terms-of-useYou can also read