Understanding the effects of climate warming on streamflow and active groundwater storage in an alpine catchment: the upper Lhasa River
←
→
Page content transcription
If your browser does not render page correctly, please read the page content below
Hydrol. Earth Syst. Sci., 24, 1145–1157, 2020
https://doi.org/10.5194/hess-24-1145-2020
© Author(s) 2020. This work is distributed under
the Creative Commons Attribution 4.0 License.

Understanding the effects of climate warming on streamflow and
active groundwater storage in an alpine catchment: the
upper Lhasa River
Lu Lin1,2 , Man Gao3 , Jintao Liu1,2 , Jiarong Wang1,2 , Shuhong Wang1,2 , Xi Chen1,2,3 , and Hu Liu4
1 State Key Laboratory of Hydrology-Water Resources and Hydraulic Engineering, Hohai University,
Nanjing 210098, People’s Republic of China
2 College of Hydrology and Water Resources, Hohai University, Nanjing 210098, People’s Republic of China
3 Institute of Surface-Earth System Science, Tianjin University, Tianjin 300072, People’s Republic of China
4 Linze Inland River Basin Research Station, Chinese Ecosystem Research Network, Lanzhou 730000,

People’s Republic of China

Correspondence: Jintao Liu (jtliu@hhu.edu.cn)

Received: 11 June 2019 – Discussion started: 17 June 2019
Revised: 28 November 2019 – Accepted: 31 January 2020 – Published: 11 March 2020

Abstract. Climate warming is changing streamflow regimes         sults from this study suggest that the impacts of glacial re-
and groundwater storage in cold alpine regions. In this study,   treat and permafrost degradation show compound behaviors
the Yangbajain headwater catchment in the Lhasa River basin      on the storage–discharge mechanism due to climate warm-
is adopted as the study area to assess streamflow changes and    ing, and that this fundamentally affects the water supply and
active groundwater storage in response to climate warming.       the mechanisms of streamflow generation and change.
The results show that both annual streamflow and the mean
air temperature increase significantly at respective rates of
about 12.30 mm per decade and 0.28 ◦ C per decade from
1979 to 2013 in the study area. The results of gray relational
analysis indicate that the air temperature acts as a primary     1   Introduction
factor for the increased streamflow. Due to climate warm-
ing, the total glacier volume has retreated by over 25 % dur-    Often referred to as the “Water Tower of Asia”, the Ti-
ing the past 50 years, and the areal extent of permafrost has    betan Plateau (TP) is the source area of major rivers in Asia,
degraded by 15.3 % over the last 20 years. Parallel compar-      including the Yellow, Yangtze, Lancang–Mekong, Yarlung
isons with other subbasins in the Lhasa River basin indirectly   Tsangpo–Brahmaputra, Nu–Salween and Indus rivers (Cuo
reveal that the increased streamflow at the Yangbajain Sta-      et al., 2014). The delayed release of water resources on the
tion is mainly fed by the accelerated glacier retreat. Using     TP from glacier melt can augment river runoff during dry
baseflow recession analysis, we also find that the estimated     periods, meaning that it plays a pivotal role with respect
groundwater storage that is comparable with the GRACE            to the water supply for downstream populations, agriculture
data increases significantly at rates of about 19.32 mm per      and industries that rely on these rivers (Viviroli et al., 2007;
decade during the abovementioned period. That is to say,         Pritchard, 2017). However, the TP has experienced a signifi-
as permafrost thaws, more spaces have been made available        cant warming period over the last 50 years (Kang et al., 2010;
to accommodate the increasing meltwater. Finally, a large        Liu and Chen, 2000). Along with rising temperature, major
water imbalance (of more than 5.79 × 10⁷ m3 a−1 ) between        warming-induced changes have occurred over the TP, such
the melt-derived runoff and the actual increase in runoff as     as glacier retreat (Yao et al., 2004, 2007) and frozen ground
well as the groundwater storage is also observed. The re-        degradation (Wu and Zhang, 2008; Xu et al., 2019). Hence,
                                                                 it is of great importance to elucidate how climate warming

Published by Copernicus Publications on behalf of the European Geosciences Union.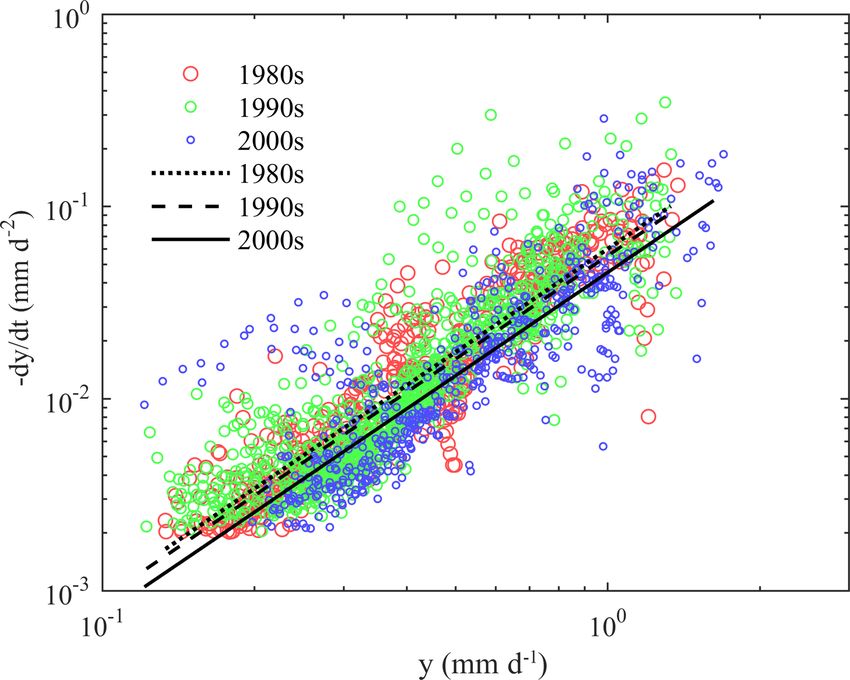
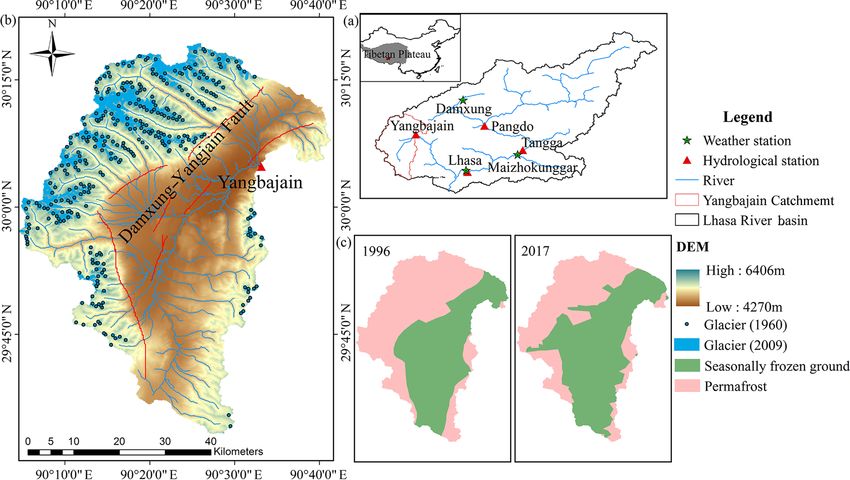
1146                                                                L. Lin et al.: Understanding the effects of climate warming

influences hydrological processes and water resources on the         sess total groundwater storage changes (Green et al., 2011).
TP.                                                                  More importantly, quantitatively characterizing storage prop-
   In cold alpine catchments, glaciers are known as “solid           erties and sensitivity to climate warming in cold alpine catch-
reservoirs” that supply water via streamflow, while frozen           ments is desired for local water as well as downstream water
ground, especially permafrost, serves as an impermeable bar-         management (Staudinger, 2017).
rier to the interaction between surface water and groundwater           Xu et al. (2019) used a simple ratio of the maximum and
(Immerzeel et al., 2010; Walvoord and Kurylyk, 2016; Rog-            minimum runoff to indirectly indicate the change in storage
ger et al., 2017). Since the 1990s, most glaciers across the TP      capacity as well as the effects of permafrost on recession pro-
have retreated rapidly due to global warming, and this has           cesses. An alternative method, namely recession flow analy-
caused an increase of more than 5.5 % in river runoff from           sis, can theoretically be used to derive the active groundwa-
the plateau (Yao et al., 2007). Meltwater is the key contrib-        ter storage volume to reflect frozen ground degradation in
utor to streamflow increase, especially in headwater catch-          a catchment (Brutsaert and Nieber, 1977; Brutsaert, 2008).
ments with larger glacier coverage (> 5 %) (Bibi et al., 2018;       For example, groundwater storage changes can be inferred
Xu et al., 2019). For example, the total discharge increase of       by recession flow analysis, assuming linearized outflow from
2.7 %–22.4 % that is mainly due to increased glacier melt in         aquifers into streams (Lin and Yeh, 2017). Due to the com-
the upper Brahmaputra (also known as the Yarlung Tsangpo)            plex structures and properties of catchment aquifers, the lin-
accounts for more than half of the total discharge increase          ear reservoir model may not be sufficient to represent the ac-
(Su et al., 2016).                                                   tual storage dynamics (Wittenberg, 1999; Chapman, 1999;
   Meanwhile, in a warming climate, numerous studies have            Liu et al., 2016). Hence, Lyon et al. (2009) adopted the
suggested that frozen ground on the TP has experienced a             nonlinear reservoir to fit baseflow recession curves for the
noticeable degradation over the past few decades (Cheng              derivation of aquifer attributes, which can be developed to
and Wu, 2007; Wu and Zhang, 2008; Zou et al., 2017).                 infer aquifer storage. Buttle (2017) used the approach from
Frozen ground degradation can modify surface conditions              Kirchner (2009) to estimate the dynamic storage in different
and change the thawed active layer storage capacity in alpine        basins and found that the storage and release of dynamic stor-
catchments (Niu et al., 2011). Thawing of frozen ground in-          age may mediate the baseflow response to temporal changes.
creases surface water infiltration, supports deeper groundwa-        Generally, classical recession flow analysis, which is based
ter flow paths and subsequently enlarges groundwater stor-           on widely available hydrologic data, is still widely used to
age, which is expected to have a profound effect on flow             provide important information on the storage–discharge re-
regimes (Kooi et al., 2009; Bense et al., 2012; Walvoord             lationship of a basin (Patnaik et al., 2018).
and Striegl, 2007; Woo et al., 2008; Ge et al., 2011; Walvo-            In this study, the Yangbajain Catchment in the Lhasa River
ord and Kurylyk, 2016; Li et al., 2018; Wang et al., 2018).          basin is adopted as the study area. The catchment is ex-
For example, Wang et al. (2018) suggested that ground ice            periencing glacier retreat and frozen ground degradation in
may be a potential water source in continuous permafrost re-         response to climate warming. The main objectives of this
gions of the central TP under global warming. However, in            study are (1) to assess the changes between surface runoff
the high mountainous regions of the TP, various terms of wa-         and baseflow in a warming climate, (2) to quantify active
ter recharge are quite complex, especially at low elevations.        groundwater storage volume using recession flow analysis,
In general, permafrost thaw in arctic basins has resulted in a       and (3) to analyze the impacts of the changes in active
general upward trend of 0.7 % a−1 –0.9 % a−1 in the ground-          groundwater storage on streamflow variation. The paper is
water contribution to streamflow, although with no pervasive         structured as follows: Sect. 2 includes the study area, data
change in total annual runoff (Walvoord and Striegl, 2007).          sources and methods. Sects. 3 and 4 present the changes in
Similar results have also been found in the central and north-       streamflow and its components, climate factors and glaciers,
ern TP (Liu et al., 2011; Niu et al., 2016; Xu et al., 2019).        as well as a discussion of the changing regimes of streamflow
Moreover, a slowdown in baseflow recession was found in              volume and baseflow recession in response to the changes
the northeastern and central TP (Niu et al., 2011, 2016; Wang        in active groundwater storage and glaciers; finally, the main
et al., 2017), in northeastern China (Duan et al., 2017) and in      conclusions are summarized in Sect. 5.
Arctic rivers (Lyon et al., 2009; Lyon and Destouni, 2010;
Walvoord and Kurylyk, 2016).
   Generally, in alpine regions, glacier retreat and permafrost      2     Materials and methods
thawing that is triggered by climate warming is changing the
hydrological processes of storage and discharge. However,            2.1    Study area
direct measurements of changes in permafrost depth or catch-
ment aquifer storage are still difficult to perform at the catch-    The 2645 km2 Yangbajain Catchment in the western part of
ment scale (Xu et al., 2019; Staudinger, 2017; Käser and             the Lhasa River basin (Fig. 1a) lies between the Nyenchen
Hunkeler, 2016). Although their resolution and accuracy are          Tanglha mountain range to the northwest and the Yarlung
relatively low, GRACE data have always been adopted to as-           Tsangpo suture to the south. In the center of the catch-

Hydrol. Earth Syst. Sci., 24, 1145–1157, 2020                                      www.hydrol-earth-syst-sci.net/24/1145/2020/
L. Lin et al.: Understanding the effects of climate warming                                                                    1147

ment, a wide and flat valley (Fig. 1b) with low-lying ter-         2.2     Data
rain and thicker aquifers is in a half-graben fault-depression
basin caused by the Damxung–Yangjain Fault (Wu and Zhao,           Daily streamflow and precipitation data at four hydrological
2006; Yang et al., 2017). As a half-graben system, the north–      stations (Fig. 1a) during the period from 1979 to 2013 are
south trending Damxung–Yangjain Fault (Fig. 1b) provides           adopted to assess the changes in stream flow in a warming
access for groundwater flow as manifested by the widespread        climate. The monthly meteorological data at three weather
distribution of hot springs (Jiang et al., 2016). The surface      stations (Fig. 1a) are obtained from a distributed operational
of the valley is blanketed by Holocene colluvium, which is         system for data sharing operated by the China Meteoro-
filled with thick alluvial–pluvial sediments from the south,       logical Data Service Center (http://data.cma.cn/, last access:
such as gravel, sandy loam and clay. The vegetation in the         20 March 2019) for the years from 1979 to 2013. In this
catchment is characterized by alpine meadow, alpine steppe,        study, the meteorological data extrapolation method from
marsh, and shrub among others, with the meadow and marsh           Prasch et al. (2013) is adopted to obtain the discretized air
mainly distributed in the valley and near the river source         temperature (with a cell size of 1 km ×1 km) of the Lhasa
(Zhang et al., 2010).                                              River basin, based on the air temperature of the three sta-
    Located on the south-central TP, the Yangbajain Catch-         tions and assuming a linear lapse rate. The mean monthly
ment is a glacier-fed headwater catchment with significant         lapse rate is set to 0.44 ◦ C 100 m−1 for elevations below
frozen ground coverage (Fig. 1b, c). A majority of glaciers        4965 m and 0.78 ◦ C 100 m−1 for elevations above 4965 m in
were found along the Nyenchen Tanglha mountain range               the catchment (Wang et al., 2015).
(Fig. 1b). Glaciers cover over 10 % of the whole catchment,           The glacier and frozen ground data are provided by the
making it the most glacierized subbasin in the Lhasa River         Cold and Arid Regions Science Data Center (http://westdc.
basin. According to the First Chinese Glacier Inventory (Mi        westgis.ac.cn/, last access: 15 May 2019). The distribution,
et al., 2002), the total glacier area was about 316.31 km2 in      area and volume of glaciers are based on the First and Sec-
1960. The ablation period of the glaciers ranges from June to      ond Chinese Glacier Inventory in 1960 and 2009, respec-
September with the glacier termini at about 5200 m (Liu et         tively (Mi et al., 2002; Liu et al., 2014; Fig. 1b). The distribu-
al., 2011). According to the new map of the permafrost dis-        tion and classification of frozen ground (Fig. 1c) are collected
tribution on the TP (Zou et al., 2017), the valley is underlain    from the Second Chinese Glacier Inventory maps of frozen
by seasonally frozen ground (Fig. 1c). It is estimated that        ground on the TP (Li and Cheng, 1996; Zou et al., 2017).
seasonally frozen ground and permafrost account for about             The latest Level-3 monthly mascon solutions (CSR, Save
64 % and 36 % of the total catchment area, respectively (Zou       et al., 2016) were used to detect terrestrial water storage
et al., 2017). The lower limit of alpine permafrost is around      (TWS, total vertically integrated water storage) changes for
4800 m, and the thickness of permafrost varies from 5 to           the period from January 2003 to December 2015 with a
100 m (Zhou et al., 2000).                                         spatial sampling resolution of 0.5◦ × 0.5◦ from the Gravity
    The Yangbajain Catchment is characterized by a semiarid        Recovery and Climate Experiment (GRACE) satellite. The
temperate monsoon climate. The areal average annual air            time series from 2003 to 2015 for the snow water equiv-
temperature of the catchment is approximately −2.3 ◦ C, and        alent (SWE) and total soil moisture (SM, layer 0–200 cm)
it varies from −8.6 ◦ C in January to 3.1 ◦ C in July (Fig. 2).    from the GLDAS_Noah2.1 dataset (https://disc.gsfc.nasa.
The average annual precipitation at the Yangbajain Station is      gov/, last access: 16 May 2019) were adopted for derivation
about 427 mm. The catchment experiences a summer (June–            of the groundwater storage (GWS; Richey et al., 2015).
August) monsoon that provides 73 % of the annual precipita-
tion, while the rest of the year is dry with only 1 % of the an-   2.3     Methods
nual precipitation occurring in winter (December–February;
Fig. 2).                                                           2.3.1    Statistical methods for assessing streamflow
    The average annual streamflow at the Yangbajain Station                 changes
is 277.7 mm, and the intra-annual distribution of stream-
flow is uneven (Fig. 2). In summer, streamflow is mainly           The Mann–Kendall (MK) test, which is suitable for data
recharged by monsoonal rainfall and meltwater, and the vol-        with non-normally distributed or nonlinear trends, is applied
ume of summer runoff accounts for approximately 63 %               to detect trends in hydrometeorological time series (Mann,
of the annual streamflow (Fig. 2). The streamflow in win-          1945; Kendall, 1975). To remove the serial correlation from
ter, which only accounts for 4 % of the annual streamflow          the examined time series, a trend-free pre-whitening (TFPW)
(Fig. 2), is only recharged by groundwater, which is greatly       procedure is needed prior to applying the MK test (Yue
affected by the freeze–thaw cycle of the frozen ground and         et al., 2002). A more detailed description of the trend-free
the active layer (Liu et al., 2011).                               pre-whitening (TFPW) approach was provided by Yue et
                                                                   al. (2002).
                                                                      Gray relational analysis aims to find the major climatic or
                                                                   hydrological factors that influence an objective variable (Liu

www.hydrol-earth-syst-sci.net/24/1145/2020/                                       Hydrol. Earth Syst. Sci., 24, 1145–1157, 2020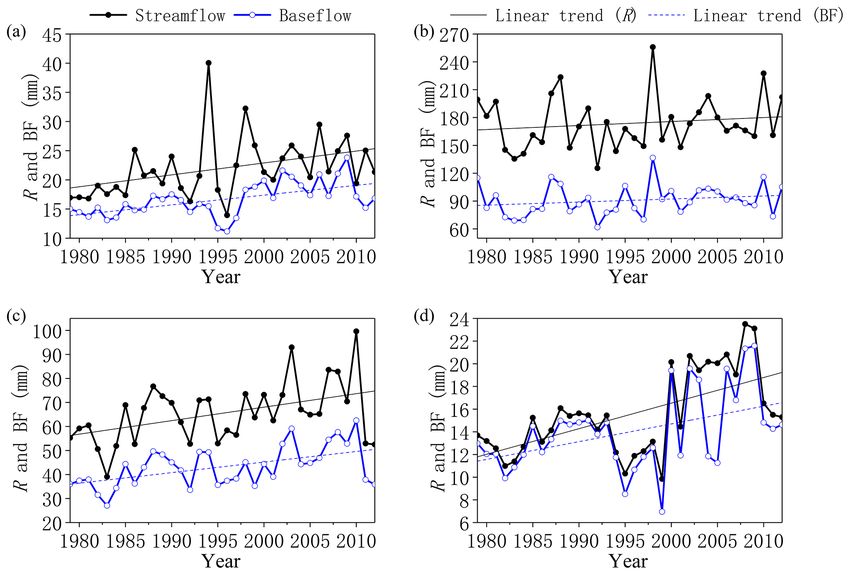
1148 L. Lin et al.: Understanding the effects of climate warming
Figure 1. (a) The location, (b) elevation and glacier distribution from the Second Chinese Glacier Inventory, as only the location of glacier
snouts in 1960 were provided in the First Chinese Glacier Inventory, whereas the boundaries of glaciers were shown in the Second Chinese
Glacier Inventory. (c) Second Chinese Glacier Inventory maps of frozen ground distribution (Li and Cheng, 1996; Zou et al., 2017) in the
Yangbajain Catchment.
Hollick, 1979). The filter equation is expressed as follows:
1+α
qt = αqt−1 + (Qt − Qt−1 ) (1)
2
bt = Qt − qt , (2)
where qt and qt−1 are the filtered quick flow at time step t
and t − 1, respectively; Qt and Qt−1 are the total runoff at
time step t and t − 1; α is the filter parameter that ranging
from 0.9 to 0.95; and bt is the filtered baseflow.
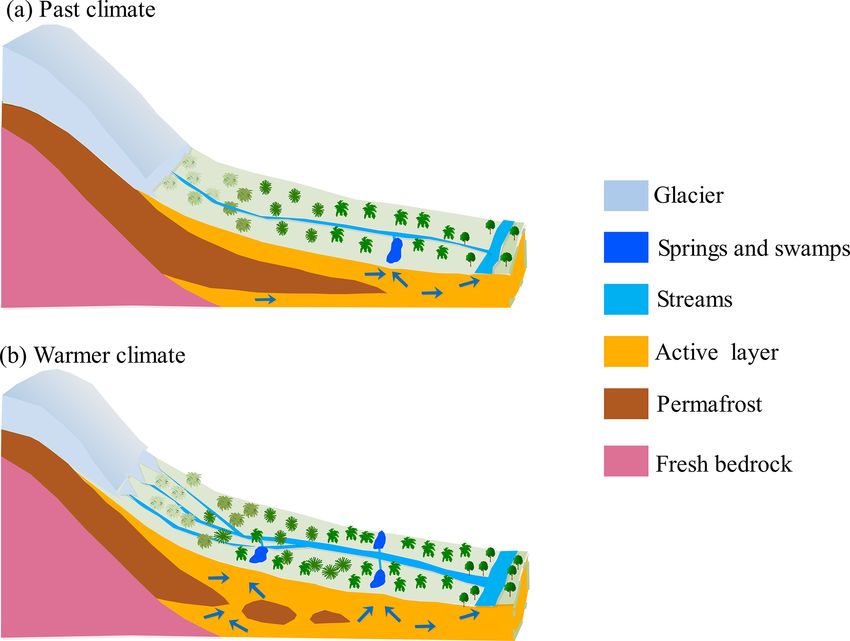
2.3.3 Determination of active groundwater storage
Figure 2. Seasonal variation in streamflow (R), mean air tempera- In this study, the active groundwater storage (abbreviated as
ture (T ) and precipitation (P ) in the Yangbajain Catchment. groundwater storage in the following context) is assumed
to be a storage that directly controls streamflow dynamics
during rainless periods (Kirchner, 2009; Staudinger, 2017).
Based on hydraulic groundwater theory, groundwater stor-
age in a catchment can be approximated as a power function
et al., 2005; Wang et al., 2013). In this paper, gray relational of the baseflow rate at the catchment outlet as follows (Brut-
analysis is used to investigate the main climatic factors im- saert, 2008):
pacting the streamflow changes. S = Ky m , (3)
where y is the rate of baseflow in the stream, and S is the vol-
2.3.2 Baseflow separation ume of active groundwater storage in the catchment aquifers
under climate warming (see in Fig. 3). Here K and m are con-
stants depending on the catchment physical characteristics;
In this paper, the most widely used one-parameter digital fil- K is the baseflow recession coefficient, which represents the
tering algorithm is adopted for baseflow separation (Lyne and timescale of the catchment streamflow recession process.
Hydrol. Earth Syst. Sci., 24, 1145–1157, 2020 www.hydrol-earth-syst-sci.net/24/1145/2020/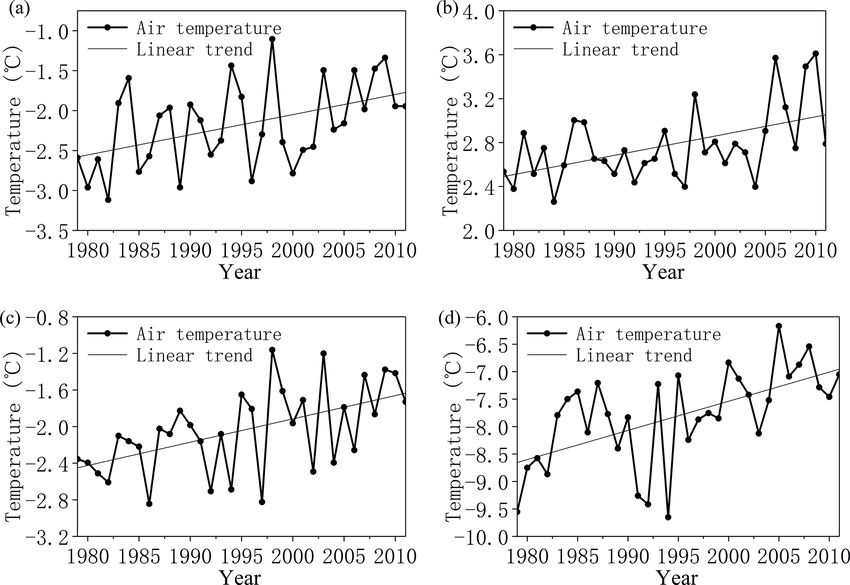
L. Lin et al.: Understanding the effects of climate warming                                                                    1149

                                                                    3     Results

                                                                    3.1    Assessment of streamflow changes

                                                                    The annual streamflow in the Yangbajain Catchment shows
                                                                    an increasing trend at the 5 % significance level with a mean
                                                                    rate of about 12.30 mm per decade over the period from 1979
                                                                    to 2013 (Table 1, Fig. 4a). Meanwhile, the annual mean air
                                                                    temperature exhibits an increasing trend at the 1 % signif-
                                                                    icance level with a mean rate of about 0.28 ◦ C per decade
                                                                    (Table 1, Fig. 5a). However, annual precipitation has a non-
                                                                    significant trend during this period (Table 1, Fig. 5b).
                                                                       As annual streamflow increases significantly, it is neces-
                                                                    sary to analyze the extent to which the changes in the two
                                                                    components (quick flow and baseflow) lead to streamflow in-
                                                                    creases. Based on the baseflow separation method, the annual
                                                                    mean baseflow contributes about 59 % of the annual mean
Figure 3. Diagram depicting the changes in surface water, ground-
water and active groundwater storage due to glacier melt and per-
                                                                    streamflow in the catchment. The MK test shows that annual
mafrost thawing under (a) past climate and (b) a warmer climate.    baseflow exhibits a significant increasing trend at the 1 %
                                                                    significance level with a mean rate of about 10.95 mm per
                                                                    decade over the period from 1979 to 2013 (Table 1, Fig. 4b).
                                                                    However the trend is statistically nonsignificant for annual
  During the dry season, without precipitation and other in-
                                                                    quick flow during the same period (Table 1). The increasing
put events, the conservation of mass equation can be repre-
                                                                    trends between the baseflow and streamflow are very close,
sented as
                                                                    indicating that the increase in baseflow is the main contribu-
dS                                                                  tor to streamflow increases.
   = −y,                                                     (4)       Furthermore, gray relational analysis is applied to the
dt
                                                                    catchment to identify the major climatic factors for the in-
where t is time. The substitution of Eq. (3) into Eq. (4) yields    creasing streamflow. The result shows that the air tempera-
(Brutsaert and Nieber, 1977)                                        ture has a higher gray relational grade at the annual scale
                                                                    (Table 2). This indicates that the air temperature acts as a
    dy                                                              primary factor for the increased streamflow as well as the
−      = ay b ,                                              (5)    baseflow.
    dt
                                                                       The annual streamflow and baseflow significantly increase
where dy/ dt is the temporal change in the baseflow rate dur-       due to the rising air temperature over the period from 1979 to
ing recessions, and the constants a and b are the recession         2013. However, there are diverse intra-annual variation char-
intercept and recession slope of the plots of −dy/ dt versus        acteristics for streamflow as well as the two streamflow com-
y in log–log space, respectively. In the storage–discharge re-      ponents during the period. Streamflow in spring (March to
lationship, the aquifer responds as a linear reservoir if b = 1,    May), fall (September to November) and winter (December
and the aquifer responds as a nonlinear reservoir if b 6 = 1. In    to February) show increasing trends at least at the 5 % signif-
addition, with a fixed slope of b, the changes in the catchment     icance level (Fig. 6a, c and d), while streamflow in summer
aquifer properties due to fitting the intercept a as a variable     (June to August) has a nonsignificant trend during this period
can be observed (Rupp and Selker, 2006).                            (Fig. 6b). Baseflow also increases significantly in spring, fall
   According to Gao et al. (2017), the parameters of K and          and winter (Fig. 6a, c, d). The trend is statistically nonsignif-
m in Eq. (3) can be expressed by a and b, where K =                 icant for baseflow in summer (Fig. 6b). Quick flow exhibits
1/ [a (2 − b)] and m = 2 − b. Furthermore, the constants a          a nonsignificant trend for all seasons (Table 1). As for the
and b can be determined via the recession slope curve tech-         meteorological factors, mean air temperature increases sig-
nique. In this study, the two constants are curve-fitted using      nificantly at the 1 % (significance) level in all seasons, espe-
a nonlinear least squares regression through all of the data        cially during winter with a rate of about 0.51 ◦ C per decade
points of −dy/ dt versus y in log–log space for all years in        (Table 1, Fig. 7), whereas precipitation in each season shows
order to avoid the difficulty of defining a lower envelop of        a nonsignificant trend during these years (Table 1). The gray
the scattered points (Lyon et al., 2009). According to the val-     relational analysis shows that the air temperature is a critical
ues of a and b, K and m can be calculated. Thus, the average        climatic factor with respect to the changes in streamflow and
groundwater storage S for the dry season can be obtained via        baseflow in all seasons (Table 2).
Eq. (3) based on the average baseflow rate.

www.hydrol-earth-syst-sci.net/24/1145/2020/                                         Hydrol. Earth Syst. Sci., 24, 1145–1157, 2020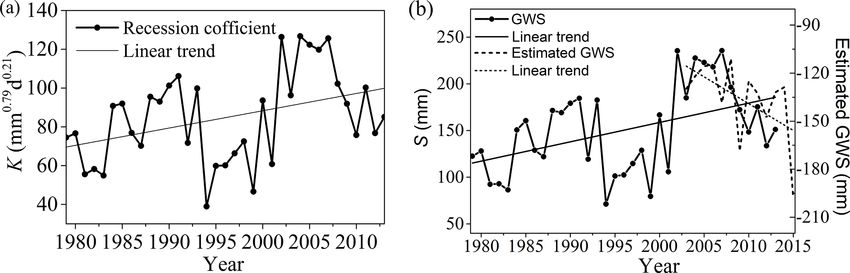
1150                                                                                      L. Lin et al.: Understanding the effects of climate warming

Figure 4. Variations in the annual (a) streamflow and (b) baseflow from 1979 to 2013.

Table 1. Mann–Kendall trend test with trend-free pre-whitening of seasonal and annual mean air temperature (◦ C), precipitation (mm),
streamflow (mm), baseflow (mm) and quick flow (mm) from 1979 to 2013.

                     Air temperature                    Precipitation                     Streamflow                         Baseflow                       Quick flow
                      ZC       β (◦ C a−1 )           ZC       β (mm a−1 )             ZC       β (mm a−1 )             ZC       β (mm a−1 )           ZC       β (mm a−1 )
      Spring      2.73∗∗              0.026        0.90              0.290         3.05∗∗               0.206       2.99∗∗                0.147       0.98              0.042
      Summer      2.63∗∗              0.013        1.30              2.139           0.92               0.549         1.27                0.429       0.50              0.128
      Fall        2.65∗∗              0.024       −0.68             −0.395          2.46∗               0.546       2.96∗∗                0.476       0.80              0.074
      Winter      3.49∗∗              0.051       −0.46             −0.014         3.08∗∗               0.204        2.13∗                0.145       1.39              0.016
      Annual      4.48∗∗              0.028        1.28              2.541          2.07∗               1.230       2.70∗∗                1.095       0.77              0.327
 ZC and β refer to the standardized test statistic and the trend magnitude, respectively; positive values of ZC and β indicate an upward trend, whereas negative values indicate a
 downward trend in the tested time series; “∗ ” and “∗∗ ” denote statistical significance at the 5 % and 1 % significance levels, respectively.

3.2    Estimation of groundwater storage by baseflow                                         1990s, the overall increasing trend of 7.70 (mm0.79 d0.21 ) per
       recession analysis                                                                    decade at a significance level of 5 % is similar to the results
                                                                                             obtained from decadal analysis. This long-term variation in
Daily streamflow and precipitation records in fall and early                                 the recession coefficient K from September to December in-
winter (September to December) were adopted. During this                                     dicates that baseflow recession gradually slows down in the
dry season, the hydrograph usually shows little precipitation                                catchment during fall and early winter.
and declines consecutively and smoothly. The fitted slope b                                     According to the results of the decadal data fit (see in
is equal to 1.79 via the nonlinear least squares fit from Eq. (5)                            Fig. 8), the mean values of groundwater storage S estimated
for all data points of −dy/ dt versus y in log–log space dur-                                for each decade are 130, 148 and 188 mm for the 1980s,
ing the period from 1979 to 2013. Moreover, for each decade                                  1990s and 2000s, respectively. The inter-annual variation in
or year, the intercept a could be fitted by the fixed slope                                  the groundwater storage S is also similar to the recession co-
b = 1.79. The values of K and m for each decade or year                                      efficient K (Fig. 9a, b). The decreasing trend in the anomaly
can then be determined, and the groundwater storage S for                                    changes in groundwater storage (GWS) estimated using the
each year can be directly estimated from the average rate of                                 GRACE data is consistent with the annual trend of S during
baseflow during a recession period using Eq. (3).                                            the 2003–2015 period (Fig. 9b). Furthermore, the reduced
   Figure 8 shows the results of the nonlinear least squares                                 volumes of groundwater between GWS and S are also com-
fit for each decade’s recession data from the 1980s, 1990s                                   parable (∼ 100–120 mm), which has partly verified our esti-
and 2000s, respectively. As shown in Fig. 8, the recession                                   mations.
data points and fitted recession curves of each decade grad-                                    The trend analysis suggests that the groundwater storage S
ually move downward as time goes on. This indicates that,                                    shows an increasing trend at the 5 % significance level with a
with a fixed slope of b, the intercept a gradually decreases                                 rate of about 19.32 mm per decade during the period from
and the recession coefficient K increases accordingly. The                                   1979 to 2013 (Fig. 9b). The annual trend of groundwater
values of the recession coefficient K for each decade are 77,                                storage S from 1979 to 2013 is consistent with the values
84 and 103 mm0.79 d0.21 for the 1980s, 1990s and 2000s, re-                                  across decades. This indicates that groundwater storage has
spectively. Furthermore, Fig. 9a shows the inter-annual vari-                                increased. Through recent field investigations, we know that
ation in the recession coefficient K during the period from                                  the groundwater level is rising. The increases in surface wa-
1979 to 2013. In total, although there are some large fluctu-                                ter and shallow groundwater storage are changing the land
ations or even a rather large decrease at the beginning of the                               cover. For example, the normalized difference vegetation in-

Hydrol. Earth Syst. Sci., 24, 1145–1157, 2020                                                                   www.hydrol-earth-syst-sci.net/24/1145/2020/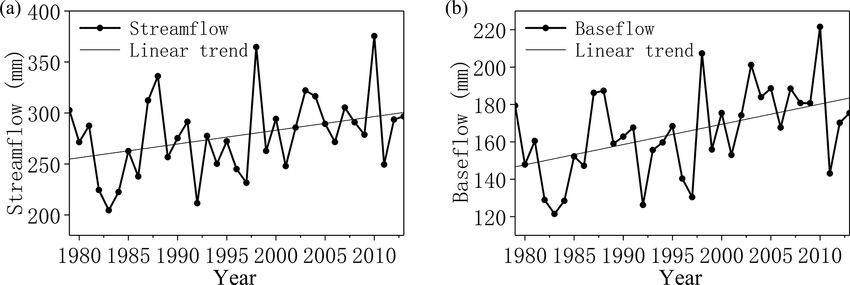
L. Lin et al.: Understanding the effects of climate warming                                                                                      1151

Table 2. Gray relational grades between the streamflow/baseflow and climate factors (Goi ; precipitation and air temperature) in the Yangba-
jain Catchment at both the annual and seasonal scales. Bold text shows the higher gray relational grade in each season.

                                                   Goi with the streamflow                         Goi with the baseflow
                                             Precipitation         Air temperature           Precipitation        Air temperature
                              Spring                   0.690                     0.778                0.713                     0.789
                              Summer                   0.689                     0.784                0.680                     0.776
                              Fall                     0.653                     0.667                0.648                     0.680
                              Winter                   0.742                     0.886                0.748                     0.895
                              Annual                   0.675                     0.727                0.665                     0.729
                            The importance of each influencing factor can be determined by the order of the gray relational grade
                            values. The influencing factor with the largest Goi is regarded as the main stress factor for the objective
                            variable.

Figure 5. Variations in annual (a) mean air temperature and (b) precipitation from 1979 to 2013.

dex (NDVI) has risen accordingly over the past 20 years                               and seasonally frozen ground in each sub-catchment (espe-
(Fig. 10). This rise in the NDVI (or the improvement in the                           cially the Lhasa sub-catchments) are comparable to that in
vegetation conditions) stems from the fact that surface water                         the Yangbajain Catchment; however, the coverage of glaciers
and groundwater storage are increasing due to climate warm-                           in the three catchments is far lower than that in the Yang-
ing – not only in the study area but also across the whole TP                         bajain Catchment according to the First Chinese Glacier In-
(Zhang et al., 2018; Khadka et al., 2018).                                            ventory (Mi et al., 2002; Table 3). The MK test showed that
                                                                                      the annual mean air temperature significantly increased at the
                                                                                      1 % significance level in all the four catchments, whereas the
4   Discussion                                                                        annual precipitation showed nonsignificant trends (Table 4).
                                                                                      The changes in annual streamflow in the Lhasa, Pangdo and
The results have revealed that the increase in streamflow, es-                        Tangga catchments showed nonsignificant trends. The reason
pecially in the dry season, is tightly related to climate warm-                       for this was that all three larger sub-catchments as well as the
ing. It is obvious that both glacier retreat and frozen ground                        whole Lhasa River basin possess relatively lower glacier cov-
degradation in a warmer climate can significantly alter the                           erage compared with the Yangbajain Catchment, and sum-
mechanism of streamflow. In the Yangbajain Catchment as                               mer rainfall contributes 48 % of the total runoff in the three
well as the whole Lhasa River basin, a noticeable glacier re-                         larger sub-catchments and the Lhasa River basin according
treat and frozen ground degradation has been occurring over                           to Guan et al. (1984). However the annual streamflow of
the past few decades (Table 3). For instance, according to                            the Yangbajain Catchment showed an increasing trend in
the Second Glacier Inventory map of frozen ground distri-                             streamflow at the 5 % significance level with a mean rate
bution on the TP (Li and Cheng, 1996; Zou et al., 2017),                              of about 12.30 mm per decade during the study period. Ye
the areal extent of permafrost in the Yangbajain Catchment                            et al. (1999) stated that when glacier coverage is greater
has decreased by 406 km2 (15.3 %) over the past 22 years;                             than 5 %, the glacier contribution to streamflow induced by
the areal extent of seasonal frozen ground has increased by                           climate warming starts to become obvious. As reported by
406 km2 (15.3 %) with the corresponding degradation of per-                           Prasch et al. (2013), the contribution of accelerated glacial
mafrost.                                                                              meltwater to streamflow would cause a significant increase
   According to the new map of the permafrost distribution                            in streamflow in the Yangbajain Catchment. Thus, it is rea-
on the TP (Zou et al., 2017), the coverage of permafrost

www.hydrol-earth-syst-sci.net/24/1145/2020/                                                              Hydrol. Earth Syst. Sci., 24, 1145–1157, 2020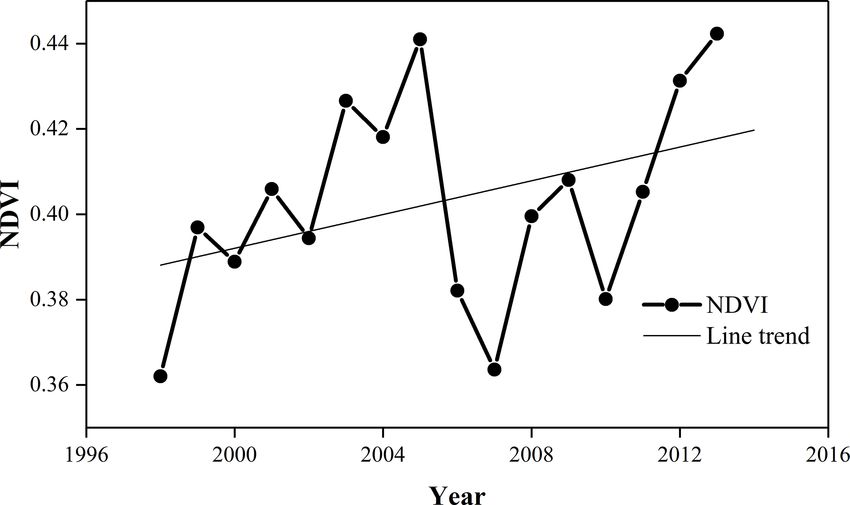
1152                                                                  L. Lin et al.: Understanding the effects of climate warming

Figure 6. Variations in seasonal streamflow and baseflow in (a) spring, (b) summer, (c) fall and (d) winter from 1979 to 2013.

Figure 7. Variations in seasonal mean air temperature in (a) spring, (b) summer, (c) fall and (d) winter from 1979 to 2013.

sonable to attribute annual streamflow increases to the accel-          enlarge groundwater storage capacity (Niu et al., 2016). Fig-
erated glacier retreat as a consequence of increasing annual            ure 3 depicts the changes in surface flow and groundwater
air temperature in the Yangbajain Catchment.                            flow paths in a glacier-fed catchment, which is underlain by
   Although permafrost degradation is not the controlling               frozen ground under past climate and a warmer climate, re-
factor for the increase in streamflow, a rational hypothesis            spectively. As the frozen ground extent continues to decline
is that increased groundwater storage S in fall and early win-          and the active layer thickness continues to increase in the
ter is associated with frozen ground degradation, which can             valley, the increase in the groundwater storage capacity can

Hydrol. Earth Syst. Sci., 24, 1145–1157, 2020                                          www.hydrol-earth-syst-sci.net/24/1145/2020/
L. Lin et al.: Understanding the effects of climate warming                                                                                            1153

Table 3. The coverage of glaciers and frozen ground in four catchments of the Lhasa River basin.

 Stations       Area         Glaciers               Glaciers               Permafrost              Permafrost          Seasonally frozen   Seasonally frozen
               (km2 )        (1960)                 (2009)                   (1996)                  (2017)             ground (1996)       ground (2017)
                         Area    Coverage        Area    Coverage        Area     Coverage       Area     Coverage      Area    Coverage    Area    Coverage
                        (km2 )        (%)       (km2 )        (%)       (km2 )         (%)      (km2 )         (%)     (km2 )        (%)   (km2 )        (%)
 Lhasa        26 233    349.26           1.3   347.14           1.3   10 535            40.2     9783         37.3     15 698       59.8   16 450       62.7
 Pangdo       16 425    345.24           2.1   339.90           2.1    8666             52.7     8242         50.2      7762        47.3    8184        49.8
 Tangga       20 152    348.12           1.7   342.27           1.7   10 081            50.0     9432         46.8     10 071       50.0   10 720       53.2
 Yangbajain    2645     316.31          12.0   278.26          10.5    1352             51.1      946         35.8      1293        48.9    1699        64.2

Table 4. Mann–Kendall trend test with trend-free pre-whitening of annual mean air temperature (◦ C), precipitation (mm) and streamflow
(mm) in four catchments of the Lhasa River basin.

                                                 Air temperature                 Precipitation                Streamflow
                                                  ZC     β (◦ C a−1 )       ZC         β (mm a−1 )          ZC       β (mm a−1 )
                             Lhasa             6.07∗∗           0.028      1.16                1.581      1.09            1.420
                             Pangdo            6.19∗∗           0.026      0.89                1.435      0.30            0.223
                             Tangga            7.35∗∗           0.021      1.48                2.005     −0.62           −0.531
                             Yangbajain        4.48∗∗           0.028      1.28                2.541     2.07∗            1.230

                                                                                      Thus, as a result of climate warming, the river regime
                                                                                   in this catchment has been altered significantly. On the one
                                                                                   hand, permafrost degradation is changing the aquifer struc-
                                                                                   ture that controls the storage–discharge mechanism, e.g. the
                                                                                   catchment groundwater storage increases at about 19.32 mm
                                                                                   per decade; on the other hand, a huge amount of water from
                                                                                   glacier retreat is contributing to the increase in streamflow
                                                                                   and groundwater storage. For example, the annual stream-
                                                                                   flow of the Yangbajain Catchment has been increasing a
                                                                                   mean rate of about 12.30 mm per decade over the past
                                                                                   50 years. However, the total glacial area and volume have
                                                                                   decreased by 38.05 km2 (12.0 %) and 1788 mm (26.2 %), re-
                                                                                   spectively, over the period from 1960 to 2009 (Fig. 11) ac-
                                                                                   cording to the Chinese glacier inventories. Hence, the glacial
                                                                                   volume reduction rate has been 9.46 × 10⁷ m3 a−1 (about
                                                                                   357.7 mm per decade) on average over the past 50 years.
                                                                                   With respect to the ablation on continental-type glaciers in
Figure 8. Recession data points of −dy/ dt versus y as well as the                 China, evaporation (sublimation) always plays an important
fitted recession curves by decade in log–log space. The black dotted               role; however, the annual amount of evaporation is usually
line, the dashed line and the solid line represent the recession curves
                                                                                   less than 30 % of the total ablation of glaciers in the high
in the 1980s, 1990s and 2000s, respectively.
                                                                                   mountains of China (Zhang et al., 1996). Given the 30 % re-
                                                                                   duction in glacial melt, there is still a large water imbalance
provide enough storage space to accommodate the increasing                         between the melt-derived runoff and the actual increase in
meltwater that may percolate into deeper aquifers (Fig. 3).                        runoff and groundwater storage. Our results imply that more
The increase in groundwater storage in fall and early win-                         than 60 % of glacial meltwater would be lost by subsurface
ter then allows more groundwater discharge into streams as                         leakage.
baseflow and lengthens the recession time, as indicated by
the recession coefficient K. This leads to the increased base-
flow and slow baseflow recession in fall and early winter, as                      5    Conclusions
is shown in Figs. 6c, d and 9a. In the late winter and spring,
the increase in baseflow (Fig. 6d, a) can be explained by the                      In this study, changes in hydrometeorological variables were
delayed release of increased groundwater storage.                                  evaluated in order to identify the main climatic factor for

www.hydrol-earth-syst-sci.net/24/1145/2020/                                                            Hydrol. Earth Syst. Sci., 24, 1145–1157, 2020
1154 L. Lin et al.: Understanding the effects of climate warming
Figure 9. Variations in (a) the recession coefficient K and (b) the estimated groundwater storage S from 1979 to 2013 as well as the estimated
groundwater storage changes from 2003 to 2015 from GRACE data.
have decreased by 38.05 km2 (12.0 %) and 4.73 × 10⁹ m3
(26.2 %), respectively between 1960 and 2009, and the areal
extent of permafrost has degraded by 406 km2 (15.3 %) over
the past 22 years. As a result of permafrost degradation,
the groundwater storage capacity has increased, which has
triggered a continuous increase in groundwater storage at a
rate of about 19.32 mm per decade. This can explain why
the baseflow volume increases and baseflow recession slows
down in fall and early winter.
Finally, we find that there is a large water imbalance
(> 5.79 × 10⁷ m3 a−1 ) between the melt-derived runoff and
the actual increase in runoff and groundwater storage, which
suggests that more than 60 % of the reduction in glacial melt
Figure 10. Variations in the annual NDVI from 1998 to 2013 in the should be lost by subsurface leakage. However, the pathway
catchment. of these leakage is still an open question that requires further
study. More methods (e.g. hydrological isotopes) should be
adopted to quantify the contribution of glacial meltwater and
permafrost degradation to streamflow as well as to explore
the change in groundwater storage capacity as frozen ground
continues to degrade.
Code and data availability. The code and data used in this study
are available from Jintao Liu (jtliu@hhu.edu.cn) upon request.
Author contributions. LL and JL provided insights; LL and MG
performed the coding and analysis; LL drafted the paper with con-
tributions from all co-authors. JL and XC collected the data. JL, JW,
Figure 11. The total area and volume of glaciers in the Yangbajain SW and HL contributed to the analysis of the results, the discussion
Catchment in 1960 and 2009. and edited the paper.
streamflow changes in the cryospheric Yangbajain Catch- Competing interests. The authors declare that they have no conflict
ment. We find that the annual streamflow, especially the an- of interest.
nual baseflow, increases significantly, and the rising air tem-
perature acts as a primary factor for the increased runoff. Fur-
thermore, through parallel comparisons of subbasins in the Acknowledgements. We would like to thank the editor,
Lhasa River basin, we presume that the increased streamflow Fuqiang Tian, and the two anonymous reviewers, whose per-
ceptive criticisms, comments and suggestions helped us improve
in the Yangbajain Catchment is mainly fed by glacier retreat.
the quality of the paper.
Due to climate warming, the total glacial area and volume
Hydrol. Earth Syst. Sci., 24, 1145–1157, 2020 www.hydrol-earth-syst-sci.net/24/1145/2020/L. Lin et al.: Understanding the effects of climate warming 1155
Financial support. This work was supported by the Second Tibetan Guan, Z. H., Chen, C. Y., Kuang, Y. X., Fan Y. Q., Zhang, Y. S.,
Plateau Scientific Expedition and Research Program (STEP; Min- Chen, Z. M., Bao, S. H., Zu, Y. T., He, X. W., and Zhang, M.
istry of science and technology, MOST; grant no. 2019QZKK0207), T.: Rivers and Lakes in Tibetan, Science and Technology Press,
the National Natural Science Foundation of China (NSFC; grant Beijing, 1984 (in Chinese).
nos. 91647108 and 91747203), the Science and Technology Pro- Green, T. R., Taniguchi, M., Kooi, H., Gurdak, J. J., Allen,
gram of Tibet Autonomous Region (grant no. 2015XZ01432), the D. M., Hiscock, K. M., Treidel, H., and Aureli, A.:
West Light Foundation of the Chinese Academy of Sciences (grant Beneath the surface of global change: impacts of cli-
no. 29Y929621) and the Special Fund of the State Key Laboratory mate change on groundwater, J. Hydrol., 405, 532–560,
of Hydrology-Water Resources and Hydraulic Engineering (grant https://doi.org/10.1016/j.jhydrol.2011.05.002, 2011.
no. 20185044312). Immerzeel, W. W., van Beek, L. P. H., and Bierkens, M. F. P.: Cli-
mate change will affect the Asian water towers, Science, 328,
1382–1385, 2010.
Review statement. This paper was edited by Fuqiang Tian and re- Jiang, W., Han, Z., Zhang, J., and Jiao, Q.: Stream pro-
viewed by two anonymous referees. file analysis, tectonic geomorphology and neotectonic ac-
tivity of the Damxung-Yangbajain Rift in the south Ti-
betan Plateau, Earth Surf. Proc. Land., 41, 1312–1326,
https://doi.org/10.1002/esp.3899, 2016.
Kang, S. C., Xu, Y. W., You, Q. L., Flügel, W. A., Pepin,
References N., and Yao, T. D.: Review of climate and cryospheric
change in the Tibetan Plateau, Environ. Res. Lett., 5, 015101,
Bense, V. F., Kooi, H., Ferguson, G., and Read, T.: Permafrost https://doi.org/10.1088/1748-9326/5/1/015101, 2010.
degradation as a control on hydrogeological regime shifts Käser, D. and Hunkeler, D.: Contribution of alluvial groundwater to
in a warming climate, J. Geophys. Res.-Earth, 117, F03036, the outflow of mountainous catchments, Water Resour. Res., 52,
https://doi.org/10.1029/2011JF002143, 2012. 680–697, https://doi.org/10.1002/2014WR016730, 2016.
Bibi, S., Wang, L., Li, X. P., Zhou, J., Chen, D. L., and Yao, T. D.: Kendall, M. G.: Rank Correlation Methods, 4th ed., Charles Griffin,
Climatic and associated cryospheric, biospheric, and hydrologi- London, 196 pp., 1975.
cal changes on the Tibetan Plateau: A review, Int. J. Climatol., Khadka, N., Zhang, G., and Thakuri, S.: Glacial Lakes in the
38, e1–e17, https://doi.org/10.1002/joc.5411, 2018. Nepal Himalaya: Inventory and Decadal Dynamics (1977–2017),
Brutsaert, W.: Long-term groundwater storage trends estimated Remote Sensing, 10, 1913, https://doi.org/10.3390/rs10121913,
from streamflow records: Climatic perspective, Water Resour. 2018.
Res., 44, 114–125, https://doi.org/10.1029/2007WR006518, Kirchner, J. W.: Catchments as simple dynamical systems:
2008. catchment characterization, rainfall-runoff modeling, and do-
Brutsaert, W. and Nieber, J. L.: Regionalized drought flow hydro- ing hydrology backward, Water Resour. Res., 45, W02429,
graphs from a mature glaciated plateau, Water Resour. Res., 13, https://doi.org/10.1029/2008WR006912, 2009.
637–643, 1977. Kooi, H., Ferguson, G., and Bense, V. F.: Evolution of shallow
Buttle, J. M.: Mediating stream baseflow response to climate groundwater flow systems in areas of degrading permafrost, Geo-
change: the role of basin storage, Hydrol. Process., 32, 363–378, phys. Res. Lett., 36, 297–304, 2009.
https://doi.org/10.1002/hyp.11418, 2017. Li, S. and Cheng, G.: Map of Frozen Ground on Qinghai-Xizang
Chapman, T.: A comparison of algorithms for stream flow recession Plateau, Gansu Culture Press, Lanzhou, 1996.
and baseflow separation, Hydrol. Process., 13, 701–714, 1999. Li, Z. J., Li, Z. X., Song, L. L., Ma, J. Z., and Song Y.: Environ-
Cheng, G. D. and Wu, T. H.: Responses of permafrost ment significance and hydrochemical characteristics of suprap-
to climate change and their environmental significance, ermafrost water in the source region of the Yangtze River, Sci.
Qinghai-Tibet Plateau, J. Geophys. Res.-Earth, 112, F02S03, Total Environ., 644, 1141–1151, 2018.
https://doi.org/10.1029/2006JF000631, 2007. Lin, K. T. and Yeh, H. F.: Baseflow recession characterization and
Cuo, L., Zhang, Y. X., Zhu, F. X., and Liang, L. Q.: Characteris- groundwater storage trends in northern Taiwan, Hydrol. Res., 48,
tics and changes of streamflow on the Tibetan Plateau: A review, 1745–1756, 2017.
J. Hydrol., 2, 49–68, https://doi.org/10.1016/j.ejrh.2014.08.004, Liu, J. S., Xie, J., Gong, T. L., Wang, D., and Xie, Y. H.: Impacts
2014. of winter warming and permafrost degradation on water vari-
Duan, L., Man, X., Kurylyk, B. L., and Cai, T.: Increasing ability, upper Lhasa River, Tibet, Quatern. Int., 244, 178–184,
winter baseflow in response to permafrost thaw and pre- https://doi.org/10.1016/j.quaint.2010.12.018, 2011.
cipitation regime shifts in northeastern China, Water, 9, 25, Liu, J. T., Han, X. L., Chen, X., Lin, H., and Wang, A.
https://doi.org/10.3390/w9010025, 2017. H.: How well can the subsurface storage-discharge rela-
Gao, M., Chen, X., Liu, J., Zhang, Z., and Cheng, Q.: Using tion be interpreted and predicted using the geometric fac-
two parallel linear reservoirs to express multiple relations of tors in headwater areas?, Hydrol. Process., 30, 4826–4840,
power-law recession curves, J. Hydrol. Eng., 22, 04017013, https://doi.org/10.1002/hyp.10958, 2016.
https://doi.org/10.1061/(ASCE)HE.1943-5584.0001518, 2017. Liu, Q. Q, Singh, V. P., and Xiang, H.: Plot erosion model using
Ge, S., McKenzie, J., Voss, C., and Wu, Q.: Exchange of ground- gray relational analysis method, J. Hydrol. Eng., 10, 288–294,
water and surface-water mediated by permafrost response to sea- 2005.
sonal and long term air temperature variation, Geophys. Res.
Lett., 38, L14402, https://doi.org/10.1029/2011GL047911, 2011.
www.hydrol-earth-syst-sci.net/24/1145/2020/ Hydrol. Earth Syst. Sci., 24, 1145–1157, 20201156 L. Lin et al.: Understanding the effects of climate warming Liu, S. Y., Guo, W., Xu, J. L., Wu, L. Z., Yao, X. J., Wei, J. F., tion with elevation, Hydrol. Process., 31, 2000–2015, and Shangguan, D. Y.: The Second Glacier Inventory Dataset of https://doi.org/10.1002/hyp.11158, 2017. China (Version 1.0), Cold and Arid Regions Science Data Center Su, F., Zhang, L., Ou, T., Chen, D., Yao, T., Tong, K., and Qi, Y.: Hy- at Lanzhou, https://doi.org/10.3972/glacier.001.2013.db, 2014. drological response to future climate changes for the major up- Liu, X. D. and Chen, B. D.: Climatic warming in the Tibetan Plateau stream river basins in the Tibetan Plateau, Global Planet. Change, during recent decades, Int. J. Climatol., 20, 1729–1742, 2000. 136, 82–95, https://doi.org/10.1016/j.gloplacha.2015.10.012, Lyne, V. and Hollick, M.: Stochastic time-variable rainfall-runoff 2016. modeling, Aust. Natl. Conf. Publ., 89–93, 1979. Viviroli, D., Dürr, H. H., Messerli, B., Meybeck, M., and Wein- Lyon, S. W. and Destouni, G.: Changes in catchment-scale re- gartner, R.: Mountains of the world, water towers for humanity: cession flow properties in response to permafrost thawing Typology, mapping, and global significance, Water Resour. Res., in the Yukon River basin, Int. J. Climatol., 30, 2138–2145, 43, W07447, https://doi.org/10.1029/2006WR005653, 2007. https://doi.org/10.1002/joc.1993, 2010. Walvoord, M. A. and Kurylyk, B. L.: Hydrologic impacts of Lyon, S. W., Destouni, G., Giesler, R., Humborg, C., Mörth, thawing permafrost – A review, Vadose Zone J., 15, 1–20, M., Seibert, J., Karlsson, J., and Troch, P. A.: Estimation of https://doi.org/10.2136/vzj2016.01.0010, 2016. permafrost thawing rates in a sub-arctic catchment using re- Walvoord, M. A. and Striegl, R. G.: Increased groundwa- cession flow analysis, Hydrol. Earth Syst. Sci., 13, 595–604, ter to stream discharge from permafrost thawing in the https://doi.org/10.5194/hess-13-595-2009, 2009. Yukon River basin: Potential impacts on lateral export of Mann, H.: Non-parametric test against trend, Econometrica, 13, carbon and nitrogen, Geophys. Res. Lett., 34, 123–134, 245–259, 1945. https://doi.org/10.1029/2007GL030216, 2007. Mi, D. S., Xie, Z. C., and Luo, X. R.: Glacier Inventory of China Wang, G., Mao, T., Chang, J., Song, C., and Huang, K.: Processes (volume XI: Ganga River drainage basin and volume XII: In- of runoff generation operating during the spring and autumn sea- dus River drainage basin). Xi’an Cartographic Publishing House, sons in a permafrost catchment on semi-arid plateaus, J. Hydrol., Xi’an, 292–317, 2002 (in Chinese). 550, 307–317, 2017. Niu, L., Ye, B. S., Li, J., and Sheng, Y.: Effect of permafrost degra- Wang, S., Liu, S. X., Mo, X. G., Peng, B., Qiu, J. X., Li, M. X., dation on hydrological processes in typical basins with various Liu, C. M., Wang, Z. G., and Bauer-Gottwein, P.: Evaluation of permafrost coverage in western China, Sci. China Earth Sci., 54, remotely sensed precipitation and its performance for streamflow 615–624, https://doi.org/10.1007/s11430-010-4073-1, 2011. simulations in basins of the southeast Tibetan Plateau, J. Hy- Niu, L., Ye, B., Ding, Y., Li, J., Zhang, Y., Sheng, Y., and Yue, G.: drometeorol., 16, 342–354, https://doi.org/10.1175/JHM-D-14- Response of hydrological processes to permafrost degradation 0166.1, 2015. from 1980 to 2009 in the upper Yellow River basin, China, Hy- Wang, W. F., Wu, T. H., Zhao, L., Li R., Zhu X. F., Wang, W. R., drol. Res., 47, 1014–1024, https://doi.org/10.2166/nh.2016.096, Yang, S. H., Qin, Y. H., and Hao, J. M.: Exploring the ground 2016. ice recharge near permafrost table on the central Qinghai-Tibet Patnaik, S., Biswal, B., Kumar, D. N., and Sivakumar, B.: Regional Plateau using chemical and isotopic data, J. Hydrol., 560, 220– variation of recession flow power-law exponent, Hydrol. Pro- 229, 2018. cess., 32, 866–872, 2018. Wang, Y. F., Shen, Y. J., Chen, Y. N., and Guo, Y.: Vegetation dy- Prasch, M., Mauser, W., and Weber, M.: Quantifying present namics and their response to hydroclimatic factors in the Tarim and future glacier melt-water contribution to runoff in a River Basin, China, Ecohydrology, 6, 927–936, 2013. central Himalayan river basin, The Cryosphere, 7, 889–904, Wang, Y. H., Yang, H. B., Gao, B., Wang, T. H., Qin, Y., and Yang, https://doi.org/10.5194/tc-7-889-2013, 2013. D. W.: Frozen ground degradation may reduce future runoff in Pritchard, H. D.: Asia’s glaciers are a regionally im- the headwaters of an inland river on the northeastern Tibetan portant buffer against drought, Nature, 545, 169–174, Plateau, J. Hydrol., 564, 1153–1164, 2018. https://doi.org/10.1038/nature22062, 2017. Wittenberg, H.: Baseflow recession and recharge as nonlinear stor- Richey, A. S., Thomas, B. F., Lo, M.-H., Reager, J. T., Famiglietti, J. age processes, Hydrol. Process., 13, 715–726, 1999. S., Voss, K., Swenson, S., and Rodell, M.: Quantifying renewable Woo, M. K., Kane, D. L., Carey, S. K., and Yang, D.: Progress groundwater stress with GRACE, Water Resour. Res., 51, 5217– in permafrost hydrology in the new millennium, Permafrost 5238, https://doi.org/10.1002/2015WR017349, 2015. Periglac., 19, 237–254, https://doi.org/10.1002/ppp.613, 2008. Rogger, M., Chirico, G. B., Hausmann, H., Krainer, K., Wu, Q. B. and Zhang, T. J.: Recent permafrost warming on Brückl, E. , Stadler, P., and Blöschl, G.: Impact of moun- the Qinghai-Tibetan Plateau, J. Geophys. Res.-Atmos., 113, tain permafrost on flow path and runoff response in a D13108, https://doi.org/10.1029/2007JD009539, 2008. high alpine catchment, Water Resour. Res., 53, 1288–1308, Wu, Z. H. and Zhao, X. T.: Quaternary geology and faulting in the https://doi.org/10.1002/2016WR019341, 2017. Damxung-Yangbajain Basin, southern Tibet, Journal of Geome- Rupp, D. E. and Selker, J. S.: Information, artifacts, and noise in chanics, 12, 305–316, 2006 (in Chinese). dQ/dt-Q recession analysis, Adv. Water Resour., 29, 154–160, Xu, M., Kang, S., Wang, X., Pepin, N., and Wu H.: Un- 2006. derstanding changes in the water budget driven by climate Save, H., Bettadpur, S., and Tapley, B. D.: High-resolution CSR change in cryospheric-dominated watershed of the northeast GRACE RL05 masons, J. Geophys. Res.-Sol. Ea., 121, 7547– Tibetan Plateau, China, Hydrol. Process., 33, 1040–1058, 7569, doi.org/10.1002/2016JB013007, 2016. https://doi.org/10.1002/hyp.13383, 2019. Staudinger, M., Stoelzle, M., Seeger, S., Seibert, J., Weiler, Yang, G., Lei, D., Hu, Q., Cai, Y., and Wu, J.: Cumulative coulomb M., and Stahl, K.: Catchment water storage varia- stress changes in the basin-range region of Gulu-Damxung- Hydrol. Earth Syst. Sci., 24, 1145–1157, 2020 www.hydrol-earth-syst-sci.net/24/1145/2020/
L. Lin et al.: Understanding the effects of climate warming                                                                             1157

  Yangbajain and their effects on strong earthquakes, Electronic          Zhang, Y. L., Wang, C. L., Bai, W. Q., Wang, Z. F., Tu, Y. L., and
  Journal of Geotechnical Engineering, 22, 1523–1530, 2017.                 Yangjaen, D. G.: Alpine wetland in the Lhasa River Basin, China,
Yao, T. D., Wang, Y. Q., Liu, S. Y., Pu, J. C., Shen, Y. P., and Lu, A.     J. Geogr. Sci., 20, 375–388, 2010 (in Chinese).
  X.: Recent glacial retreat in high Asia in China and its impact on      Zhang, Z. X., Chang, J., Xu, C. Y., Zhou, Y., Wu, Y. H., Chen, X.,
  water resource in northwest China, Science in China, 47, 1065–            Jiang, S. S., and Duan, Z.: The response of lake area and vegeta-
  1075, https://doi.org/10.1360/03yd0256, 2004.                             tion cover variations to climate change over the Qinghai-Tibetan
Yao, T. D., Pu, J. C., Lu, A. X., Wang, Y. Q., and Yu, W. S.: Recent        Plateau during the past 30 years, Sci. Total Environ., 635, 443–
  glacial retreat and its impact on hydrological processes on the           451, 2018.
  Tibetan Plateau, China, and surrounding regions, Arct. Antarct.         Zhou, Y. W., Guo, D. X., Qiu, G. Q., Cheng, G. D., and Li, S.
  Alpine Res., 39, 642–650, 2007.                                           D.: Permafrost in China, Science Press, Beijing, 63–70, 2000 (in
Ye, B. S., Han, T. D., and Ding, Y. J.: Some Changing Charac-               Chinese).
  teristics of Glacier Streamflow in Northwest China, J. Glaciol.         Zou, D., Zhao, L., Sheng, Y., Chen, J., Hu, G., Wu, T., Wu, J., Xie,
  Geocryology, 21, 54–58, 1999 (in Chinese).                                C., Wu, X., Pang, Q., Wang, W., Du, E., Li, W., Liu, G., Li, J.,
Yue, S., Pilon, P., Phinney, B., and Cavadias, G.: The in-                  Qin, Y., Qiao, Y., Wang, Z., Shi, J., and Cheng, G.: A new map of
  fluence of autocorrelation on the ability to detect trend                 permafrost distribution on the Tibetan Plateau, The Cryosphere,
  in hydrological series, Hydrol. Process., 16, 1807–1829,                  11, 2527–2542, https://doi.org/10.5194/tc-11-2527-2017, 2017.
  https://doi.org/10.1002/hyp.1095, 2002.
Zhang, Y., Yao, T. D., and Pu, J. C.: The characteristics of ablation
  on continental-type glaciers in China, Journal of Glaciology and
  Geocryology, 18, 147–154, 1996 (in Chinese).

www.hydrol-earth-syst-sci.net/24/1145/2020/                                             Hydrol. Earth Syst. Sci., 24, 1145–1157, 2020
You can also read