An integer programming model for the selection of pumped-hydro storage projects
←
→
Page content transcription
If your browser does not render page correctly, please read the page content below
PSR technical reports

                                           An integer programming model for the selection of pumped-hydro
                                           storage projects

                                           Tiago Andrade · Rafael Kelman · Tainá M. Cunha ·
                                           Luiz Rodolpho de Albuquerque · Rodrigo F. Calili

                                           April 20, 2020
arXiv:2007.16036v1 [math.OC] 31 Jul 2020

                                           Abstract The seasonal and variable electricity production of renewable sources, such as wind and
                                           solar power, needs to be compensated by resources that can guarantee a reliable supply of power at all
                                           times. As the penetration of variable renewable energy increases globally for economic reasons, so do
                                           the requirements for additional sources of flexible operation. The permanent balance between demand
                                           and supply of electricity is one of the reasons of the increased interest on energy storage systems in
                                           recent years. By far, the largest technology used globally to this end is Pump Hydro Storage (PHS)
                                           because of the fast response of power, large storage capacity and competitiveness. PHS project are
                                           highly site specific, and the selection and design of these projects is critical. In this article, an integer
                                           programming problem is formulated for their siting and sizing. The approach is to select grid cells
                                           from a Digital Elevation Model (DEM) that will conform reservoirs of PHS to meet minimum storage
                                           requirements. The objective function includes the costs of embankments, water conveyance systems,
                                           and electromechanical equipment. The model can be executed for different instances of DEM, and the
                                           best local solutions can be aggregated to provide regional or national requirements of power systems.
                                           Keywords pumped-hydro storage · integer programming · geographic information system · digital
                                           elevation model · renewable energy.

                                           1 Introduction

                                           At this time the world faces the dual challenge of increasing the availability of electrical energy while
                                           reaching toward a zero-carbon future in a way that minimizes any negative social and environmental
                                           impacts. The debate in the electrical power sector has taken a sharp turn recently. It is now about how
                                           fast carbon emissions can be reduced entirely, and how to do it. It is no longer relevant whether it is
                                           realistic, or even necessary, to slow the emission of greenhouse gases, and whether much of the world
                                           outside the developed countries could afford it. The conversation now is about the energy transition,
                                           from a hydrocarbon economy to a no-carbon one [1].
                                               The contribution of Variable Renewable Electricity (VRE), such as wind and solar photovoltaic
                                           projects, is increasing worldwide due to favorable conditions such as economic performance and re-
                                           source availability [2, 3]. Technically gas fired plants could provide capacity to supply peak demand
                                           T. Andrade, R. Kelman, T. M. Cunha, L. R. Albuquerque are with PSR at:
                                           Praia de Botafogo, 370 - Botafogo, Rio de Janeiro - RJ, 22250-040, Brazil
                                           Tel.: +55-21-3906-2100
                                           R. f. Calili is with PUC-Rio at:
                                           Marqus de So Vicente, 225 - Gvea, Rio de Janeiro - RJ, 22451-900, Brazil
                                           The authors would like to thank EDF, CTG, Brookfield and Light for jointly supporting and funding this research as
                                           part of a R&D project. The project is supervised by ANEEL - the Brazilian electricity regulator.
                                           The authors would also like to thank former consultant and chairman of the board of The Nature Conservancy, Mr.
                                           David Harrison, for his insights and comments.
                                           Corresponding author e-mail: tiago.andrade@psr-inc.com
2 Tiago Andrade et al.
and reserves, but at the expense of increasing the emission of greenhouse gases. While conventional
hydropower can also support the growth of VRE in power systems, concerns related to their socio-
environmental impacts often make this alternative less appealing. The most competitive alternative
is another hydraulic flexible resource: Pumped Hydropower Storage (PHS) [4, 5]. From 1960 to 1990,
PHS development was mainly used to provide a flexible generation in systems with large share of base
loaded nuclear or coal power in Europe, United States and Japan. More recently, the renewed interest
on PHS is as a flexible renewable resource with several possible roles in more diversified electricity
matrices, mostly in the USA, European countries and China [2, 6].
Energy storage can support energy security and climate change challenges by providing valuable
benefits in power systems [7]. As the cost of emerging technologies decreases, storage will become
even more competitive. Meanwhile, the range of economical services granted by such solution will
expand [8]. Compared to other energy storage technologies, PHS offers a longer service life, comparable
efficiency, good response time, an ability to follow load changes, maintain frequency and support voltage
stability [9]. Its operation is characterized by the pumping of water from a lower reservoir or river for
storage into an upper reservoir during low demand period to produce electricity during high demand
period. These systems can operate under different topologies, such as connecting existing reservoirs
or construction of two new closed-loop reservoirs (e.g. with no water influxes in either end) [10].
The principal issue, however, is that PHS is highly site-specific and feasibility depends greatly on
topographic and geologic variables of each potential project.
Most of the published works dealing with the search for pumped storage sites are based on the
guidelines of a workshop organized by the Institute for Energy and Transport (IET) of the Joint Re-
search Center (JRC). The discussions were consolidated in a technical report [11], that proposes general
criteria considering the use of GIS-based tools and variables such as: the dimensions of existing or new
reservoirs, the distance between potential reservoirs or other bodies of water, the head provided by the
difference in water level between the two identified locations, the average slope of the land surface, the
proximity to the electrical and the road network, in addition to socio-environmental impacts.
Studies developed after this workshop examine specific topologies (Table 1), adapting the reference
values indicated by the EIT to the characteristics of the chosen region and the extent of the assessment
in spatial terms (local, regional, national or integrated system). These peculiarities define the scope
of the search for potential locations in different studies, generally, limiting it to a given plant size,
associated with the dimensions of the upper reservoir and a specific operating cycle.
Table 1 PHS Topologies
Topology Description
T1 Two existing reservoirs linked with one or several penstocks with a
powerhouse to transform them to a PHS scheme
T2 One existing lake or reservoir linked to a new reservoir built on a flat area,
with excavation and embankments, on a depression or in a valley
T3 A greenfield PHS with new reservoirs built in valleys, closed by dams,
depressions or hill tops
T4 Sea based PHS, in which the sea can be used as the lower reservoir
combined with a new one or an upper basin with a cavern as a lower reservoir
T5 Multi-reservoir systems combining PHS and conventional plants
T6 Scheme with a large river that can provide enough inflow for the PHS system
used as the lower reservoir
T7 Use of an abandoned mine pit as a reservoir as in a T2 scheme
Another usual classification comes from a water resources management perspective. Closed-loop
systems, where neither reservoir is part of a river course, correspond to the T3 type. In semi-open
systems, one of the reservoirs (frequently the lower one) is part of a water body, such as in T2, T4 and
T6. Open systems have both reservoirs as part of a river course.
In 2012, a study in the Turkish territory [12] was based on an algorithm that seeks an upper reservoir
to maximize the head between the two sites in a circular search region of 5 km surrounding an existing
reservoir (T2 type). It also limited the search of the second reservoir to flat surfaces, considering thatAn integer programming model for the selection of pumped-hydro storage projects 3
strongly sloped areas increase the complexity of the construction. A minimum reservoir area of 70 ha
was considered, with 20 ha corresponding to civil structures and other components. Candidate sites
were then ranked by energy storage capacity, in GWh, and the site of highest capacity related to an
existing reservoir was selected.
SINTEF Energy Research developed a tool in 2013 [13] to identify pumped-storage plants in Norway
considering a pair of existing reservoirs (T1 type) and using a combination GIS resources and Python
language. It defined a methodology built in 3 stages: topographic analysis, calculation of selection
methods and choice of locations. The first step calculates the nearest distance between two existing sites
and applies some geographic restrictions that are complemented by infrastructure and environmental
proximity analysis in the second stage. For the selection of sites, three screening modes were defined,
each one with a different parameter (power production, in MW, storage duration, in days, and water
level change rate, in m/hour).
Recent studies explored other possibilities using GIS tools. In 2017, an investigation of pumped
storage sites in Tibet [14] searched for topology types T1 and T2 in a region with transmission network
distant from potential sites. In the case of T2, the methodology takes advantage of a Multiple Ring
Buffer tool around the existing site to intersect drainage lines while assuming a pyramidal geometry
for the upper reservoir.
A French screening [15], also carried out in 2017, added to these two types of scheme the closed cycle
one (T3) to find small plants. This study establishes a method equivalent to the one applied in Norway.
This paper considers that the small-PHS scheme can involve only two reservoirs that cannot be linked
more than once. A model was solved to obtain non-interconnected pairings as a multidimensional as an
knapsack problem. The strategy aimed at the definition of the maximum water flow for each connection
and selects the pairs of reservoirs with higher head, as it can provide more installed capacity.
In 2018, researchers carried out a broad study for Iran [16], covering the topologies T1, T2, T4
and T6 using GIS tools combined with multicriteria analysis. Using spatial raster tools, the study
considers the head (H), conveyance length-head ratio (L/H) and slope of ground surface, beyond
other parameters, such as geological conditions, to select the best sites.
An Australian research [17] conducted in the same year a worldwide survey to identify type T3
plants (closed-loop system), involving advanced geoprocessing algorithms considering two types of up-
per reservoir: dry-gully (DG), which seeks to close a topographic saddle with a dam in a mountainous
topography, and turkey’s nest (NT), which are equivalent to huge artificial pools, requiring the em-
bankments in all its contour. This study resulted in an interesting search tool [18], available for free
on the internet. For DG schemes, it calculates the storage capacity of the reservoirs and the required
earthwork to build a dam. It uses a raster watershed model from which a flow direction raster is derived.
Within this watershed, dam wall heights are created to define the reservoirs, avoiding steep terrains by
the exclusion of pour points located on a slope greater than 1:5. The dam contour is defined from the
common cells of the watershed and its corresponding flooded areas. In TN schemes, it assumes that
the soils or rocks required to build the dam are obtained from excavation within the reservoir area and
hence adds half of the dam volume to the total volume of reservoir. It uses also a simplified form of
dam volume calculation, in which freeboard and dam crest width are not considered.
A GIS software named STORES was then developed using Python scripts comprising functional
modules to exclude the regions without enough height within an acceptable distance (minimum H/L
ratio of 1:10), identify DG and TN sites within the highlighted areas and optimize the site selection.
In this study, a ratio between the water storage capacity (W ) divided by the earthwork required to
build such a reservoir/ dam capable of this storage capacity (R) was used to select optimal sites, while
cost models are not integrated in it.
Lately, a group of researchers developed a methodology to estimate the global pumped storage
potential considering T6 schemes (open system) for a reservoir operation to regulate river flows through
a reduction of seasonality and inter-annual variations [19]. The screening begins by examining rivers
with reasonable flow rate, being no more than 30 km away from an existing reservoir. Then, it verifies
if a dam can be built around this area in a so-called Point Under Analysis (PUA), testing four cardinal
orientations. Usually located in a tributary river, from this PUA, the model considers five heights (from
50m to 250m, at 50 m intervals), before removing projects with competing dams. Finding the flooded4 Tiago Andrade et al.
side of the dam, it creates the reservoir and calculates its volume, limited as 11% of the annual river
flow. Next, it compares its size with the water available for storage. Finally, it estimates the costs of
the main components of the pumped storage (dam, tunnel, turbine, generator, excavation and land)
and its water and energy storage costs for further comparison. The cost estimate is based on charts of
a technical manual published by the Norwegian Water Resources and Energy Directorate [20].
While these references cover a large spectrum of applications using different topologies, none of
them translates the identification of hot spots into a mathematical formulation that incorporates the
major cost components of PHS. To our knowledge this is the first work with this approach. It uses
a DEM to identify reservoirs that meet given storage targets while minimizing embankment, water
conveyance and E&M costs. The approach can be used after existing references identify hot-spots.
The aim of this work is to determine the least-cost location and shape of an upper reservoir, as
in Figure 1 considering a minimum volume requirement and an existing lower reservoir or water body
(lake or river), using an integer programming approach.
Fig. 1 shape example in a grid
The integer programming problem formulation and solution methods are described in section 2.
In section 3, the PHS siting and sizing formulation was applied to determine the upper reservoir to
be formed on the hillside next to the existing lower reservoir of the Sobradinho hydropower plant.
Section 4 presents the modeling results. Finally, section 5 presents the conclusion of this work and
future related opportunities.
2 Proposed formulation
2.1 Basic problem
An integer programming model is proposed for the PHS siting. Binary variables represent grid cells of
line i and column j that are part of the reservoir perimeter xi,j , its interior yi,j , or both zi,j .
Cells allowed to take part of the reservoir are limited by its perimeter, as seen by constraints (1)-(4).
zi,j ≤ xi,j + zi−1,j ∀i, j (1)
zi,j ≤ xi,j + zi+1,j ∀i, j (2)
zi,j ≤ xi,j + zi,j−1 ∀i, j (3)
zi,j ≤ xi,j + zi,j+1 ∀i, j (4)
Constraints (5) and (6) indicate cells that must be in the reservoir given the perimeter.
xi,j ≤ zi,j ∀i, j (5)
xi,j ≤ zi−1,j + zi+1,j + zi,j−1 + zi,j+1 ∀i, j (6)An integer programming model for the selection of pumped-hydro storage projects 5
Constraints (7) to (11) define interior cells from perimeter and reservoir cells.
zi,j = xi,j + yi,j ∀i, j (7)
yi,j ≤ zi−1,j ∀i, j (8)
yi,j ≤ zi+1,j ∀i, j (9)
yi,j ≤ zi,j−1 ∀i, j (10)
yi,j ≤ zi,j+1 ∀i, j (11)
The minimum volume required is represented by constraint (12).
X
yi,j (H − hi,j )AreaCell ≥ V olM in (12)
i,j
Where H is a fixed (given) water elevation, hi,j is terrain elevation of cell, AreaCell is the area in
each cell, and V olM in is the minimum volume required.
The addition of variables and constraints is implicit in the problem formulation. To illustrate, the
interior variable yi,j is only defined for cells which hi,j ≤ H. Moreover, there are some redundant
constraints to accelerate the mixed integer solver.
2.2 Avoiding disconnected reservoirs
2.2.1 Traveling salesman problem constraints
The basic problem formulation can generate multiple disconnected upper reservoirs, as subtours of the
traveling salesman problem (TSP) [21]. To avoid this, TSP constraints are added using a modified
Miller-Tucker-Zemlin formulation are represented by constraints (13)-(19).
wi,j,h,k ∈ {0, 1} ∀i, j, h, k (13)
+
ui,j ∈ Z ∀i, j (14)
X
0 ≤ ui,j ≤ xh,k − 1 ∀i, j (15)
h,k
0 ≤ ui,j ≤ xi,j ∀i, j (16)
X
wi,j,h,k = xi,j ∀i, j (17)
h,k
X
wh,k,i,j = xi,j ∀i, j (18)
h,k
X X
ui,j − uh,k + ( xa,b )wi,j,h,k ≤ xa,b − 1 ∀i, j, h, k (19)
a,b a,b
The modification is that neither the vertex nor theP number of vertexes of the graph are an input to
the problem. They are decided by variables xi,j and i,j xi,j respectively. Binary variable wi,j,h,k is
activated when an edge connects cells (i, j) to (h, k). This can only happen if these cells are neighbors,
which requires examining all possible directions. This is not made explicit in the formulation to avoid
heavy notation. Therefore, the reader should consider that variables and constraints generations are
implicit. Variable ui,j is an auxiliary variable to eliminate subtours.
It is important to remark that constraint (19) that eliminates subtour in our version of Miller-
Tucker-Zemlin formulation contains products of variables. Fortunately, they are products of binary
variables, and therefore, linearizable.6 Tiago Andrade et al.
2.2.2 Separating planes
Separating planes can be used to avoid solutions with unconnected reservoirs. If each reservoir were
convex, there would no reason for concern. Since that is not the case, they can be used as a tentative
to find a quick solution. With a bit of luck, the reservoir will be a connected set. If this is not the case,
TSP no-subtour constraints must be added to the model as well. Formulation for the horizontal and
vertical planes is presented by Constraints (20)-(29).
upi ∈ {0, 1} ∀i (20)
downi ∈ {0, 1} ∀i (21)
lef tj ∈ {0, 1} ∀j (22)
rightj ∈ {0, 1} ∀j (23)
X
1− yi,j ≤ upi + downi ∀i (24)
j
X
1− yi,j ≤ lef tj + rightj ∀j (25)
i
X
yk,j ≤ M (1 − downi ) ∀i (26)
k>i,j
X
yk,j ≤ M (1 − upi ) ∀i (27)
kj
X
yi,k ≤ M (1 − rightj ) ∀j (29)
i,kAn integer programming model for the selection of pumped-hydro storage projects 7
2.3 Objective function
The three most important cost factors related to PHS facilities in a given location are: (i) construction
of embankments; (ii) water conveyance system; (iii) E&M equipment ce&m .
Embankments are built to enclose water in reservoirs, avoid seepage whenever the elevation of the
terrain in the perimeter of the reservoir is lower than the water elevation. A trapezoidal cross section
can be used considering a certain reference width for the crest of the embankment and reference slopes
that depend on the embankment material (e.g. a right trapezoid if concrete with a downstream slope
of 1V: 0.75H or a isosceles trapezoid with slopes around 1V:2H in case of earth-fill section).
The cost of water conveyance between the planned upper reservoir and an existing lower reservoir
(or river) in the vicinity varies with its length (being a tunnel or a penstock) and the water flow, which
increases with the PHS capacity (MW) and decreases with the water head.
The third cost component is related to E&M equipment. A unit cost can be used ($/kW ) as
a function of water head because unit costs tend to decrease for higher heads because the size of
turbines, generators, pumps, etc. is reduced while its rotational speed increases.
2.3.1 Embankment cost
Assuming a trapezoidal cross-section cost of embankments with a 10m width at the crest and a
horizontal : vertical slope of 2:1 for both faces, the cost per cell is given by the cell length of the
DEM (Lc) multiplied by the cost of the cross-section, and the unit cost of embankment ($/m3 ), i.e.,
cei,j = Lc(2.5(H − hi,j ) + 0.5(H − hi,j )2 ) if H is lower than the terrain elevation of cell (i, j) and zero
otherwise.
Note that, in reality, the length and volume, and thus the cost, of the embankment necessary to
connect two cells in a diagonal is greater than the values necessary to connect in vertically or hori-
zontally. Auxiliary variables are introduced in the problem to correct this difference in cost. However,
they are omitted in the formulation presented here for the sake of simplicity.
2.3.2 Water conveyance
Water conveyance cost is given by water flow Q = V olM in/∆t. Where V olM in is the desired target
volume, and ∆t is the time it takes to fill up or empty the reservoir. Thus, Q is the desired flow rate.
Additionally, for each possible perimeter cell, one can compute the minimum length Li,j that links it
to the other reservoir or river (in the dimensional space) as a pre-processing step prior to optimization.
Since, one cannot know which perimeter cell will be connected to the other reservoir or river, a decision
link variable is added to the model by adding constraints (30)-(32).
li,j ∈ {0, 1} ∀i, j (30)
li,j ≤ xi,j ∀i, j (31)
X
li,j = 1 (32)
i,j
The water conveyance cost is given by two terms: (i) tunnel excavation and treatment; (ii) tunnel
lining. The first term is given by a unit cost (e.g. $40/m3 ) x length Li,j (m) x cross section Ai,j
(m2 ). The later is given by the ratio of the water flow Q(m3 /s) and a maximum admissible velocity
(e.g. 4m/s). Altogether, the first component can be represented by cex i,j = 10QLi,j .The tunnel lining
cost is given by the unit cost of steel (e.g. $2.5/kg) x total weight (kg). Total weight is given by the
specific weight of steel (7840kg/m3 ) x volume of steel used (m3 ), which is the tunnel thickness (e.g.
20mm) x perimeter (i.e. π x diameter Di,j ) x length. If, as before, a maximum admissible velocity
is used (e.g. 6 m/s) then Q(m3 /s) = 6Ai,j = 6πDi,j 2
/4. Therefore, the diameter is given by Di,j =
p
2Q/3π. If steel lining
p is assumed to be used in 1/3 of the total tunnel length, then the cost is
√
2.5 × 7840 × 0.020 × π 2Q/3π × Li,j /3. At last, the lining cost estimate is cli,j = 190 QLi,j8 Tiago Andrade et al.
2.3.3 Equipment costs
Because the obective of the model is to screen PHS in multiple locations, a general function is used
to estimate total E&M costs. It was derived using a symbolic regression tool based on the Differ-
entiable Genetic Cartesian Programming (dCGP) from the European Space Agency (ESA) [22, 23]
with a dataset constructed with the use of Brazilian Inventory Manual for conventional hydropower
projects [24] for various combinations of water heads, flows and installed capacities.
Worksheets are used in planning and inventory studies to calculate the main dimensions of each
hydropower structure and estimate equipment unit costs based on Eletrobras database. They were
used to prepare a dataset of total costs for 54 pairs of the following key variables: installed capacity
(P, in MW) and hydraulic head (H, in meters). Francis turbines were considered, respecting ranges
for P and H. Given that the reference costs were for conventional hydropower, they were increased by
20% to consider PHS particularities.
The machine learning tool dCGP performed a symbolic regression over this dataset, in order to
define a simple, yet sensible, component of the objective function that captures the main drivers of
total equipment costs and is comparable for multiple locations. The equation selected by the tool was
3068 8608
ce&m = √ + and the final objective function given by (33).
H P
X X
min cei,j xi,j + (cex l
i,j + ci,j )li,j + c
e&m
P (33)
i,j|H>hi,j i,j
While the first two terms of the objective are intrinsically related the problem formulation, the
third component is a constant for a given pair of P, H. Other cost factors, such as grid connections
and access roads can be also considered to compare different alternative sites. Thus, the screening of
the best projects consists in solving the optimization problem for different pairs of P, H and selecting
alternatives with smallest overall costs.
2.4 Solution strategies
Due to the computation burden of solving a potentially large mixed integer programming (MIP)
problem, two strategies are proposed. The first is to simplify the problem by solving first a simplified
version of the problem, where only part of the disconnected reservoir constraints are active. If there is
only one reservoir, it is best to stop. If not, the alternative is activate the others constraints and try
again. The second is to aggregate cells and solve a smaller approximated problem, then, this solution
can be used to help solving the larger problem.
2.4.1 Disconnected reservoirs strategy
The different forms of avoiding unconnected reservoirs can be viewed as layers of defense. A possible
strategy is to try to solve the problem without any additional constraints. If the solution is not feasible,
one can activate the levels of defense in the following recommended order:
1. with horizontal and vertical separating planes
2. with horizontal, vertical, and diagonal separating planes
3. with no-subtour TSP constraints
2.4.2 Zoom in heuristic
The problem size (number of variables and constraints) is proportional to n2 , where n2 is the number
of cells in a terrain with n × n cells. Thus, if the DEM has a fine resolution, it may be computationally
intensive to solve the original problem and makes sense to simplify the grid by aggregating individual
cells into larger ones. The zoom in strategy starts with fewer cells, solves the problem, clips the terrain
around the encountered reservoir, increases the precision (reducing cell aggregation) and solves it again.
The process is repeated until the finer resolution is achieved (i.e. no aggregation).An integer programming model for the selection of pumped-hydro storage projects 9
2.5 Other considerations
There may be cells in the grid that cannot be used due to environmental or any other legal reasons.
This can be easily incorporated in the formulation by logically removing these variables from it.
A drawback of the formulation is that it contains a product of variables in the TSP constraints.
This can be resolved by linearizing the product between binary variables or imposing an upper limit
in the number of reservoir perimeter. The latter option can be used to reformulate constraint (19) by
using a big-M instead of the variable products, which appear to be the better option since a natural
big-M is the number of squares in the grid. Moreover, the TSP constraints are usually not needed,
only the separating planes are enough.
3 Case study
The PHS siting formulation was applied to determine the upper reservoir to be formed on the hillside
next to the existing (lower) reservoir of the Brazilian Sobradinho hydropower plant. The selected area,
known as Saco do Arara had been originally identified as a promising site by former consultant and
chairman of the board of The Nature Conservancy, David Harrison [1], for the following reasons: (i)
the proximity with Sobradinho dam decreases costs of connecting the PHS to the power grid; (ii)
Sobradinho is a large reservoir with nearly constant water level in a short-term PHS operation; (iii)
the elevation of the upper reservoir is at least 150m higher than Sobradinho and the distance between
the two reservoirs is not very large. All these factor contribute to reducing water conveyance and E&M
equipment costs; (iv) apparent socio-environmental impacts are also small.
A field trip to Saco do Arara was made with strong local support by Chesf, the utility that operates
Sobradinho and other dams in the So Francisco river of Brazil totalling more than 10 thousand MW
in capacity. This support was crucial in terms of logistics given the difficult access to Saco do Arara
site. This this field trip confirmed the favorable impression before it was held.
A DEM of the region with cells with 34m x 34m from NASA’s STRM database was considered. It
is a square with 266 cells per side (≈ 9km). From the 70,756 cells of the DEM a total of 19,755 cells
(28%) are part of the Sobradinho reservoir, with an elevation of 385m in the DEM.
In this study we consider a PHS project with 500 MW of capacity (roughly 50% of Sobradinho’s
own capacity) and a storage requirement for 3 hours of operation at this capacity. We also run a
sensitivity with a larger stored energy capacity for 12 hours of operation.
The PHS siting model is executed for three given water heads: 150m, 175m and 200m. In order to
identify the effect of the “zoom in” solution approach, it will be compared with the direct execution
of the model (e.g. no heuristic), where variables and constraints of the problem are generated directly
for the resolution of the DEM, with no aggregation.
Because of the combinatorial nature of the problem, the execution may be interrupted - and the
best solution so far found exhibited - if the elapsed time reaches the maximum allowed time of 1h.
A total of 9 cases are investigated, as shown in Table 2. The computational experiments were done
in a i7-8550@1.8GHz with 16 GB, the time limit was 1 hour for all experiments. The models was
implemented in Julia [25] using JuMP [26], and the MIP solver used was Xpress 8.5 [27].
They combine those three water heads (150m, 175m and 200m), the use of the zoom in heuristic
and the required operation time of the PHS: 3h in cases 1-6 (a period associated with peak electricity
prices) and 12h in cases 7-9 (a sensitivity to understand the impact on costs of a significant increase
in the amount of stored energy).
The last column of Table 2 shows the required storage in hm3 . First, it is determined finding
the turbined/pumped water flow (m3 /s) calculated from the installed capacity and water head, using
representative efficiencies, and then multiplying this flow by the duration of the required operation.
Notice the reduction of required storage with an increase of head because the turbined/pumped flow
is reduced for the same capacity.
PHS siting cases 1-3 reached the optimum solution. For the remaining cases, the best result found
during the allowed computation time is exhibited. Case 6 did not provide a feasible answer within the
allowed time of 1 hour. Results of the execution of the PHS siting model are shown in Table 3, which is10 Tiago Andrade et al.
Table 2 Input data
Case Head (m) Zoom in Operation (h) Storage (hm3 )
1 150 yes 3 5.50
2 175 yes 3 4.72
3 200 yes 3 4.13
4 150 no 3 5.50
5 175 no 3 4.72
6 200 no 3 4.13
7 150 yes 12 22.02
8 175 yes 12 18.87
9 200 yes 12 16.51
divided into two main groups: key figures for the reservoirs (storage, flooded area and smallest distance
to Sobradinho) and constructed embankments (length and volume).
Table 3 PHS siting results: physical properties
Reservoir Embankment
Case Storage (hm3 ) Area (ha) Distance (m) Length (m) Volume (hm3 )
1 5.56 22 2729 614 2.02
2 6.79 109 1124 1380 0.26
3 4.13 53 1206 1451 0.53
4 5.51 13 589 1973 9.51
5 4.73 17 719 2280 11.76
6 - - - - -
7 22.02 86 2729 2828 6.30
8 24.39 252 886 1651 0.56
9 16.51 137 959 2383 1.55
The first column shows the storage (in million m3 ) of the upper reservoir. Notice how these values
compare with last column of Table 2). In most cases the value is nearly the same, meaning that an
increase in storage would increase the project cost. The solution of Case 8, however, has a surplus of
energy storage of 5.53 hm3 = 24.39 - 18.87.
Fig. 3 PHS siting optimal reservoirsAn integer programming model for the selection of pumped-hydro storage projects 11
4 Discussion
An examination of Table 4 shows that costs decrease with head not only due to equipment but also, at
least in the case study, due to cost savings in the construction of embankments and water conveyance
systems. The most important term is the E&M equipment cost - which is not being modeled explicitly
in the problem, but through the screening process.
It is interesting to compare the solutions of cases 1-3 with the best feasible solutions (not optimum)
found for cases 4-6 because the problems are the same, the difference is just the solution strategy. The
comparison of costs is made directly from Table 4. Results indicate the effectiveness of the zoom in
strategy. Case 2, for instance, was $55 million cheaper than Case 5. It is also interesting to compare
solutions for 3h and 12h of storage. Case 3 and Case 9 can be used for that matter. Notice how they
use the same approximate location and how the solution of Case 9 contains that of Case 3. The storage
difference is 16.51 - 4.13 = 12.38 hm3 and the cost increase $131 - $128 = $3 million. Thus, the
incremental cost of storage is 3/12.38 ≈ 0.24/m3 , which translates into $0.5/kWh of storage. This
value is two to three orders of magnitude cheaper than the present costs of Lithium-Ion batteries.
This low incremental storage costs is typical of PHS projects. This raises the following question:
how much storage should one select? The actual target must come from top-down studies [1] that
investigate the role of PHS in the power systems to provide support for variable renewable energy
sources, such as wind power and solar photovoltaic, to reduce the need to expand transmission lines
for energy imports in some areas of the grid, or others grid-dependent economic benefits.
Table 4 PHS siting: Costs ($ Millions)
Case Embankment Water Conveyance E&M Equipment Total
1 10 22 134 166
2 1 8 125 134
3 3 8 117 128
4 48 5 134 187
5 59 5 125 189
6 - - - -
7 31 22 134 187
8 3 6 125 134
9 8 6 117 131
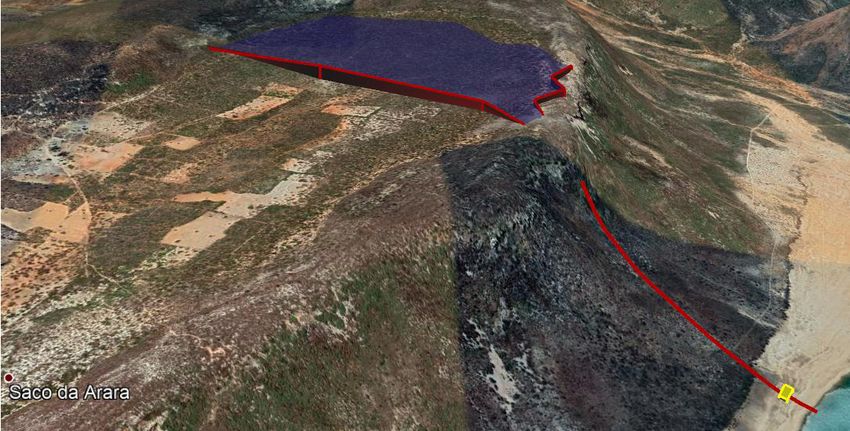
Fig. 4 South facing Google Earth scheme of Case 9 with Sobradinho reservoir at lower right near the powerhouse.12 Tiago Andrade et al.
5 Conclusions and future works
Given the seasonal and variable electricity production of renewable sources, and the interest of main-
taining a balance between supply and demand, energy storage strategies can be included as a resource
in integrated planning studies of power systems. By far, the largest technology used globally to this
end is PHS because of the fast response of power, relatively large storage capacity and economic
competitiveness.
The contribution of this paper is the formulation of a PHS siting model composed of two main
parts. In the first one, it was shown how constraints determine the reservoir which must meet a given
target storage. In the second part, different solution strategies were discussed to eliminate unconnected
reservoirs from the solution.
Further research can be developed to facilitate a step of this PHS screening process, prior to the
optimization model developed here. This first screening should identify bow-shaped locations in larger
areas to reduce the terrain area that is inputted in the model. Siting model using modern computational
techniques in GIS-based environments as some references mentioned in this paper will work well to
this end.
A case study for the Saco do Arara site was conducted by changing key parameters in the PHS siting
model, and maintaining the digital elevation model. This can be interpreted as a bottom-up approach
where to define competitive PHS projects. The model is run several times for different locations based
on local DEMs that were, themselves, the result of the application filters on much larger areas as
described in references to find hot spots.
Optimum solutions are found and the best results, when various locations are considered, must
together meet grid requirements coming from the top-down approach based, for instance, on the results
of an integrated resource planning model.
A possible future development is integrate this formulation with a top-down approach that de-
termines targets for energy storage based on an integrated planning of the power systems. Another
possibility is to integrate the model with a more elaborate engineering design module to improve the
cost estimates. This approach is similar to the approach used in the Brazilian Inventory Manual. Fi-
nally the model could be deployed in GIS-based platforms, as in the case of STORES, to facilitate the
visualization and interpretation of the model results.
Finally, the model can be expanded to incorporate social and environmental aspects, as well as
geological information and any other relevant factors. Such factors could be added directly to the
problem formulation either as new or revised cost components of the problem objective or as a means
to implicit remove (thus simplify) variables and constraints of parts of the terrain (DEM) that do not
meet certain criteria related, for instance, to socio-environmental impacts or geological formations. In
this sense the presented formulation is, by no means, a black box. On the contrary, it can be adapted
and enhanced to meet new requirements.
References
1. R. Kelman and D. L. Harrison, “Integrating Renewables with Pumped Hydro Storage in Brazil: a Case Study”,
Jun. 2019, working paper or preprint. [Online]. Available: https://hal.archives-ouvertes.fr/hal-02147740
2. E. Barbour, I. G. Wilson, J. Radcliffe, Y. Ding, and Y. Li, “A review of pumped hydro energy storage development
in significant international electricity markets”, Renewable and Sustainable Energy Reviews, vol. 61, pp. 421 – 432,
2016. [Online]. Available: http://www.sciencedirect.com/science/article/pii/S1364032116300363
3. D. Connolly, H. Lund, and B. Mathiesen, “Smart Energy Europe: The technical and economic impact of one potential
100% renewable energy scenario for the european union”, Renewable and Sustainable Energy Reviews, vol. 60, pp.
1634–1653, 07 2016.
4. M. Guittet, M. Capezzali, L. Gaudard, F. Romerio, F. Vuille, and F. Avellan, “Study of the drivers and asset
management of pumped-storage power plants historical and geographical perspective”, Energy, vol. 111, pp. 560 –
579, 2016. [Online]. Available: http://www.sciencedirect.com/science/article/pii/S0360544216304583
5. M. Rogner and N. Troja, “The worlds water battery: Pumped hydropower storage and the clean energy transition”,
IHA International Hydropower Association, Working paper, 2018.
6. S. Zhang, P. Andrews-Speed, and P. Perera, “The evolving policy regime for pumped storage hydroelectricity in
China: A key support for low-carbon energy”, Applied Energy, vol. 150, 07 2015.
7. M. Lott, S.-I. Kim, C. Tam, D. Elzinga, S. Heinen, L. Munuera, and U. Remme, Technology Roadmap: Energy
storage. IEA International Energy Agency, 03 2014.An integer programming model for the selection of pumped-hydro storage projects 13
8. P. Ralon, M. Taylor, A. Ilas, H. Diaz-Bone, and K. Kairies, “Electricity storage and renewables: Costs and markets
to 2030”, International Renewable Energy Agency: Abu Dhabi, United Arab Emirates, 2017.
9. S. Rehman, L. M. Al-Hadhrami, and M. M. Alam, “Pumped hydro energy storage system: A technological
review”, Renewable and Sustainable Energy Reviews, vol. 44, pp. 586 – 598, 2015. [Online]. Available:
http://www.sciencedirect.com/science/article/pii/S1364032115000106
10. A. Botterud, T. Levin, and V. Koritarov, “Pumped storage hydropower: benefits for grid reliability and integration
of variable renewable energy”, Argonne National Lab.(ANL), Argonne, IL (United States), Tech. Rep., 8 2014.
11. R. L. Arntegui and E. Tzimas, “Setis expert workshop on the assessment of the potential of pumped hydropower
storage”, Institute for Energy and Transport, Joint Research Center, European Commission, Scientific and technical
research, 2012.
12. N. Fitzgerald, R. L. Arntegui, E. McKeogh, and P. Leahy, “A GIS-based model to calculate the
potential for transforming conventional hydropower schemes and non-hydro reservoirs to pumped hydropower
schemes”, Energy, vol. 41, no. 1, pp. 483 – 490, 2012, 23rd International Conference on Efficiency, Cost,
Optimization, Simulation and Environmental Impact of Energy Systems, ECOS 2010. [Online]. Available:
http://www.sciencedirect.com/science/article/pii/S0360544212001399
13. P. Zinke and F. Arnesen, “GIS-based mapping of potential pump storage sites in Norway: description of the tool
and first results of the analysis”, SINTEF Energy Research, Energy Systems, Technical report, 2013.
14. X. Lu and S. Wang, “A GIS-based assessment of Tibet’s potential for pumped hydropower energy
storage”, Renewable and Sustainable Energy Reviews, vol. 69, pp. 1045 – 1054, 2017. [Online]. Available:
http://www.sciencedirect.com/science/article/pii/S1364032116305809
15. A. Rogeau, R. Girard, and G. Kariniotakis, “A generic GIS-based method for small pumped hydro energy storage
(phes) potential evaluation at large scale”, Applied Energy, vol. 197, pp. 241 – 253, 2017. [Online]. Available:
http://www.sciencedirect.com/science/article/pii/S0306261917303410
16. N. Ghorbani, H. Makian, and C. Breyer, “A GIS-based method to identify potential sites for pumped
hydro energy storage - case of iran”, Energy, vol. 169, pp. 854 – 867, 2019. [Online]. Available:
http://www.sciencedirect.com/science/article/pii/S0360544218324393
17. B. Lu, M. Stocks, A. Blakers, and K. Anderson, “Geographic information system algorithms to locate prospective
sites for pumped hydro energy storage”, Applied Energy, vol. 222, pp. 300 – 312, 2018. [Online]. Available:
http://www.sciencedirect.com/science/article/pii/S0306261918305270
18. ARENA - Australian Renewable Energy Agency. (2019) AREMI software. Australian Renewable Energy. Mapping
Infrastructure. [Online]. Available: https://nationalmap.gov.au/renewables/#share=s-oDPMo1jDBBtwBNhD
19. J. D. Hunt, E. Byers, Y. Wada, S. Parkinson, D. E. H. J. Gernaat, S. Langan, D. P. van Vuuren, and
K. Riahi, “Global resource potential of seasonal pumped hydropower storage for energy and water storage”, Nature
Communications, vol. 11, p. 947, 2020. [Online]. Available: https://www.nature.com/articles/s41467-020-14555-y
20. SWECO Norge AS, “Cost base for hydropower plants (with a generating capacity of more than 10,000 kw)”,
Norwegian Water Resources and Energy Directorate - NVE, Technical manual, 2012.
21. C. E. Miller, A. W. Tucker, and R. A. Zemlin, “Integer programming formulation of traveling salesman problems”,
Journal of the ACM (JACM), vol. 7, no. 4, pp. 326–329, 1960.
22. European Space Agency ESA. (2020) Differentiable Genetic Cartesian Programming (dCGP). [Online]. Available:
https://esa.github.io/dcgp-web/
23. D. Izzo, F. Biscani, and A. Mereta, “Differentiable genetic programming”, CoRR, vol. abs/1611.04766, 2016.
[Online]. Available: http://arxiv.org/abs/1611.04766
24. MME, “Manual for hydropower inventory studies of river basins”, Ministry of Mines and Energy. Secretariat of
Energy Planning and Development. Electric Energy Research Center, Technical manual, 2007, English edition:
2010.
25. J. Bezanson, A. Edelman, S. Karpinski, and V. B. Shah, “Julia: A fresh approach to numerical computing”, SIAM
review, vol. 59, no. 1, pp. 65–98, 2017. [Online]. Available: https://doi.org/10.1137/141000671
26. I. Dunning, J. Huchette, and M. Lubin, “Jump: A modeling language for mathematical optimization”, SIAM Review,
vol. 59, no. 2, pp. 295–320, 2017.
27. F. I. Corporation, “Xpress optimizer reference manual”, 2009.You can also read