Experimental demonstration of the novel "van Hove integral method (vHI)" for measuring diffusive dynamics by elastic neutron scattering
←
→
Page content transcription
If your browser does not render page correctly, please read the page content below
www.nature.com/scientificreports
OPEN Experimental demonstration
of the novel “van‑Hove integral
method (vHI)” for measuring
diffusive dynamics by elastic
neutron scattering
Antonio Benedetto1,2,3,4* & Gordon J. Kearley1,5
Quasi-elastic neutron scattering (QENS)—based on the seminal work of Nobel Laureate Brockhouse—
has been one of the major methods for studying pico-second to nano-second diffusive dynamics over
the past 70 years. This is regarded as an “inelastic” method for dynamics. In contrast, we recently
proposed a new neutron-scattering method for dynamics, which uses the elastic line of the scattering
to access system dynamics directly in the time domain (Benedetto and Kearley in Sci Rep 9:11284,
2019). This new method has been denoted “vHI” that stands for “van Hove Integral”. The reason
is that, under certain conditions, the measured elastic intensity corresponds to the running-time
integral of the intermediate scattering function, I(Q, t), up to a time that is inversely proportional to
the energy band-width incident on the sample. As a result, I(Q, t) is accessed from the time derivative
of the measured vHI profile. vHI has been supported by numerical and Monte-Carlo simulations, but
has been difficult to validate experimentally due to the lack of a suitable instrument. Here we show
that vHI works in practice, which we achieved by using a simple modification to the standard QENS
backscattering spectrometer methodology. Basically, we varied the neutron-energy band-widths
incident at the sample via a step-wise variation of the frequency of the monochromator Doppler-drive.
This provides a measurement of the vHI profile at the detectors. The same instrument and sample
were also used in standard QENS mode for comparison. The intermediate scattering functions, I(Q, t),
obtained by the two methods—vHI and QENS—are strikingly similar providing a direct experimental
validation of the vHI method. Perhaps surprisingly, the counting statistics of the two methods are
comparable even though the instrument used was expressly designed for QENS. This shows that the
methodology modification adopted here can be used in practice to access vHI profiles at many of the
backscattering spectrometers worldwide. We also show that partial integrations of the measured
QENS spectrum cannot provide the vHI profile, which clarifies a common misconception. At the same
time, we show a novel approach which does access I(Q, t) from QENS spectra.
Pico-to-nanoseconds dynamical processes play a key role in nanotechnology and living systems. For example, in
biophysics, the dynamics of enzymes and phospholipids play an important role in their biochemical f unction1–4.
As a result, several methods have been developed and optimized over the last century to access these systems’
dynamics5–10. Among those, neutron-scattering approaches, in particular, have a few unique a dvantages11–19.
These include (i) the ability of neutrons to interact directly with the nuclei of the atoms, which also facilitates
comparison with molecular dynamics simulations; (ii) sensitivity to light atoms, particularly hydrogen; (iii) abil-
ity to distinguish between isotopes, and (iv) an innate molecular spatial resolution. Among neutron techniques,
quasi-elastic neutron scattering (QENS) is the major approach for diffusive d ynamics20–24. QENS instruments
1
School of Physics, University College Dublin, Dublin 4, Ireland. 2Conway Institute, University College Dublin,
Dublin 4, Ireland. 3Department of Sciences, University of Roma Tre, Rome, Italy. 4Laboratory for Neutron
Scattering, Paul Scherrer Institute, Villigen, Switzerland. 5School of Chemistry, University College Dublin, Dublin 4,
Ireland. *email: antonio.benedetto@ucd.ie
Scientific Reports | (2021) 11:14093 | https://doi.org/10.1038/s41598-021-93463-7 1
Vol.:(0123456789)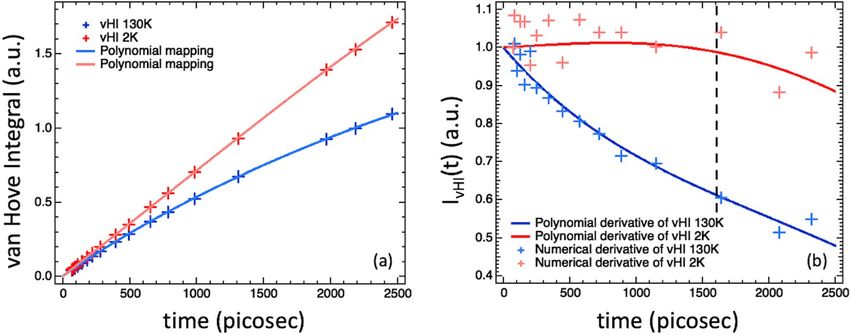
www.nature.com/scientificreports/
Figure 1. System (a) characteristic-time and (b) characteristic-energy landscapes for diffusive processes with
the associated distribution functions linked together by FT operations. The characteristic time of a system
relaxation process, tobs, is inversely proportional to the characteristic energy, E.
are found at every neutron scattering large scale f acility25–40, serving a large and heterogeneous scientific com-
munity of u sers41–60.
At atomic and molecular level, the dynamical information can be mathematically represented by time-
dependent probability-distribution f unctions61. The self (or autocorrelation) distribution function, g(r, t), rep-
resents the probability that a particle composing the system—e.g. one of its atoms—moves by a distance r in a
time t, and it is the one used to describe diffusion-type processes of interest here. Its spatial Fourier transform
(FT) gives the intermediate scattering function, I(Q, t), and its spatial-time-FT gives the scattering function,
S(Q, E), that is normally measured in inelastic and quasi-elastic scattering. In a scattering process, the E value
is the energy transfer, E = ω , with ω being the Fourier inverse variable of t. The Q value, instead, is associated
with the momentum transfer; it represents the Fourier inverse variable of r and is related to the scattering angle.
I(Q, t) and S(Q, E) clearly contain the same system-dynamics information, and theoretically one can be obtained
from the other by FT, as sketched in Fig. 1. However, with the finite limitations of practical measurements, the
time and the energy (or frequency) points-of-views are not equivalent in experiments. This is because the FT
operation needs to use all the t-points to get each individual E-point, and correspondingly, all the E-points are
required to compute the I(Q, t) at each single t-point. Crucially, the aim of many experiments for dynamics is
access to access I(Q, t), but only S(Q, E) is actually measured.
QENS, based on the seminal work of Brockhouse62, measures the distribution of the energy-exchanges
between the neutron and the sample over a range of different scattering angles. This distribution is known
as “QENS spectrum” and usually is referred to as the “measured scattering function, SR (Q, E)”. The accessible
energy-exchange, ranging from tens of micro-eV to hundreds of milli-eV, depends on several instrumental
features. The information on the diffusive dynamics is contained in the spectral profile around the zero-energy
exchange value—known as the elastic line—rather than in inelastic features. SR (Q, E) is the convolution of the sys-
tem scattering function, S(Q, E), with the instrumental energy resolution function, R(Q, E). R(Q, E) contains the
instrumental distortions and limits the observation of slower dynamical processes. It is usually measured either
by using a “pure incoherent elastic scatterer”, such as vanadium, or by measuring the sample at a temperature
low enough to eliminate dynamics at the time-scale accessible by the instrument. Often, R(Q, E) is approximately
Gaussian in shape and its width is known as instrumental energy resolution, dERes . The measured spectrum
SR (Q, E) needs to be corrected to take proper account of these instrumental features. This can be achieved via
the numerical time-FT of SR (Q, E) divided by the numerical time-FT of R(Q, E), which gives the system I(Q, t)
and it is reported in Eq. (1). In summary, QENS is a method that accesses system dynamics by measuring energy
exchanges, and so can be described as an “inelastic method for dynamics”.
Scientific Reports | (2021) 11:14093 | https://doi.org/10.1038/s41598-021-93463-7 2
Vol:.(1234567890)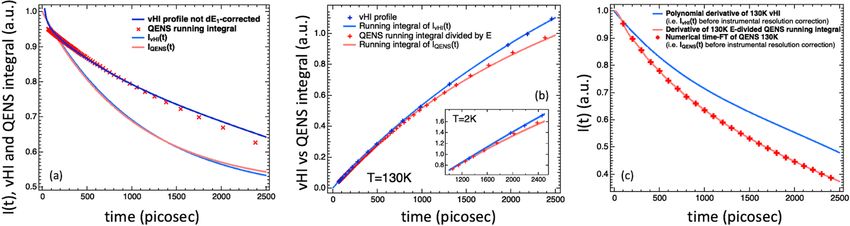
www.nature.com/scientificreports/
Figure 2. Comparison between IvHI (Q, t) (blue) and IQENS (Q, t) (red) summed at several scattering angles.
time − FT{SR (Q, E)}
SR (Q, E) = S(Q, E) ⊗ R(Q, E) → I(Q, t) = . (1)
time − FT{R(Q, E)}
Recently, prompted by a few previous attempts63–79, we have proposed a new neutron scattering method
for diffusive dynamics, which has been denoted “vHI” that stands for “van Hove Integral”80. Our vHI method
measures the neutrons scattered into the elastic line as a function of the observation time, tobs , which is inversely
proportional to the neutron-energy band-width incident at the sample. The basis of our method is that, under
certain conditions, the vHI profile is the running-time integral of the system I(Q, t). As a result, I(Q, t) is accessed
from the time derivative of the measured vHI profile, as summarized in Eq. (2). With adequate counting sta-
tistics this is a simple numerical differentiation but this is achieved, in practice, with the polynomial derivative
method80. In summary, vHI is a method that accesses system dynamics by measuring the solely elastic line
component of the scattering, and so it can be described as an “elastic method for dynamics”. This is the major
conceptual difference in respect to the QENS approach, providing a more straightforward way to the investiga-
tion of dynamical diffusive processes.
tobs d
vHI(Q, tobs ) = ∫ I(Q, t)dt → I(Q, t) = vHI(Q, tobs ). (2)
0 dtobs
vHI has been formulated theoretically and proven by numerical and Monte-Carlo s imulations80,81; it is now
accepted as valid. Here we present the first experimental proof of the method’s validity. Since there are no spec-
trometers designed for vHI, this experimental test has been performed by modifying the procedure of a standard
QENS high-resolution backscattering spectrometer to work in vHI mode. We recently used a similar procedure
in a Monte-Carlo simulation of a neutron backscattering instrument that was equally capable of operating in
either vHI or QENS m ode81. Here we compare the I(Q, t)-function obtained in vHI mode, IvHI (Q, t), with that
from the QENS mode, IQENS (Q, t). The details on how a standard QENS spectrometer has been used in vHI mode
are presented in the “methodology” section at the bottom of this letter. The protocol on how the I(Q, t) has been
extracted from the measured vHI profile is also presented in the “methodology” section along with the more
standard procedure to extract it from standard QENS. In the “methodology” section we also show that the vHI
profile cannot be computed from the QENS spectrum, clarifying a common misunderstanding.
The experiment was carried out on the IN16B high-resolution QENS backscattering s pectrometer25 at the
Institute Laue-Langevin (ILL), Grenoble, France, using F errocene82–84 as a sample. The experiment was run at
130 K where the quasi-elastic component is known to be resolved by IN16B. To take account of instrumental
features, both vHI profile and QENS spectrum were also collected at 2 K where no measurable dynamical pro-
cesses are occurring in the s ystem85.
To judge the accuracy of vHI for I(Q, t), we have compared the IvHI (Q, t) with the IQENS (Q, t). Figure 2
shows the IvHI (Q, t) and the IQENS (Q, t) summed at several scattering angles. Even casual inspection confirms
that the functions are very similar. The smoothness of the two functions does not reflect the statistical-scatter
of the experimental data, but this happens for different reasons. For QENS, the FT operation effectively filters
frequencies and mixes x and y errors, resulting in a strong smoothing. Although for vHI the derivative can be
obtained numerically (no smoothing), it is more convenient to use the polynomial derivative p rotocol80, which
then gives a smooth I(Q, t), analogous to that obtained from the FT of QENS. A single exponential function plus
a flat background is able to fit the I(Q, t)-functions adequately. The relaxation time obtained by the vHI method
results 5% shorter than the relaxation times obtained with QENS.
The results in Fig. 2 are the sum at several scattering angles and allow us to compare vHI and QENS with the
best counting statistics from the experimental data. At reduced statistical significance, we can go further and
make comparisons at each scattering angle. For this, each I(Q, t) has been fitted with an exponential function
Scientific Reports | (2021) 11:14093 | https://doi.org/10.1038/s41598-021-93463-7 3
Vol.:(0123456789)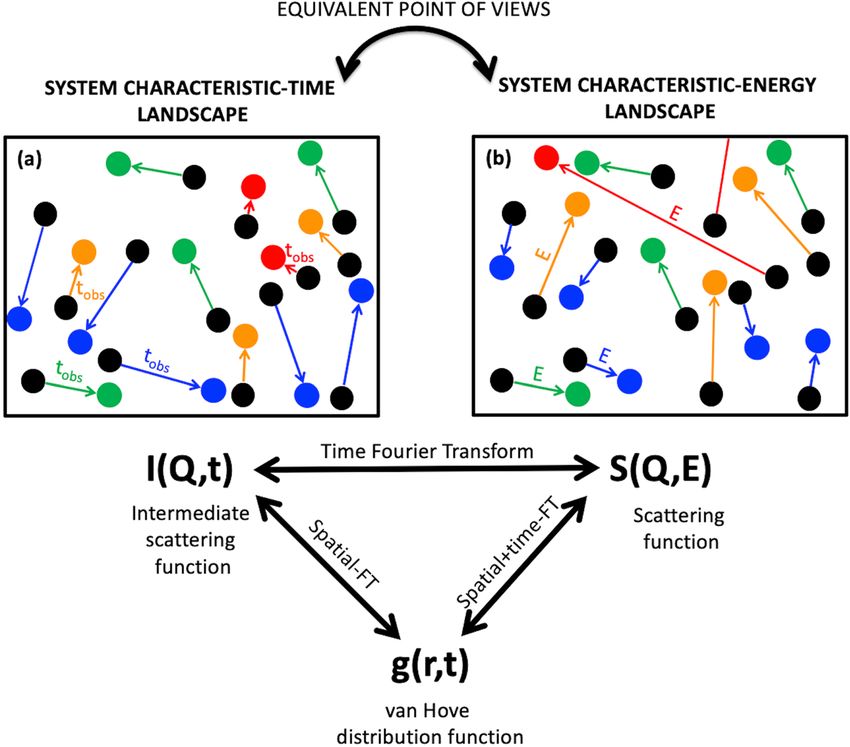
www.nature.com/scientificreports/
Figure 3. Relaxation times obtained by fitting IvHI (Q, t) and IQENS (Q, t) with an exponential function plus a
constant background for several Q values.
plus a flat background, and the resulting relaxation times have been plotted in Fig. 3 as function of Q. Because
the scattered neutron energy-range is small compared with the incident energy, there is effectively no difference
between QENS and vHI for the Q-dependence. Effectively, these twelve Q-values can be considered as simply
twelve independent experiments, each confirming that vHI reproduces the QENS result. The relaxation times
obtained by vHI are in line with QENS confirming, in turn, that the vHI method works in practice.
In conclusion, we have shown here that in a real experiment vHI provides the same information as QENS,
notwithstanding that the instrument was designed for QENS. Use of different Doppler-drive frequencies is an
effective means of mimicking different energy-bandwidths, suggesting that it can be used in practice to access
vHI profiles at a number of backscattering spectrometers worldwide. Obviously, a purpose-built instrument
would provide vastly better counting statistics. Surprisingly, however, the counting statistics of the two methods
are comparable even though the instrument used was expressly designed for QENS. This is in line with our
ENS81, making the
previous studies showing that vHI can achieve tenfold better statistics at I(Q, t)-level than Q
use in vHI-mode of the existing QENS backscattering spectrometers a feasible option for any interested users.
The results presented here complete the validation study of the vHI method—it is now tested and validated via
theory, simulation and experiment. The stage is now set for instrumental layouts optimized for vHI. Advantages
of vHI over QENS that can be explored in the design of a dedicated spectrometer include:
• Ideally, the improved counting statistics of vHI could be traded to access longer times, by using tighter
monochromation methods that would otherwise be too expensive on count-rates86.
• vHI needs to measure the solely elastic line intensity, whereas QENS needs to compute each energy transfer.
This should provide a much easier design for a dedicated vHI instrument.
• Further, since the elastic line intensity is a few orders of magnitude higher than the inelastic one, vHI seems
to be much more suitable for low power and/or compact sources.
• Each time-point is measured independently in vHI. In QENS, instead, all the measured energy-points con-
tribute to each time point as required by the FT operation. As a result, vHI (i) can have a different counting
time at each time point (as actually done in this study), and (ii) it is not affected by either the truncation
errors present in QENS due to the finite energy range of the experiment nor by the need to choose model
fitting functions.
Methodology
QENS backscattering spectrometers in their “standard” QENS mode. In standard QENS mode
the spectrometer works as follows (Fig. 4). The neutron beam from the neutron guide impinges on a crystal
monochromator mounted on a Doppler drive in an almost backscattering geometry. This portion of the instru-
ment is usually referred to as “primary spectrometer”. Only the neutrons with energies matching the energy-
band of the crystal shifted by the Doppler-drive velocity are reflected onto the sample. At any instant, this pack-
age of reflected neutrons has energies distributed following a Gaussian-like distribution, with a constant energy
band-width, dE1, equal to the energy uncertainty of the crystal monochromator, dE1,0. The average energy of the
reflected neutron, instead, is shifted
due to the Doppler effect from the average energy reflected by the crystal
monochromator, E1,0, to E1 vDoppler , function of the speed of the Doppler-drive. These neutrons are scattered
by the sample where they can exchange both energy and momentum. Scattered neutrons are analysed by a set of
crystal analyzers that are usually the same as that on the Doppler, i.e. E2 = E1,0 and dE2 = dE1,0. In this way only
the scattered neutrons with energies E1,0 ± dE1,0 are reflected to the detectors, providing an overall energy
uncertainty of dERes ≈ dE1,0 2 + dE 2 = 1.4 · dE , known as instrumental energy resolution. If the Doppler is at
2 1,0
Scientific Reports | (2021) 11:14093 | https://doi.org/10.1038/s41598-021-93463-7 4
Vol:.(1234567890)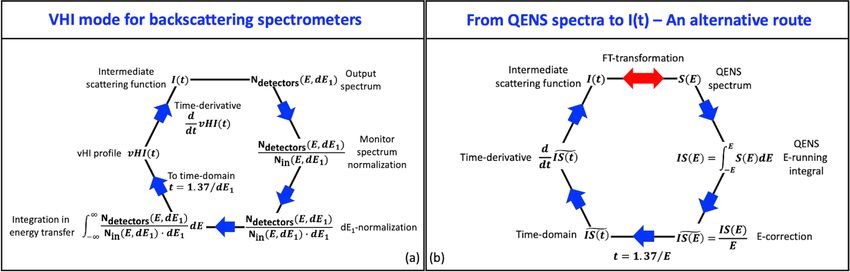
www.nature.com/scientificreports/
Figure 4. The most general layout and modus operandi of a neutron backscattering spectrometer in which the
interplay between the primary and the secondary spectrometers enables the measurement of either the QENS
spectrum or the vHI profile. QENS needs to compute the energy exchange E due to the scattering process and
thus operates in the “inelastic” regime with fixed energy resolution dERes ≈ dE1,0 2 + dE 2 . vHI is
2
fundamentally different, it operates in the purely “elastic” regime. For both QENS and vHI there are three
constant quantitates and one variable. Here, for QENS, d E1, dE2 and E2 are constant and E1 is varied (with,
usually, dE1 = dE2 resulting in dERes ≈ 1.4 · dE1). For vHI, instead, E1, E2 and dE2 are constant and dE1 is varied,
(with E1 = E2 and dE2 ≤ dE1).
rest, only elastically scattered neutrons can arrive at the detectors. On the contrary,
for the
Doppler-drive moving
at speed vDoppler , only the neutrons that exchange an energy E such as E = E1 vDoppler − E1,0 can be detected.
By correlating the Doppler velocity with the arrival time of neutrons at the detector, the energy exchange can be
determined. Analyzers at different scattering angles provide spectra at different Q-values. As a result, the SR (Q, E)
is measured.
vHI mode for QENS backscattering spectrometers. To work in vHI mode, we adapted the operation
of a standard QENS backscattering spectrometer as follows (Fig. 4). With the Doppler-drive at rest the energy and
associated band-width of the neutrons from the first spectrometer is E1,0 ± dE1,0. The analysers reflect exactly
the same energies (being E2 = E1,0 and dE2 = dE1,0), giving a total count at the detectors, Ndetectors Q, dE1,0 , for
solely elastic intensity. This is what vHI is supposed to measure, which corresponds to the running-time integral
of I(Q, t) computed up to tobs = 1.37/dE1,0 (corrected for
Gaussian resolution functions) times the number of
incoming neutrons from the first spectrometer, Nin dE1,0 , times the associated energy band-width dE1,080. With
the Doppler-drive oscillating at an angular frequency ωDoppler , within a complete oscillation cycle, a distribution
of neutron energies centred around E1,0 is generated due to the Doppler effect. The energy band-width depends
on ωDoppler , i.e. dE1 ωDoppler . It collapses to dE1,0 for ωDoppler = 0 and it increases by increasing ωDoppler . As
a result, the distribution of neutron energies at the sample is always centred at E1,0 and its band-width can be
controlled by changing the frequency of the Doppler-drive, with dE1,0 being its lowest value achievable with the
Doppler-drive at rest. This energy band-width-controlled neutron package is then scattered by the sample to the
crystal analysers, which only reflect neutrons with energies of E1,0 ±
dE1,0 (being E2 = E1,0 and dE2 = dE1,0).
As a result, the total count at the detectors, Ndetectors Q,
dE1 ωDoppler , corresponds to the running-time inte-
gral of I(Q, t) computed
up to t
obs = 1.37/dE1 ωDoppler times the number of incoming neutrons from the first
spectrometer,Nin dE1 ωDoppler , times the associated energy band-width, dE1 ωDoppler , as reported below in
Eq. (3):80
tobs
(3)
Ndetectors Q, dE1 ωDoppler = Nin dE1 ωDoppler · dE1 ωDoppler · ∫ I(Q, t)dt
0
in which the running time integral of I(Q, t) is the vHI(Q, tobs ) profile itself. As a result, to compute vHI(tobs ), the
spectrum at the detector has been (i) divided by the corresponding monitor spectrum to both normalize for Nin
and correct, at the
same time, for the U-shaped energy distribution generated by the Doppler-drive, (ii) divided
by dE1 ωDoppler , and (iii) integrated in energy-transfer. By using the backscattering spectrometer in this mode,
the vHI profile can be measured by varying the ωDoppler , with each ωDoppler being associated to a different value
of tobs . Note that Eq. (3) has been rigorously obtained by us in the Supplementary Information of Ref.80. Briefly,
this has been done by assuming that the integral of the energy distribution of the neutron package generated by
the first spectrometer corresponds to the number of incoming neutrons into the sample, which has to be kept
the same for each acquisition at the different ωDoppler ; sample and secondary spectrometer, instead, have been
described by probability distribution functions normalized to the unity. In summary, a standard backscattering
spectrometer can be used in vHI mode by simply operating the primary spectrometer in a different way (Fig. 4).
This modification to the standard QENS methodology can be used in practice, as we did here, to access vHI
profiles at a number of backscattering spectrometers worldwide representing, the facto, the first operative VHI
spectrometers.
The vHI experiment. In vHI-mode, twenty independent acquisitions at twenty different Doppler-frequen-
cies were used to measure the vHI profile. They covered an incoming neutron energy-width range from approxi-
mately 0.3 µeV (Doppler at rest) to 30 µeV (highest frequency), which corresponds to tobs spanning two orders
of magnitude from about 30 to 3000 ps. The longest accessible time resulted, however, limited to 1600 ps by the
Scientific Reports | (2021) 11:14093 | https://doi.org/10.1038/s41598-021-93463-7 5
Vol.:(0123456789)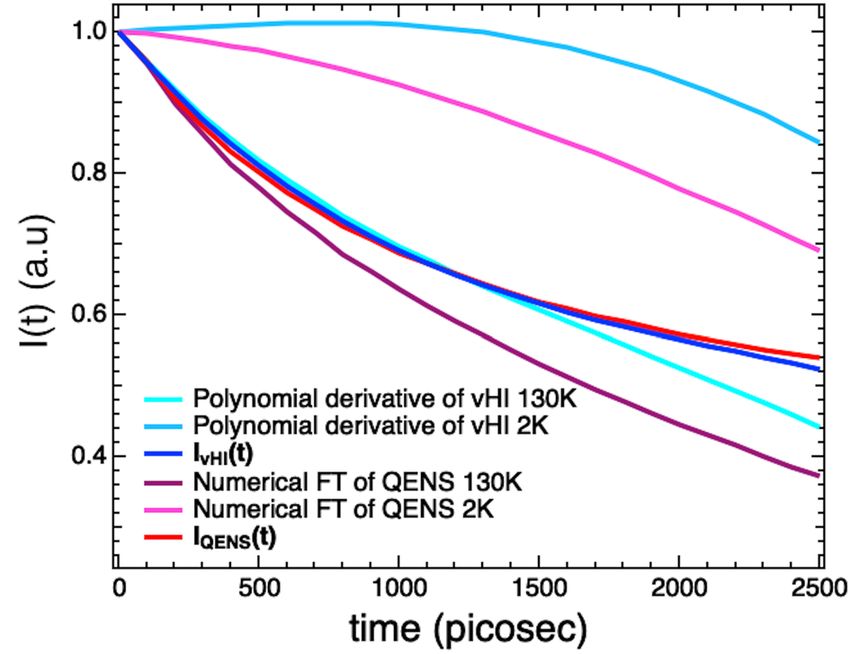
www.nature.com/scientificreports/
Figure 5. (a) vHI profiles at 130 K and 2 K summed over several Q-values with the associated polynomial
mapping, and (b) their time derivatives, obtained both numerical and by the polynomial derivative method. The
dashed line in (b) indicates the longest tobs value accessible as imposed by the instrumental features of the used
spectrometers which, however, can be extended to 2500 ps by “correcting” for the vHI 2 K run as presented at
the bottom of the methodology section.
by instrumental features, including the energy-band width of the second spectrometer (0.5 µeV). As for QENS,
however, also for vHI the 2 K run can be used to extend the accessible time widow to 2500 ps, as presented at
the bottom of this methodology section. The acquisition times were two minutes for the first ten points (lower
ωDoppler ) and then increased to have approximately the same number of total counts per run (up to twelve min-
utes for the highest ωDoppler corresponding to dE1 = 30 µeV). In total, collecting the vHI profile took two and
a half hours. The sample temperature was 130 K, with an analogous measurement at 2 K being made to take
account of instrumental features. The results are shown in Fig. 5a, where the unequal spacing of the points in tobs
arises from measuring at incremental energy-spacing, rather than incremental tobs that would be used in future
experiments. To access the system I(Q, t) the time derivative of the 130 K vHI profile has been computed. The
time derivative of the 2 K vHI profile, on the other hand, was used to compute the longest tobs accessible by the
instrument as the tobs from which it diverges from unity. The results are shown in Fig. 5b. It is encouraging that
the numerical derivative of the two vHI profiles is more tractable than expected, and that their fits (not shown)
work quite well. The more stable polynomial derivative method, selected as the standard protocol, results in
curves that resemble the best fits of the numerical derivatives (which they are not). We suggest that in a dedicated
vHI spectrometer, numerical derivatives would be available, but in general these would not offer any advantage
over the more efficient polynomial derivation method.
The QENS experiment. Whereas in our previous computational works80,81 we were able to compare the
IvHI (Q, t) with the input-I(Q, t), this is obviously not possible here. To judge the accuracy of the vHI method in
accessing I(Q, t), we compared it with the IQENS (Q, t) obtained by carrying out a standard QENS experiment
on the same instrument. IN16B was used in its standard mode (Emax = 30 µeV, dERes = 0.5 µeV). The count-
ing time was three hours that is comparable with the two and a half hours used for the vHI profile. The QENS
instrument has a clear counting-advantage in QENS mode, but nevertheless, when using comparable acquisi-
tion times, the counting statistics of the two techniques are actually comparable. The measurement was made at
130 K, with an analogous measurement at 2 K to characterize the instrumental resolution. The results are shown
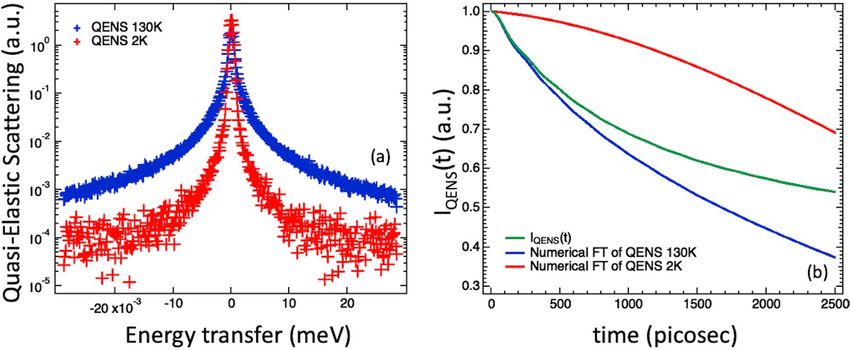
in Fig. 6a. To access the system I(Q, t), the measured QENS needs to be “corrected” by the instrumental resolu-
tion function. As outlined in the introduction, the IQENS (Q, t) was obtained by dividing the numerical time-FT
of the 130 K-QENS spectrum by the numerical time-FT of the 2 K-QENS spectrum. The results are shown in
Fig. 6b.
Three methodological remarks. The first remark is about the misconception that the measured elas-
tic intensity corresponds directly to the intermediate scattering function evaluated at tobs63. By comparing the
intermediate scattering function and the vHI profile (not normalized by dE1), Fig. 7a clearly shows that, even
though trends of these two functions are similar, this earlier assumption is wrong, as already anticipated by our
vHI theory80.
The second remark is about the general misunderstanding that the vHI profile could be obtained by partial
integrations of the QENS spectrum. Figure 7a shows the numerical energy transfer-running integral of the
measured QENS spectrum along with the vHI profile not normalized by dE1 (see Eq. 3). The QENS E-running
integral has been plotted in the time-domain by using the tobs = 1.37/E vHI-relationship for the observation
time, with the difference that now the role of the incoming energy band-width is played by the running value of
the QENS energy transfer, E , (i.e. the limit of the running QENS integral) rather than by dE1 as in the vHI case.
Figure 7b reports the measured vHI profile (normalized by dE1) along with the numerical E-running integral
of the measured QENS spectrum divided by the associated E value (i.e. equivalent to multiplying by tobs in the
Scientific Reports | (2021) 11:14093 | https://doi.org/10.1038/s41598-021-93463-7 6
Vol:.(1234567890)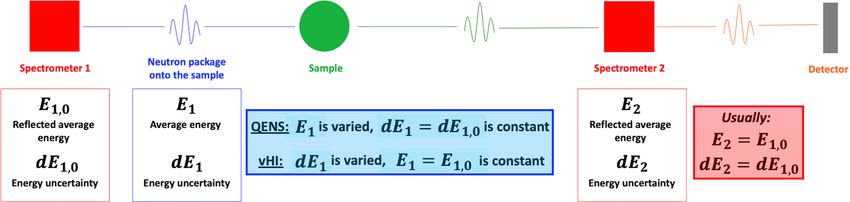
www.nature.com/scientificreports/
Figure 6. (a) QENS spectra at 130 K and 2 K, and (b) the associated numerical time-FT along with their ratio
to compute the IQENS (Q, t), summed over several Q-values.
Figure 7. (a) Comparison between the E-running integral of the measured QENS spectrum, the measured vHI
profile not d
E1-corrected, and the system intermediate scattering function at 130 K. (b) Comparison between
the E-running integral of the measured QENS spectrum divided by E and the measured vHI profile at 130 K.
The time-running integrals of IvHI(t) and IQENS(t), before the instrumental resolution correction, are also shown.
The inset reports the case for 2 K. (c) Comparison between the derivatives of the integrals in (b) clearly showing
that the two approaches give different outcomes, so they are not equivalent. The time-FT of the 130 K QENS
spectrum is also shown.
time domain). Even though the trend is similar, it can be seen, by looking at Fig. 7a,b, that these two profiles
do not overlap in either case. Figure 7c shows their time derivatives resulting in two different I(Q, t) functions,
clearly showing that vHI cannot be obtained by integrating QENS. Intuitively, the rationale behind this is as fol-
lows. In a QENS backscattering experiment the distribution of neutron energies fired into the sample accounts
for all the measurable energies (i.e. the energy window). This is not the case for vHI, where this distribution of
energies is changing during the acquisition. As a result, QENS and vHI are two different experiments. It can be
shown that they overlap in the ideal case of delta instrumental energy resolution functions. Notably, the time
derivative of the E-divided QENS partial numerical E-integrations, gives IQENS (Q, t) before the resolution cor-
rection, i.e. the time-FT of the measured QENS spectrum (Fig. 7c). On the other hand, (i) the running integral
of the IQENS (Q, t) gives the E-divided QENS partial numerical E-running integral, and (ii) the running integral
of the IvHI (Q, t) gives the vHI profile, i.e. the neutron counts at the detectors, in vHI-mode, normalized by the
number of incoming neutrons from the first spectrometer and divided by dE1 (Fig. 7b). This correspondence
shows the importance/meaning of the dE1-correction of Eq. (3) and opens the way to a novel data analysis route
to get I(Q, t) from QENS spectra (of diffusive motions), which has the advantages of being (i) model free and
(ii) unaffected of truncation errors, occurring in standard QENS approaches to I(Q, t) routinely used. Figure 8
reports a schematic summary of both vHI and QENS methodologies for I(t).
The final remark is about pushing the boundary of vHI towards longer times. To access the full experimental
time range, similar considerations and corrections to those for QENS can be applied. In this case, the vHI profile
of either a perfect elastic scatterer or the sample at a very low temperature can be collected and then used to
correct the measured I(Q, t). The correction consists in dividing the time derivative of the measured vHI profile
with the time derivative of this elastic-scatterer vHI profile to get the “corrected” IvHI (Q, t) of the system. As a
result, to access the “corrected” IvHI (Q, t) the time derivative of the 130 K vHI profile has been divided by the
time derivative of the 2 K vHI profile. The result is shown in Fig. 9. Notably, the 130 K and “corrected” IvHI (Q, t)
Scientific Reports | (2021) 11:14093 | https://doi.org/10.1038/s41598-021-93463-7 7
Vol.:(0123456789)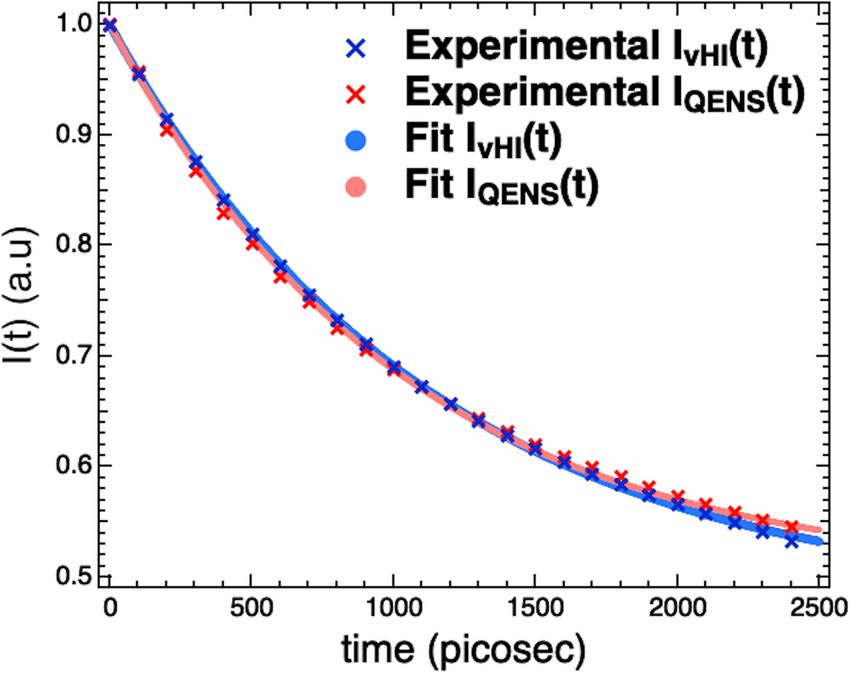
www.nature.com/scientificreports/

                                            Figure 8.  (a) Scheme showing the different steps for the vHI mode of a standard QENS backscattering
                                            spectrometer to access the vHI profile from the measured output and then compute I(t). (b) Scheme showing
                                            the different steps of an alternative method to access I(t) from the measured QENS spectrum. The well-known
                                            FT-transformation is also reported. The factor in the observation time-energy transfer relationship, depends
                                            on the shape of the neutron package energy distribution from the first spectrometer; the value of 1.37 is valid
                                            for backscattering spectrometers employing a Doppler-drive. In practice, it can be computed theoretically or
                                            determined from a calibrated standard sample.

                                            Figure 9.  (a) Comparison between the “corrected” IvHI (Q, t) (blue) and IQENS (Q, t) (red) together with all the
                                            functions involved in vHI and QENS corrections, summed at several scattering angles.

                                            -functions perfectly overlap up to 1600 ps, which corresponds to the longest-time limit imposed by the instru-
                                            mental features; this is not the case for the 130 K and “corrected” IQENS (Q, t)-functions, which overlap for few
                                            tens of picoseconds only. This “corrected” IvHI (Q, t) has been used in the main text.

                                            Received: 31 March 2021; Accepted: 24 June 2021

                                            References
                                             1. Lim, M., Jackson, T. A. & Anfinrud, P. A. Ultrafast rotation and trapping of carbon monoxide dissociated from myoglobin. Nat.
                                                Struct. Biol. 4, 209–214 (1997).
                                             2. Ostermann, A., Waschipky, R., Parak, F. G. & Nienhaus, G. U. Ligand binding and conformational motions in myoglobin. Nature
                                                404, 205–208 (2000).
                                             3. Acevedo-Rocha, C. G. et al. Pervasive cooperative mutational effects on multiple catalytic enzyme traits emerge via long-range
                                                conformational dynamics. Nat. Commun. 12, 1621 (2021).
                                             4. Nandi, P. K., English, N. J., Futera, Z. & Benedetto, A. Hydrogen-bond dynamics at the bio-water interface in hydrated proteins:
                                                A molecular-dynamics study. Phys. Chem. Chem. Phys. 19, 318–329 (2017).
                                             5. Schotte, F. et al. Watching a protein as it functions with 150-ps time-resolved X-ray crystallography. Science 300, 1944–1947 (2003).
                                             6. Sun, H. et al. Protein structural dynamics in solution unveiled via 100-ps time-resolved X-ray scattering. Proc. Natl. Acad. Sci.
                                                USA 107, 7281–7286 (2010).
                                             7. Golysheva, E. A., Shevelev, G. Y. & Dzuba, S. A. Dynamical transition in molecular glasses and proteins observed by spin relaxation
                                                of nitroxide spin probes and labels. J. Chem. Phys. 147, 064501 (2017).
                                             8. Sanz, A. et al. High-pressure cell for simultaneous dielectric and neutron spectroscopy. Rev. Sci. Instrum. 89, 023904 (2018).

          Scientific Reports |   (2021) 11:14093 |                  https://doi.org/10.1038/s41598-021-93463-7                                                                     8

Vol:.(1234567890)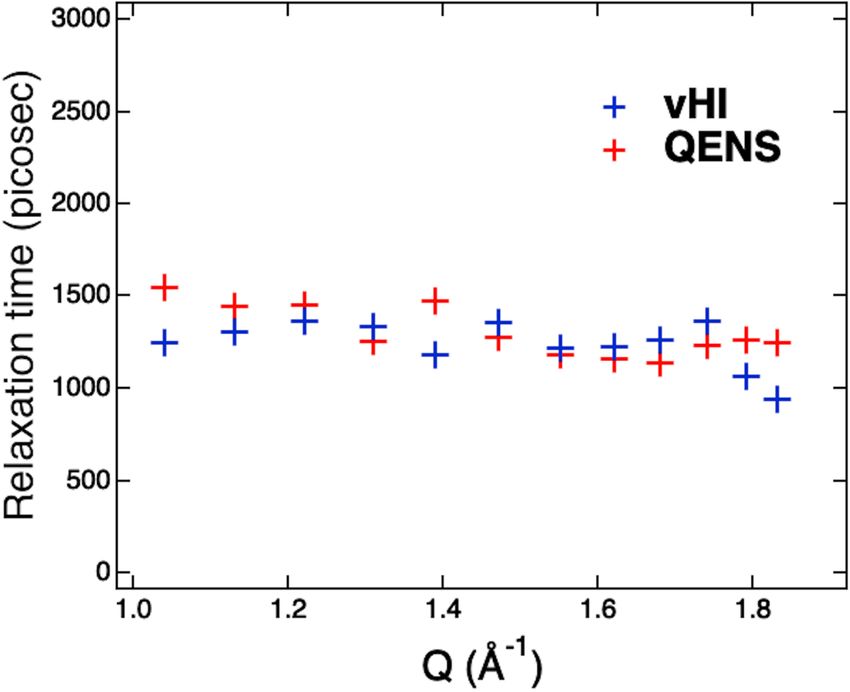
www.nature.com/scientificreports/
9. Zhanghao, K. et al. High-dimensional super-resolution imaging reveals heterogeneity and dynamics of subcellular lipid membranes.
Nat. Commun. 11, 5890 (2020).
10. Matsumoto, S. et al. Extraction of protein dynamics information from cryo-EM maps using deep learning. Nat. Mach. Intell. 3,
153–160 (2021).
11. Smith, J. C., Tan, P., Petridis, L. & Hong, L. Dynamic neutron scattering by biological systems. Annu. Rev. Biophys. 47, 335–354
(2018).
12. Ashkar, R. et al. Neutron scattering in the biological sciences: Progress and prospects. Acta Crystallogr. Sect. D Struct. Biol. 74,
1129–1168 (2018).
13. Gardner, J. S., Ehlers, G., Faraone, A. & García Sakai, V. High-resolution neutron spectroscopy using backscattering and neutron
spin-echo spectrometers in soft and hard condensed matter. Nat. Rev. Phys. 2, 103–116 (2020).
14. Qian, S., Sharma, V. K. & Clifton, L. A. Understanding the structure and dynamics of complex biomembrane interactions by
neutron scattering techniques. Langmuir 36, 15189–15211 (2020).
15. Lee, J.-H. et al. Thermal fluctuation and elasticity of lipid vesicles interacting with pore-forming peptides. Phys. Rev. Lett. 105,
038101 (2010).
16. Nagao, M., Kelley, E. G., Ashkar, R., Bradbury, R. & Butler, P. D. Probing elastic and viscous properties of phospholipid bilayers
using neutron spin echo spectroscopy. J. Phys. Chem. Lett. 8, 4679–4684 (2017).
17. Benedetto, A. & Ballone, P. An overview of neutron scattering and molecular dynamics simulation studies of phospholipid bilayers
in room-temperature ionic liquid/water solutions. Phys. B 551, 227–231 (2018).
18. Chakraborty, S. et al. How cholesterol stiffens unsaturated lipid membranes. Proc. Natl. Acad. Sci. USA 117, 21896–21905 (2020).
19. Kelley, E. G., Butler, P. D., Ashkar, R., Bradbury, R. & Nagao, M. Scaling relationships for the elastic moduli and viscosity of mixed
lipid membranes. Proc. Natl. Acad. Sci. USA 117, 23365–23373 (2020).
20. Rahman, A., Singwi, S. & Sjolander, A. Theory of slow neutron scattering by liquids. I Phys. Rev. 126, 986 (1962).
21. Volino, F. Spectroscopic Methods for the Study of Local Dynamics in Polyatomic Fluids (Plenum, 1978).
22. Bee, M. Quasielastic Neutron Scattering 84 (Adam Hilger, 1988).
23. Frick, B. Neutron backscattering spectroscopy. In Neutron and X-Ray Spectroscopy (eds Hippert, F. et al.) 483–527 (Springer, 2006).
24. Petry, W., Frick, B. & Garcia Sakai, V. Workshop on ‘50 years of neutron backscattering spectroscopy’. Neutron News 28, 6–7 (2017).
25. IN16B High Flux Backscattering Spectrometer (Institut Laue-Langevin, France). https://w ww.i ll.e u/u
sers/i nstru
ments/i nstru
ments-
list/in16b/description/instrument-layout/.
26. HFBS High Flux Backscattering Spectrometer (National Institute of Standards and Technology, USA). https://www.ncnr.nist.gov/
instruments/hfbs/index.html.
27. BASIS Backscattering spectrometer (Oak-Ridge National Laboratory, USA). https://neutrons.ornl.gov/basis.
28. FOCUS Time-of-Flight Spectrometer (Paul Scherrer Institute, Switzerland). https://www.psi.ch/en/sinq/focus.
29. EMU High-Resolution Backscattering Spectrometer (Australian Nuclear Science & Technology Organization, Australia). https://
www.ansto.gov.au/our-facilities/facilities/australian-centre-for-neutron-scattering/emu-high-resolution.
30. IRIS High-Resolution Quasi-Elastic Spectrometer (Rutherford Appleton Laboratory, UK). https://www.isis.stfc.ac.uk/Pages/iris.
aspx.
31. BL02 DNA Biomolecular Dynamics Spectrometer (J-Park, Japan). https://j-parc.jp/researcher/MatLife/en/instrumentation/ns.
html.
32. SPHERES High-Resolution Backscattering Spectrometer (Heinz Maier-Leibnitz Zentrum, Germany). https://mlz-garching.de/
spheres.
33. Meyer, A., Dimeo, R. M., Gehring, P. M. & Neumann, D. A. The high-flux backscattering spectrometer at the NIST Center for
Neutron Research. Rev. Sci. Instrum. 74, 2759 (2003).
34. Mamontov, E. & Herwig, K. W. A time-of-flight backscattering spectrometer at the Spallation Neutron Source. BASIS. Rev. Sci.
Instrum. 82, 85109 (2011).
35. Mesot, J., Janssen, S., Holitzner, L. & Hempelmann, R. Focus: Project of a space and time focusing time-of-flight spectrometer for
cold neutrons at the spallation source SINQ of the Paul Scherrer Institute. J. Neutr. Res. 3, 293 (1996).
36. Yu, D. H., Mole, R. A., Noakes, T., Kennedy, S. J. & Robinson, R. A. Pelican-a time of flight cold neutron polarization analysis
spectrometer at OPAL. J. Phys. Soc. Jpn. 82, SA027 (2013).
37. Carlile, C. J. & Adams, M. A. The design of the IRIS inelastic neutron spectrometer and improvements to its analysers. Phys. B
Cond. Matter. 182, 431–440 (1992).
38. Telling, M. T. F. & Andersen, K. H. Spectroscopic characteristics of the OSIRIS near-backscattering crystal analyser spectrometer
on the ISIS pulsed neutron source. Phys. Chem. Chem. Phys. 7, 1255–1261 (2005).
39. Bewley, R. FARO: A new type of neutron spectrometer with flux and resolution optimized. Rev. Sci. Instrum. 90, 075106 (2019).
40. Wuttke, J. et al. SPHERES, Jülich’s high-flux neutron backscattering spectrometer at FRM II. Rev. Sci. Instrum. 83, 075109 (2012).
41. Chen, S. H. et al. Observation of fragile-to-strong dynamic crossover in protein hydration water. Proc. Natl. Acad. Sci. USA 103,
9012–9016 (2006).
42. Schiro, G. et al. Translational diffusion of hydration water correlates with functional motions in folded and intrinsically disordered
proteins. Nat. Commun. 6, 6490 (2015).
43. Liu, Z. et al. Dynamical transition of collective motions in dry proteins. Phys. Rev. Lett. 119, 048101 (2017).
44. Sharma, V. K., Srinivasan, H., Mitra, S., Garcia-Sakai, V. & Mukhopadhyay, R. Effects of hydrotropic salt on the nanoscopic dynam-
ics of DTAB micelles. J. Phys. Chem. B 121, 5562–5572 (2017).
45. Anunciado, D. B. et al. In vivo protein dynamics on the nanometer length scale and nanosecond time scale. J. Phys. Chem. Lett. 8,
1899–1904 (2017).
46. Osti, N. C. et al. Mixed ionic liquid improves electrolyte dynamics in supercapacitors. J. Phys. Chem. C 122, 10476–10481 (2018).
47. Burankova, T. M., Cardozo, J. F., Rauber, D., Wildes, A. & Embs, J. P. Linking structure to dynamics in protic ionic liquids: A
neutron scattering study of correlated and single-particle motions. Sci. Rep. 8, 16400 (2018).
48. Nanda, H. et al. Relaxation dynamics of saturated and unsaturated oriented lipid bilayers. Soft Matter 14, 6119–6127 (2018).
49. Stavretis, S. E. et al. Effect of magnetic fields on the methyl rotation in a paramagnetic cobalt(ii) complex. Quasielastic neutron
scattering studies. Phys. Chem. Chem. Phys. 20, 21119–21126 (2018).
50. Mamontov, E. Microscopic diffusion processes measured in living planarians. Sci. Rep. 8, 4190 (2018).
51. Mamontov, E., Osti, N. C. & Tyagi, M. Temperature dependence of nanoscale dynamic processes measured in living millipedes
by high resolution inelastic and elastic neutron scattering. Sci. Rep. 9, 11646 (2019).
52. Olsson, C., Genheden, S., García Sakai, V. & Swenson, J. Mechanism of trehalose-induced protein stabilization from neutron
scattering and modeling. J. Phys. Chem. B 123, 3679–3687 (2019).
53. Golub, M. et al. Picosecond dynamical response to a pressure-induced break of the tertiary structure hydrogen bonds in a mem-
brane chromoprotein. J. Phys. Chem. B 123, 2087–2093 (2019).
54. Chan, E. P. et al. Insights into the water transport mechanism in polymeric membranes from neutron scattering. Macromolecules
53, 1443–1450 (2020).
55. Hansen, H. W. et al. Density scaling of structure and dynamics of an ionic liquid. Phys. Chem. Chem. Phys. 22, 14169–14176 (2020).
56. Luo, P. et al. Influence of kosmotrope and chaotrope salts on water structural relaxation. J. Phys. Chem. Lett. 11, 8970–8975 (2020).
57. Osti, N. C. et al. Dynamics of a room temperature ionic liquid under applied pressure. Chem. Phys. 530, 110628 (2020).
Scientific Reports | (2021) 11:14093 | https://doi.org/10.1038/s41598-021-93463-7 9
Vol.:(0123456789)www.nature.com/scientificreports/
58. Tan, P. et al. Decoupling between the translation and rotation of water in the proximity of a protein molecule. Phys. Chem. Chem.
Phys. 22, 18132–18140 (2020).
59. Mamontov, E. et al. Hydration-induced disorder lowers the energy barriers for methyl rotation in drug molecules. J. Phys. Chem.
Lett. 11, 10256–10261 (2020).
60. Yildirim, A. et al. Complex molecular dynamics of a symmetric model discotic liquid crystal revealed by broadband dielectric,
thermal and neutron spectroscopy. Soft Matter 16, 2005–2016 (2020).
61. Van Hove, L. Correlations in space and time and Born approximation scattering in systems of interacting particles. Phys. Rev. 95,
249 (1954).
62. Brockhouse, B. N. Slow neutron spectroscopy and the grand atlas of the physical world. Rev. Mod. Phys. 67(4), 735–751 (1995).
63. Doster, W., Diehl, M., Petry, W. & Ferrand, M. Elastic resolution spectroscopy: A method to study molecular motions in small
biological samples. Phys. B 301, 65–68 (2001).
64. Doster, W., Diehl, M., Gebhardt, R., Lechner, R. E. & Pieper, J. TOF-elastic resolution spectroscopy: Time domain analysis of
weakly scattering (biological) samples. Chem. Phys. 292, 487–494 (2003).
65. Becker, T. & Smith, J. C. Energy resolution and dynamical heterogeneity effects on elastic incoherent neutron scattering from
molecular systems. Phys. Rev. E 67, 021904 (2003).
66. Becker, T., Hayward, J. A., Finney, J. L., Daniel, R. M. & Smith, J. C. Neutron frequency windows and the protein dynamical transi-
tion. Biophys. J. 87, 1436–1444 (2004).
67. Magazu, S., Maisano, G., Migliardo, F. & Benedetto, A. Mean square displacement from self-distribution function evaluation by
elastic incoherent neutron scattering. J. Mol. Struct. 882, 140–145 (2008).
68. Magazu, S., Maisano, G., Migliardo, F. & Benedetto, A. Biomolecular motion characterization by a self-distribution-function
procedure in elastic incoherent neutron scattering. Phys. Rev. E 79, 041915 (2009).
69. Magazu, S., Maisano, G., Migliardo, F. & Benedetto, A. Motion characterization by self-distribution—Function procedure. Biochim.
Biophys. Acta 1804, 49–55 (2010).
70. Magazù, S., Migliardo, F. & Benedetto, A. Mean square displacements from elastic incoherent neutron scattering evaluated by
spectrometers working with different energy resolution on dry and hydrated ( H2O and D 2O) lysozyme. J. Phys. Chem. B 114,
9268–9274 (2010).
71. Magazù, S., Migliardo, F. & Benedetto, A. Puzzle of protein dynamical transition. J. Phys. Chem. B 115, 7736–7743 (2011).
72. Magazù, S., Migliardo, F. & Benedetto, A. Elastic incoherent neutron scattering operating by varying instrumental energy resolu-
tion: Principle, simulations, and experiments of the resolution elastic neutron scattering (RENS). Rev. Sci. Instrum. 82, 105115
(2011).
73. Magazù, S., Migliardo, F. & Benedetto, A. Response to “Comment on ‘Elastic incoherent neutron scattering operating by varying
instrumental energy resolution: Principle, simulations, and experiments of the resolution elastic neutron scattering (RENS)’”. Rev.
Sci. Instrum. 83, 107102 (2012).
74. Magazù, S., Migliardo, F., Benedetto, A. L., Torre, R. & Hennet, L. Bio-protective effects of homologous disaccharides on biological
macromolecules. Eur. Biophys. J. 41, 361–367 (2012).
75. Nickels, J. D. Instrumental resolution effects in neutron scattering studies of protein dynamics. Chem. Phys. 424, 7–11 (2013).
76. Doster, W., Nakagawa, H. & Appavou, M. S. Scaling analysis of bio-molecular dynamics derived from elastic incoherent neutron
scattering experiments. J. Chem. Phys. 139, 045105 (2013).
77. Benedetto, A. & Kearley, G. J. Elastic Scattering Spectroscopy (ESS): An instrument-concept for dynamics of complex (bio-) systems
from elastic neutron scattering. Sci. Rep. 6, 34266 (2016).
78. Benedetto, A. Low-temperature decoupling of water and protein dynamics measured by neutron scattering. J. Phys. Chem. Lett.
8, 4883–4886 (2017).
79. Mamontov, E. Implementation and assessment of resolution-dependent elastic incoherent neutron scattering measurements at a
backscattering spectrometer for probing relaxations in complex systems. Nucl. Inst. Methods Phys. Res. A 949, 162534 (2020).
80. Benedetto, A. & Kearley, G. J. Dynamics from elastic neutron-scattering via direct measurement of the running time-integral of
the van Hove distribution function. Sci. Rep. 9, 11284 (2019).
81. Benedetto, A. & Kearley, G. J. A quantitative comparison of the counting significance of van hove integral spectroscopy and
quasielastic neutron scattering. Sci. Rep. 10, 6350 (2020).
82. Gardner, A., Howard, J., Waddington, T., Richardson, R. & Tomkinson, J. The dynamics of ring rotation in ferrocene, nickelocene
and ruthenocene by incoherent quasi-elastic neutron scattering. Chem. Phys. 57, 453–460 (1981).
83. Appel, M., Frick, B., Spehr, T. L. & Stühn, B. Molecular ring rotation in solid ferrocene revisited. J. Chem. Phys. 142, 114503 (2015).
84. Kemner, E. et al. Molecular motion of ferrocene in a Faujasite-type zeolite: A quasielastic neutron scattering study. J. Phys. Chem.
B 104, 1560–1562 (2000).
85. Appel, M., Benedetto, A., Frick, B. & Kearley, G. Test acquisition for QENS using the van-Hove Integral method (Institut Laue-
Langevin (ILL), 2019). https://doi.org/10.5291/ILL-DATA.TEST-3172.
86. Kuhlmann, K., Appel, M., Frick, B. & Magerl, A. Breakthrough in neutron backscattering spectroscopy: Energy resolution improved
by one order of magnitude using the GaAs 200 reflection. Rev. Sci. Instrum. 90, 015119 (2019).
Acknowledgements
The Authors acknowledge support from (i) the Institute Laue-Langevin (Grenoble, France) for the allocation
of testing neutron beam-time on the high-resolution backscattering spectrometer IN16B, (ii) Markus Appel for
having collected the data on our behalf and for the fruitful discussion, (iii) Andreas Magerl and Bernhard Frick
for the fruitful discussion, and (iv) the University College Dublin (UCD) under the Seed Funding Scheme, with
additional support provided by UCD Schools of Chemistry and Physics. A.B. acknowledges support from the
Italian Ministry of Education, University and Research (Grant no. MIUR-DM080518-372).
Author contributions
A.B. and G.J.K. contributed equally on all the major aspects of this work. A.B. and G.J.K. wrote the manuscript
text and prepared the figures.
Competing interests
The authors declare no competing interests.
Additional information
Correspondence and requests for materials should be addressed to A.B.
Reprints and permissions information is available at www.nature.com/reprints.
Scientific Reports | (2021) 11:14093 | https://doi.org/10.1038/s41598-021-93463-7 10
Vol:.(1234567890)www.nature.com/scientificreports/
Publisher’s note Springer Nature remains neutral with regard to jurisdictional claims in published maps and
institutional affiliations.
Open Access This article is licensed under a Creative Commons Attribution 4.0 International
License, which permits use, sharing, adaptation, distribution and reproduction in any medium or
format, as long as you give appropriate credit to the original author(s) and the source, provide a link to the
Creative Commons licence, and indicate if changes were made. The images or other third party material in this
article are included in the article’s Creative Commons licence, unless indicated otherwise in a credit line to the
material. If material is not included in the article’s Creative Commons licence and your intended use is not
permitted by statutory regulation or exceeds the permitted use, you will need to obtain permission directly from
the copyright holder. To view a copy of this licence, visit http://creativecommons.org/licenses/by/4.0/.
© The Author(s) 2021
Scientific Reports | (2021) 11:14093 | https://doi.org/10.1038/s41598-021-93463-7 11
Vol.:(0123456789)You can also read


