Irish Sovereign Green Bonds - NTMA
←
→
Page content transcription
If your browser does not render page correctly, please read the page content below
Irish Sovereign
Green Bonds

NTMA Investor Relations Team

October 2018

                               Photo from National Development   1
                               Plan 2018-2027
Contents

1. Ireland’s Sovereign Green Bond (“ISGB”)
2. Policy background
3. Eligible Green Projects
4. Ireland leads the Euro Area recovery
5. Public finances much improved
6. Structure of Irish economy is sound
7. Appendix

                                                       2
                                          RESTRICTED
Government commitment

  “Climate action is a top priority of this government. Future generations depend on the
 actions we take today. Project Ireland 2040 sets out our ambitions in regard to building a
 sustainable, low-carbon society, ambitions that can only be realised by working together
                      with communities, businesses and individuals.”
                                  Taoiseach Leo Varadkar
“This Government fully recognises the challenge we face in relation to Climate Action and
has set out a clear strategy to address this challenge through the National Mitigation Plan
 and National Adaptation Framework. Our ambition to fund these strategies through the
National Development Plan is clearly outlined and this includes a commitment to invest in
          achieving a transition to a low carbon and climate resilient economy.”
                           Minister for Finance Paschal Donohoe
[On The National Development Plan] “For Ireland, this represents a huge leap forward in our
  approach to addressing climate action, both in the scale of our ambition and the funding
          that we’re making available, as a government to meet the challenges.”
      Minister for Communications, Climate Action and Environment Denis Naughten
                                                                                              3
                                         RESTRICTED
Ireland’s Sovereign
Green Bond
Ireland’s Framework is fully aligned to the
2018 Green Bond Principles

                 RESTRICTED
Overview

• Ireland is committed to the transition to a low carbon, climate resilient and
  environmentally sustainable economy by 2050.
• Ireland has a strong statutory, policy and investment framework in place in order to
  achieve this transition.
• Ireland’s Government plans to issue a green bond, which will be underpinned by
  the Irish Sovereign Green Bond Framework (“Framework”) and aligned with the
  Green Bond Principles (2018).
• Eligible green project categories for the proceeds of the green bond issue include:
  Sustainable water and waste management, clean transportation, environmentally
  sustainable management of living natural resources and land use, renewable
  energy, energy efficiency and climate change adaptation projects.
• Sustainalytics has provided a Second Party Opinion on the Framework.

                                                                                         5
                                          RESTRICTED
Ireland did not have the funds for green spending until
           now – because of the severe crisis of 2008-2012

      Gross National Income* at current prices                     Government capex (% of GNI*) at historic
                    (1995=100)                                         low, only recovering from 2018
320                                                              7%
300     "Celtic Tiger"   Credit/Prop   Bubble    Recovery
         1994-2001       erty Bubble    Burst
280
                                                                 6%
260
240
220                                                              5%
200
180                                                              4%
160
140
                                                                 3%
120
100
 80                                                              2%
 60
 40                                                              1%
 20
  0
                                                                 0%
      1995        2000        2005        2010      2015
                                                                      2000 2002 2004 2006 2008 2010 2012 2014 2016

                                                                                          Source: CSO, Eurostat      6
                                                            RESTRICTED
Rationale for and features of
                            Ireland’s green bonds

•   Ireland believes green finance, including Irish Sovereign Green Bonds (“ISGBs”) will play a
    key role in financing transition to a low carbon, climate resilient and environmentally
    sustainable economy.

•   Ireland plans to diversify its funding base by adding to this substantially growing market
    segment and match the preference of investors.

•   ISGBs will fund eligible green projects that generate a positive environmental benefit.

•   ISGBs will rank pari-passu with each other and with Irish Government bonds.

•   Investors will not bear any risk in respect of Eligible Green Projects.

•   Ireland’s Green Bond Framework is attached to the bonds.

•   An equivalent amount to proceeds will be spent on eligible green projects.

                                                                                                  7
                                               RESTRICTED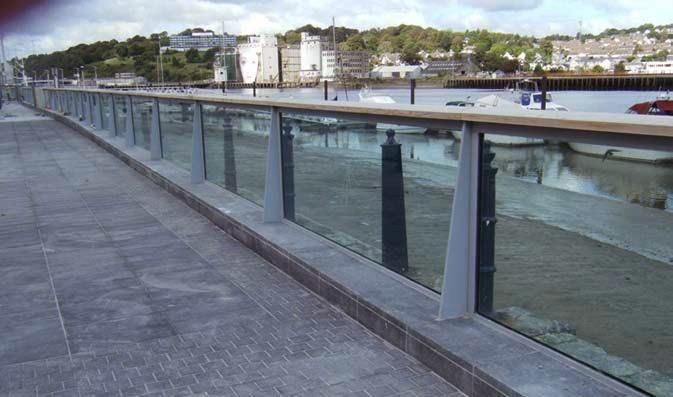
Irish Sovereign Green Bond Framework
                 Aligned with the ICMA Green Bond Principles, 2018

                                                                              Project Evaluation and
              Use of Proceeds
                                                                                Selection Process

 Sustainable Water, Clean Transportation, Energy                          Working Group established by Government:
 Efficiency, Climate Change Adaptation & others                                  NTMA, DPER, DCCAE & DFIN

              Management of
                                                                                      Reporting
                Proceeds

Pending its allocation to Eligible Green Projects, Ireland                         Annual Allocation Report &
  will temporarily hold proceeds in its Central Fund.                     Biennial Eligible Green Project Impact Report

                                                                                                                          8
                                                             RESTRICTED
Irish Sovereign Green Bond Framework
      External review by Sustainalytics

                                                                                   9
                   RESTRICTED        Source: Sustainalytics Second Party Opinion
Policy background

Ireland’s National Development Plan
 2018 – 2027 sets out €23 billion
of spending on green projects

                RESTRICTED
Ireland's timeline of sustainability initiatives
Cut CO2 emissions from electricity, buildings & transport by at least 80% by 2050
April 2014 December 2017 January 2018 July 2018
Ireland’s National Policy Annual Transition
Position on Climate Statement
Action and Low Carbon 2017
Development Green Bond Framework
approved by the Government
of Ireland
2014 2015 2016 2017 2018 2019
December 2015 July 2017 February 2018 April 2018
Climate Action
and Low Carbon
Development Act, 2015
11
RESTRICTEDNational Mitigation Plan
A pathway to achieve targeted level of decarbonisation
• 106 supporting actions / projects. National Policy Position objective for
• Addresses emissions across the 2050:
economy: Built Environment, • Reduction in carbon emissions of
Electricity, Transport, and Agriculture, at least 80% (compared to 1990)
Forestry & Land-Use. by 2050 across electricity
• A ‘living document’ updated annually generation, built environment and
through Annual Transition Statement transport sectors.
• Cabinet Committee and National • An approach to carbon neutrality
Parliament Oversight. in the agriculture and land use
• Formal update at least every five sector, including forestry, which
years. does not compromise capacity for
sustainable food production.
Supported by National To ensure that progress in
Dialogue on Climate Action implementing the NMP is robust, a
• Provides an opportunity to progress report will be published each
create awareness, year under the 2015 Act, to be
engagement and included in the Annual Transition
motivation to act (locally,
Statement.
regionally and nationally)
in relation to the NMP recognised by IMF PIMA Report
challenges presented by (2017) as good practice example of
climate change. investment-relevant information.
Source: National Mitigation Plan 12
RESTRICTEDEligible Green
Projects
RESTRICTEDIrish Sovereign Green Bond Framework
Examples of eligible green expenditures
Estimated
Estimated
Annual Amounts
Eligible Green Categories Examples of Eligible Green Projects Percentage
2018
2018
€ Million
1 Sustainable Water and • Clean water and wastewater treatment projects
540 31%
Wastewater Management • Rural Water Programme
• Public and sustainable transport Investment Programme
• Low emission vehicles incentives & infrastructure, and
2 alternative fuels
Clean Transportation • Public programmes incentivising modal shift away from private 710 40%
car use
• Public Service Provision Payments
• Afforestation programme
Environmentally Sustainable
3 • Grants, subsidies, and support schemes designed to reduce
Management of Living Natural 270 15%
agricultural environmental impacts
Resources and Land Use
• Operation of the Environmental Protection Agency (EPA)
• Support scheme for renewable heat
4 Renewable Energy • Research and development for the commercialization of 10 1%
renewable energy technologies
Built Environment / Energy • Energy efficiency programmes (including heating, retrofit,
5 160 9%
Efficiency insulation)
Climate Change Adaptation • Flood relief and other risk mitigation programmes 70 4%
6
TOTAL
€ 1,760
Source : Department of Public Expenditure 14
RESTRICTED and Reform.National Development Plan (NDP) 2018 – 2027
Projected Exchequer spending on green projects
1 in 5 euros in the NDP to be spent on green
projects
Sustainable Transition to a Total:€23
Management Low carbon
Sustainable
Mobility of Water and and Climate billion
Resilient
€8.6 billion
Environmental
Resources Society (13% of
€6.8 billion €7.6 billion GNI*)
Source: National Development Plan 15
RESTRICTED 2018-2027Clean Transportation
Sustainable Mobility €8.6 billion Investment
An electric light railway transportation DART (Dublin Area Rapid Transit) electric LUAS Capacity enhancement project:
system via Dublin Airport to Dublin’s train expansion programme is a series of rail LUAS is a tram/light electric rail system in Dublin
south city centre (operating in tunnel projects that will create a full metropolitan Line and the project expansion includes:
under the city centre) and onwards to area DART network for Dublin with all of the lengthening of the 26 existing Green line
Sandyford using the existing LUAS (on- lines linked and connected. trams from 43m to 55m,
street tram system) line to ensure that procurement of eight new 55m-long trams
growth along this corridor can be This includes buying additional fleet for the to cater for the forecast increased passenger
accommodated. DART network and measures such as re- demand to 2027,
signalling, junction and station changes to extension of the Sandyford depot to
Estimated cost 2018-2027: € 3 billion provide expanded services. accommodate the maintenance of the
longer trams.
Estimated cost 2018-2027: € 2 billion
Estimated cost 2018-2022: € 90 million
Source : National Development Plan 16
RESTRICTED 2018-2027 & Project Ireland 2040 Capital TrackerClean Transportation
Estimated Expenditure 2018 € 710 Million
Programme/Scheme Estimated Expenditure
2018 € Million
Sustainable Urban 26
Transport/Smarter Travel
Heavy Rail Renewal, 200
Development &
Maintenance
Public Transport Investment - 82
LUAS and Metro
Public Transport Investment - 84
Bus Connects
Others: Cycling and Walking; 18
Green Schools; Accessibility
Retrofit; Greenways; Carbon
Reduction
Public Service Provision 300
Payments
Total € 710 Million
17
Source : DPER , Córas Iompair Éireann (CIÉ)
RESTRICTEDSustainable water and wastewater management
€6.8 billion Investment
Water Services Policy Statement 2018 – 2025:
“Access to safe, reliable and high quality drinking water is perhaps often taken for granted
but it is essential to our daily lives, is one of the foundation stones on which
our society and our economy is built.”
3 Themes:
• Quality
630,000 customers on EPA Remedial Action List.
28% group water schemes on Remedial Action List.
148 urban areas require improvements in wastewater treatment.
• Conservation
Network loss rate of 45%.
Many treatment plants operating at maximum capacity.
• Future Proofing
Population estimated to grow by an additional 1 million by 2040.
Climate change - greater frequency of extreme weather events.
Improve resilience of rural and private water supplies.
Source : Water Services Policy Statement 18
RESTRICTED 2018-2025Sustainable water and wastewater management
Leakage Reduction Programme
Leakage Reduction Programme
• Estimated Cost: € 500m over 4 years.
• Reducing leaks by fixing or replacing old & damaged pipes and removing lead pipes on the
network.
• Target to save 166 million litres of water per day.
Benefits from the programme:
• Reliable water supply
• Improved water quality
Reduces the risk of contamination and health risks.
• Reduced leaks
Reducing disruptions and cost of running the network.
• Improved supply connections
Assists with pressure testing and emergencies.
Source : Water Services Policy Statement 19
RESTRICTED 2018-2025Sustainable water and wastewater management
Water Projects
Proposed
Project Cost 2018-2022 Brief Description Completion
Date
To ensure a safe and National spread of Irish Water
sustainable water supply for projects to improve water and
Vartry Water Supply Scheme wastewater services across the
north Wicklow and south 2021 country
€151m
Dublin. Upgrade the existing
Source:
treatment plant. https://www.water.ie/projects
-plans/our-projects/
To ensure long-term (2050+)
water supply needs of Greater
Eastern and Midlands Water
Dublin Region are met in a
Supply Project
sustainable manner.
€233m to 2022 TBC
Involves a water treatment
Estimated Total Cost to
plant, 170 km pipeline,
2027: €1.2 to €1.3 billion
pumping stations and terminal
point reservoir.
Ringsend
Wastewater
Built to treat the wastewater Treatment
Plant
Ringsend Wastewater for 1.6 million people; currently
Treatment Plant services 1.9 million people. 2025
€249m Major capacity upgrade project
commenced in 2018.
Source: Irish Water & 20
RESTRICTED Project Ireland 2040 Capital TrackerEnvironmentally Sustainable Management of Living
Natural Resources and Land Use
Forestry Programme
• Strategic goal of forest policy: to develop an internationally competitive
and sustainable forest sector.
• Only 11% forest cover currently, well below EU average
Aiming for 18% by 2046 (1985: 5.9%)
• Forestry Programme 2014-2020
Afforestation grant and premium scheme to increase forest cover.
Grant: €3,800 - €6,200/ha; Annual Premiums €520 - €680 /ha.
Current Afforestation Rate: approx. 6,000 hectares per annum.
Aims for annual planting of 30% Broadleaves.
Typical plantation of Sitka spruce will remove 10 tonnes of CO2e per
annum per hectare over a full rotation.
To contribute up to 22m tonnes to 2030 emissions reduction target.
• Some State revenue from auctioning ETS allowances allocated to Forestry
Programme.
21
RESTRICTED Source :Dept. of Agriculture, Food and the Marine: Forestry
Programme 2014-2020; Forest Statistics Ireland 2017Built environment/ energy efficiency
€4.5 billion Investment
• €4.5 billion in the NDP to be spent on energy efficiency : energy efficiency housing retrofit €3,000 million,
energy efficiency in public buildings €800 million, boiler replacement €700 million.
• Investments in energy efficiency of existing commercial and public building stock with a target of all public
buildings and at least one-third of total commercial premises upgraded to Building Energy Rating ‘B’ by 2030.
• Investment in energy efficiency, with upgrades to homes increasing from 30,000 to 45,000 >2% of the housing
stock per annum from 2021 to achieve a minimum Building Energy Rating of ‘B’.
• Example: Deep Retrofit Pilot Programme - 3 year pilot : how to scale up commitment of €3bn in housing
energy efficiency retrofit focusing on maximising energy efficiency and meeting energy demand with
renewable energy solutions.
Before kWh/m2/yr After
Energy Consumption
400
350
300
250
200
150
100
50
0
Before 367.7
After 44.7
22
RESTRICTED Source: Sustainable Energy Authority IrelandBuilt environment/ energy efficiency
Overview of costs and emissions reductions potential
Cumulative
Projected
GHG
Exchequer
emissions Progress to end
Scheme Objective of Measure Expenditure
reduction August 2018
2017-2020
2017-
(€m)
2020 (ktCO2e)
Better Energy Scheme aimed at making homes warmer and more energy 215,000 homes
79 149
Homes efficient through a wide range of grants. upgraded
Better Energy Nationwide scheme that delivers free energy efficiency 137,000 homes
86 47
Warmer Homes improvements to the homes of those in energy poverty. upgraded
SEAI has supported
over 300 community
A community based scheme that improves the energy energy projects
Better Energy
efficiency of clusters of buildings through capital funding, 85 184 covering over 15,000
Communities
partnerships and technical support. homes and hundreds
of community, private
and public buildings
60 buildings upgraded
Deep Retrofit Significant energy efficiency renovation of homes to an A
21 14 to A rating (typically
Pilot rating.
from an F or G)
A three-year pilot providing energy efficiency improvements
Warmth and
to the homes of older people and children suffering from
Wellbeing Pilot 32 18 750 homes
chronic respiratory conditions relating to the thermal
Scheme
efficiency of their homes.
Source: National Mitigation Plan & 23
RESTRICTED Sustainable Energy Authority IrelandClimate change adaptation
€1.0 billion Investment
Flood relief and other risk mitigation
programmes
Estimated cost 2018-2027: €1 billion
• Investment programme to protect 11,200
properties (over 0.5% of Ireland’s housing
stock). This includes eight major flood
relief schemes under construction and 26
schemes at design/ planning stage.
• Major projects include: Lower Lee (Cork
City) Skibbereen; Enniscorthy; Bandon ;
Clonakilty; Claregalway; and Athlone.
• In addition, the programme supports the
delivery of 660 minor works schemes.
Figure: Waterford Quays Flood Relief Scheme
Source: The Office of Public Works 24
RESTRICTED & National Development Plan
2018-2027Non Exchequer climate initiatives
• Renewable Electricity - In 2005 7% of Irish electricity 30%
27%
25%
came from renewable sources. Today it is 25% 23%
approximately 30%. 20%
21%
20% 17%
• Ireland is the EU member state with the highest level 15%
15%
of installed wind capacity relative to power
consumption and 2017 was a record year for new 10%
7%
capacity (426 MW). 5%
5%
• In 2019, Ireland will move to a new Renewable
0%
Electricity Support Scheme (RESS) which will offer 2000 2005 2010 2011 2012 2013 2014 2015 2016
technology neutral capacity auctions. This will allow Percentage of electricity generated by renewable energy
the State to increase renewable electricity
deployment while minimising the cost to the
Top 5 Countries of wind power installations relative to
consumer and broadening the technologies their power consumption
supported. Up to 4,500MW additional capacity
planned for 2030.
• Carbon Tax - €20 a tonne applying to all greenhouse
gas emissions outside the EU Emissions Trading
Scheme.
Source: DCCAE – Renewable Electricity Support Scheme; SEAI & 25
RESTRICTED WindEurope.orgGreen finance
Further actions to promote the green finance agenda
IFS 2020 Strategy: OECD Paris
Green and Sustainable Collaborative on Green
Finance Budgeting
Climate Action Fund Public Spending Code
• ISIF Founding Signatory Climate KIC Climate
to UN Principles of Innovation Summit
Responsible Investment Nov 2018
• UN Financial
Fossil Fuel Divestment
Centres for
Bill
Sustainability (FC4S)
“Sustainalytics recognizes Ireland’s contribution to the European Union’s efforts to advance
green finance by issuing Irish Sovereign Green Bonds.”
26
RESTRICTED Source: Sustainalytics second party opinionIreland leads the
EA recovery
Economy has been fastest growing on
average over the last five years
RESTRICTEDMacro picture is positive: Ireland close to full employment
after crisis of 2008-11
Strong real growth Dramatic drop in Inflation still low – partly
unemployment rate thanks to Brexit
30% 18% 4
25% 16% 16% 3
20% 14% 2
15% 12% 1
10% 10% 0
5% 8% -1
0% 6% -2
5.6%
-5%
4% -3
-10%
2%
-4
-15% 2009 2011 2013 2015 2017
0%
1999200220052008201120142017 HICP Ireland HICP Euro Area
GDP Underlying*
* Underlying series is modified final domestic demand Source: CSO 28
RESTRICTEDHat-trick of primary surplus, improving debt dynamics and
reduced financing needs
Five years of primary Ireland is improving its debt NTMA has reduced near-
surplus (€bn) dynamics relentlessly term issuance needs (€bns)
10 30
Debt-to-GNI* 25
5
(111%, from 166%) 20
0
15
-5 Debt-to-GG Revenue 10
(263%, from 353%)
-10 5
0
-15 Average interest rate 2018 2019 2020 2021
(2.9%, from 5.1%)
-20 Recent Reductions
1998
1995
2001
2004
2007
2010
2013
2016
2019 f
Debt-to-GDP Debt Prefunded in Cash
(68%, from 120%) Debt
GG Balance Primary Balance End 2013 Debt Profile
Note: GNI* is an augmented Gross National Income metric which excludes the impact
of multinational companies’ distortions thereby highlighting the “true” size of the Irish
economy. Debt to GDP flatters Ireland’s position – use of the other metrics is advised.
Source: CSO, NTMA 29
RESTRICTEDFunding environment still favourable for Ireland in 2018:
bottom end of target funding range almost reached
€14-18bn 15 years €13bn+
funding target for 2018 €4bn raised in April via the Expected year end cash
syndicated sale of a new 15- balance. Ireland’s pre-funding
2018 YTD year benchmark bond. is the highest in the EA
€13.5bn of funding Yield of only 1.32%
Average maturity 11.9years
Interest rate of 1.03%
30
RESTRICTEDKnown unknowns are outside Ireland’s control; domestic
conditions safer because recovery was credit-less
Late Cycle US Brexit
Ireland is later than the Euro Ireland is still a “high beta” bet “Hard” Brexit could impact Irish
Area (EA) in its economic cycle on the US economy, Growth by 4-7% over a 4-5
thanks to its close ties to US in particular its ICT sector year period
Slowdown invariably follows Impact of US Corporate Tax
when central banks make reform still unclear
money dearer and more scarce
31
RESTRICTEDPublic finances
much improved
Track record of primary surpluses now
five years long; interest cost below 3%
RESTRICTEDIreland has improved its debt dynamics: next step is to
follow others and run GGB surplus
In recent years Ireland has run primary 2017 GGB Deficit/Surplus (% of GDP);
surpluses that reduced debt ratios Ireland in middle of the pack in the EU
15% Malta
Cyprus
10% Czech Rep
Luxembourg
Sweden
5% Germany IE: €1bn
Netherlands
Denmark Deficit
0% Bulgaria 2017
Greece
-5% Croatia
Lithuania
Slovenia
-10% Estonia
Latvia
-15% Ireland (GNI*) -0.6
Finland
Austria
-20% Slovakia
Belgium
EU 28
-25% Poland
UK
~ Hungary
-30%
-40% Italy
1998 2000 2002 2004 2006 2008 2010 2012 2014 2016 France
Romania
Portugal
Primary Balance (% of GNI*) Spain
Debt Stabilising PB (% of GNI*) -4 -2 0 2 4
Note: Debt Stabilising primary balance is the primary balance it is necessary to
run in a year to keep the debt-to-GNI* ratio from rising given the average
interest rate and growth in that year. Source: CSO, NTMA 33
RESTRICTEDGross Government debt 68% of GDP in 2017; GG debt fell
to 111% of GNI*; shorthand ratio somewhere in between
140% 180%
120 120 166%
Debt-to-GNI* ratio
120% 111 160%
is high but has
104 declined quickly
33 30 140%
100%
86 32 18 77 120%
120%
80% 73
62 68 66
20 11 64 111%
9 100%
9
60%
25 80%
87 90 86
40% 79
66 66 64 60%
59 68%
20% 37 40%
0% 20%
0%
Net Debt/GDP Cash Balances/EDP assets 1995 1999 2003 2007 2011 2015
GG Debt/GDP Debt-to-GNI* Debt-to-GDP
Source: CSO; Department of Finance, NTMA calculations 34
RESTRICTEDThe NTMA improved Ireland’s 2018-2020 maturity profile in
recent years
Various operations have extended the …Ireland (in average years) now compares
maturity of Government debt … favourably to other EU countries
30 12
€ Billions
c.€32bn to fund
25
in next two years 10
20
8
15
10 6
9.9 9.8 9.7
5 4 7.8 7.5 7.5 7.5 6.9 6.4 6.2 6.2
0
2
2029
2018
2019
2020
2021
2022
2023
2024
2025
2026
2027
2028
2030
2046-50
2031-35
2036-40
2041-45
2051-53
0
Debt Debt Prefunded in Cash AT BG IR DK FR NL ES IT PT FN BD
Recent Reductions Long-term Extensions Govt Debt Securities - Weighted Maturity
End 2013 Debt Profile EA Govt Debt Securities - Avg. Weighted Maturity
*excludes programme loans. Ireland’s maturity including these loans is still similar. 35
Source: NTMA;ECB
RESTRICTEDIreland: “A”grade from all major credit rating agencies
Date of last
Rating Agency Long-term Short-term Outlook/Trend
change
Standard & Poor's A+ A-1 Stable June 2015
Fitch Ratings A+ F1+ Stable Dec 2017
Moody's A2 P-1 Stable Sept 2017
DBRS A(high) R-1 (middle) Stable March 2016
R&I A a-1 Stable Jan. 2017
36
Source: Bloomberg
RESTRICTEDStructure of Irish
economy is sound
Ireland’s young population helps to
cement long-term debt sustainability
RESTRICTEDIreland’s population profile healthier than the EU average,
making its bonds an attractive long-term investment
Ireland’s population jumped to 4.86m in 2017 Ireland’s population will remain younger
– up 280,000 on the 2011 Census than most of its EA counterparts
2.0% Japan
1.8% % of population in age cohort Spain
Portugal
1.6% Italy
Greece
1.4%
Germany
1.2% Finland
France
1.0% Ireland
0.8% Belgium
OECD - Total
0.6% 47% of Ireland’s Sweden
population aged 34 or United Kingdom
0.4% below versus 39% for EU China
0.2% United States
World
0.0%Ireland has benefitted from highly productive FDI
HP LI Highly Productive LI HP Labour Intensive
70 30%
60 25%
50
20%
40
15%
30
10%
20
10 5%
0 0%
GVA (€bns) Employment (% of Total, RHS)
Source: CSO , NTMA calculations, 2017 data 39
RESTRICTEDExports and foreign equity capital have driven the Irish
recovery in contrast to the credit-fuelled previous cycle
Credit growth still around zero – yet Growth driven by exports like original
economy has rebounded “Celtic Tiger” economy of 1994-2001
40 230 130
35
210 110
30
25 190 90
20
170 70
15
10
150 50
5
0 130 30
-5
110 10
-10
-15 90 -10
2005
2004
2006
2006
2007
2008
2009
2010
2011
2012
2013
2014
2015
2016
2017
2017
2009 2010 2011 2012 2013 2014 2015 2016 2017 2018
Credit advanced to Business (y-o-y) Contract Manufacturing* Services
Lending for house purchase (y-o-y) Goods ex. CM Exports
Source: CBI Source: CSO, * Contract Manufacturing proxy
40
RESTRICTEDIreland is the most competitive it has been for 15 years;
too soon to ask questions about overheating
Nominal Labour Cost Ratio – IE vs Euro Area Unemployment back towards 1999-2007
level, but wage growth less than half
115 7.0%
Aug
6.0% 2018
110 5.6%
5.0%
4.0%
105
3.0%
2018f
100 2.0%
1.0%
95
Ireland competitive
0.0%
versus euro area
Unemployment Comp. of Emp. per
employee growth
90
2001 2003 2005 2007 2009 2011 2013 2015 2017 Annual Averages (1999-2007)
Source: Eurostat, NTMA analysis *Ratio = IE Nom. Labour
Source: CSO, Eurostat
Costs/ EA Nom. Labour Costs
41
RESTRICTEDAppendix
RESTRICTEDThe primary role of the National Treasury Management Agency
(NTMA) is to manage Ireland’s Government debt
• The Government of Ireland delegates a number of financial functions to the NTMA – a public sector body
outside the civil service
Responsible for borrowing on behalf of the Government and managing the National Debt. The NTMA’s
goal is to ensure that the State is liquid and interest cost is minimised.
Acting as the State Claims Agency, the NTMA manages personal injury, property damage and clinical
negligence claims brought against certain State authorities.
NewERA (New Economy and Recovery Authority) provides centralised corporate financial advice and
services to Ministers of the Government and commercial semi-State entities.
NTMA also runs the Ireland Strategic Investment Fund – a sovereign development fund with a mandate
to invest commercially in a manner designed to support economic activity and employment in Ireland.
Acting as the National Development Finance Agency (NDFA), the NTMA is the statutory financial advisor
to State authorities in respect of all public investment projects with a capital value over €20m.
• The mission of the NTMA is to “manage public assets and liabilities commercially and prudently”.
43
RESTRICTEDNational Development Plan 2018 – 2027
Investment priorities
• The National Development Plan sets out
the investment priorities that will
underpin the successful implementation of
the new National Planning Framework
(NPF).
• This will guide national, regional and local
planning and investment decisions in
Ireland over the next two decades, to
cater for an expected population increase
of over 1 million people.
Source: National Development Plan 44
RESTRICTED 2018-2027National Development Plan 2018 – 2027
Projected €23 billion Exchequer spending on green projects
• DART (Dublin Area Rapid Transit) Expansion €2 bn
• Metro Link €3 bn
Sustainable Mobility - €8.6 billion
• BusConnects €2.4 bn
EGC: Clean Transportation
• Other Projects/Programmes €1.2 bn
Sustainable Management of Water
and Environmental Resources – • Waste water quality and capacity,
€6.8 billion • Improve drinking water quality and capacity
Eligible Green Category Infrastructure projects: €6.6 bn
(EGC): Sustainable Water and • Rural Water Programme €0.2 bn
Wastewater Management
Transition to a Low carbon and •Energy Efficiency Housing Retrofit €3 bn
Climate Resilient Society - €7.6
•Energy Efficiency in Public Buildings €0.8 bn
billion
•Boiler Replacement €0.7 bn
EGC: Built Environment / Energy
•Flood Defences €1 bn
Efficiency, Renewable Energy,
Climate Change Adaptation •Other Projects/Programmes €2.1 bn
Source : National Development Plan 45
RESTRICTED 2018-2027National Policy Position on Climate Action and
Low Carbon Development
Ireland’s National Policy Position on Climate Action and Low Climate Action
Carbon Development, 2014 and Low Carbon Development Act, 2015
Provides a high-level policy direction for the Provides the statutory basis for the national
adoption and implementation by Government of transition objective laid out in the national
plans to enable the State to move to a low carbon policy position.
economy by 2050.
The National Policy Position objective for 2050: As provided for in the 2015 Act, in order to
2019
• An aggregate reduction in carbon emissions of pursue and achieve the national transition
at least 80% (compared to 1990 levels) by 2050 objective, the Minister for Communications,
across the electricity generation, built Climate Action and Environment must make
environment and transport sectors . and submit to Government a series of
• In parallel, an approach to carbon neutrality in successive National Mitigation Plans (NMPs)
the agriculture and land use sector, including and National Adaptation Frameworks (NAFs).
forestry, which does not compromise capacity
for sustainable food production.
Source: National Policy Position on Climate 46
RESTRICTED Action and Low Carbon Development ActNational Adaptation Framework
Planning for a climate resilient Ireland
• Approved by Government in December 2017 and
published in January 2018
• Under the NAF, seven Government Departments
(or Agencies, where appropriate) with
responsibility for twelve priority sectors are
required to prepare Sectoral Adaptation Plans
• Sectoral plans to be submitted to Government for
approval by 30 September 2019
• Local Authorities to prepare Local Adaptation
Strategies by same date
• Climate Action Regional Offices being established
to support local and regional climate action
Source: National Adaptation Framework 47
RESTRICTEDThe Sustainable Development Goals National Implementation Plan
Ireland’s plan to implement the 17 UN Sustainable Development Goals (SDGs)
The Sustainable Development Goals National
Implementation Plan 2018 - 2020 is in direct Ireland’s SDG Reporting Schedule 2018-2030
response to the 2030 Agenda for Sustainable
Development and provides a whole-of-
government approach to implement the 17
Sustainable Development Goals (SDGs).
The Plan identifies four strategic priorities to
guide implementation:
• Awareness: raise public awareness of the
SDGs;
• Participation: provide stakeholders
opportunities to engage and contribute to
follow-up and review processes, and
further develop national implementation
of the Goals;
• Support: encourage and support efforts of
communities and organisations to
contribute towards meeting the SDGs, and
foster public participation; and
• Policy alignment: develop alignment of
national policy with the SDGs and identify
opportunities for policy coherence.
Source: SDG Implementation Plan 48
RESTRICTEDIreland’s strong fundamentals highlighted by performance
on United Nations sustainability index
Vs.
Index Score
Selected Countries Global Rank Ireland Global rank Regional
(0-100)
Average
Sweden 1 85.6
Denmark 2 84.2 Subjective Wellbeing
13/133
(2016)
Finland 3 84.0
Norway 4 83.9
Czech Republic 5 81.9 Environmental Performance Index
19/155
(2016)
Germany 6 81.7
France 10 80.3
Belgium 12 80.0 Human Development Index
8/157
United Kingdom 16 78.3 (2016)
Ireland 19 77.9
Spain 25 76.8
Global Competitiveness Index
21/134
Portugal 28 75.6 (2016/17)
Italy 30 75.5
Luxembourg 33 75.0
Global Peace Index
Greece 38 72.9 12/149
(2016)
United States 42 72.4
Source: United Nations SDG project 49
RESTRICTEDIrish Sovereign Green Bond Framework
Use of proceeds and alignment with UN Sustainable Development Goals
Eligible Green Examples of Eligible Green Environmental Alignment with
Alignment with SDGs
Categories1 Projects Objectives the NDC
Sustainable Water and • Clean water and wastewater treatment • Natural resource
1 • Waste
Wastewater Management projects conservation
• Public transportation initiatives, low
• Climate change
emission vehicles incentives and
mitigation; Pollution
2 Clean Transportation infrastructure, and alternative fuels • Energy
prevention and
• Public programmes incentivizing modal
control
shift away from private car use
• Biodiversity
Environmentally • Grants, subsidies, and support schemes
conservation;
designed to reduce agricultural
Sustainable Management Climate change • Land Use, Land-Use
3 environmental impacts
of Living Natural mitigation; natural Change and Forestry
• Afforestation, restoration and
Resources and Land Use resource
conservation programmes
conservation
• Support scheme for renewable heat • Climate change
• Research and development for the mitigation; Pollution
4 Renewable Energy • Energy
commercialization of renewable energy prevention and
technologies control
• Support schemes for residential energy
Built Environment / • Climate change
5 efficiency programmes (including • Energy
Energy Efficiency mitigation
heating, retrofit, insulation)
Climate Change • Flood relief and other risk mitigation • Climate change
6 • n/a
Adaptation programmes adaptation
50
Source: 2018 Green Bond Principles, UN Sustainable
RESTRICTED
Development goals & Nationally Determined ContributionIreland’s Voluntary National Review 2018
SDG Trend SDG Trend
• People at risk of poverty or social exclusion in Ireland was above • As a percentage of GDP. Ireland’s gross domestic expenditure on
the EU average in 2015 at 26% R&D is below the EU average for 2017
• Ireland’s results relative to the rest of the EU are mixed with
• Highest level of Government support to agricultural research and 2016 purchasing power adjusted GDP per capita in Ireland
development per capita within the EU in 2016 significantly above the EU
• 2015 data suggests Ireland has the 4th lowest rates of people
• EU indicators for this Goal suggest that Ireland is making good living in overcrowded conditions among EU Member States
progress under SDG 3
• Ireland’s resource productivity, increased between 2001 and
2016, during which period it exceeded the EU average
• Based on EU indicators, Ireland performs strongly in relation to
education and skills under this Goal
• CO2 equivalent emissions in tonnes per capita reduced to 13.3 in
2015 versus 18.6 in 2001
• Percentage of Irish women [aged 15-74] who have experienced
physical/sexual violence was in line with the EU average at 8% • Compared to other EU States with fishing fleets, Ireland’s catches
from major fishing areas decreased in 2016 versus 2001
• At 65%, Ireland was in 2014 in the bottom half of EU countries in
terms of percentage of the population connected to at least
• EU and OECD indicators provide a mixed picture of Ireland’s
secondary wastewater treatment
performance under Goal 15
• Ireland’s performance under these indicators is mixed relative to
• Ireland is, by global and EU standards a highly peaceful and safe
other EU countries
country
• Employment rate above the EU average and the number of Irish
young people neither in employment nor in any education/ • Working in partnership with others is central to Ireland’s
training in line with the EU average in 2017 approach to international cooperation
SDGs aligned with the Irish Sovereign Green Bond Framework
51
RESTRICTED Source: Ireland: Voluntary National Review 2018Irish Sovereign Green Bond Framework
Use of Proceeds Exclusions
Projects that support or promote the following activities will not be eligible under this Framework as
Eligible Green Projects:
Burning of fossil fuel for power generation and transportation (apart from mass-transit and
compressed natural gas / hybrid vehicles),
Rail infrastructure dedicated for transportation of fossil fuels
Nuclear power generation
Large scale hydro projects – including technology and equipment (i.e. projects that generate greater than 20 MW
of electricity)
Transmission infrastructure and systems where 25% or more of electricity transmitted to the grid is fossil-fuel-
generated
Alcohol, weapons, tobacco, gaming, or palm oil industries
Source: ISGB Framework 52
RESTRICTEDImpact indicators examples
Eligible Green Categories Examples of Potential Key Environmental Impact Indicators
Sustainable Water and Wastewater Water network leakage %
Management Number of discharges with no treatment or preliminary treatment only
Clean Transportation Number of public transport passenger journeys
Number of electric vehicle purchase grants
Number of electric vehicle charger grants
Environmentally Sustainable Carbon dioxide and ammonia emissions reductions (tonnes)
Management of Living Natural Number of hectares of forest planted
Resources and Land Use
Renewable Energy Percentage of renewable heat
Energy Efficiency Carbon dioxide reductions (tonnes)
Climate Change Adaptation Flood defences
Source: ISGB Framework 53
RESTRICTEDEnergy Efficiency - Building Energy Rating BER
The BER rating scale is divided into categories from G (largest primary energy
usage) to an A1 rating (lowest primary energy usage).
The kilowatt hour is the unit of energy used in Dwelling Energy Assessment
Procedure (DEAP). The BER is measured in kWh per square meter of floor area of
the dwelling per year (kWh/m2/year).
Domestic Sector: Earliest compared with most recent BER (2009-2018)
Source: Central Statistics Office 54
RESTRICTEDSources and Useful Links
Document Source
Irish Sovereign Green Bond Framework http://www.ntma.ie/business-areas/funding-and-debt-management/irish-sovereign-green-
bond-documents/
Sustainalytics Second Party Opinion on Framework http://www.ntma.ie/wp-content/uploads/2018/09/Ireland-Green-Bond-SPO.pdf
National Policy Position htts://www.dccae.gov.ie/en-ie/climate-action/publications/Pages/National-Policy-
Position.aspx
Climate Action and Low Carbon Development Act http://www.irishstatutebook.ie/eli/2015/act/46/enacted/en/html
National Development Plan https://www.per.gov.ie/en/national-development-plan-2018-2027/
National Mitigation Plan https://static.rasset.ie/documents/news/national-mitigation-plan-2017.pdf
National Adaptation Framework https://www.dccae.gov.ie/documents/National%20Adaptation%20Framework.pdf
The Sustainable Development Goals National https://www.dccae.gov.ie/en-ie/news-and-media/publications/pages/sdgs-national-
Implementation Plan implementaion-plan.aspx
UN Sustainable Development Goals https://www.un.org/sustainabledevelopment/sustainable-development-goals/
Ireland: Voluntary National Review 2018 https://www.dccae.gov.ie/documents/Ireland%20Voluntary%20National%20Review%202018.
pdf
Nationally Determined Contribution http://www4.unfccc.int/ndcregistry/pages/Party.aspx?party=IRL
55
RESTRICTEDSources and Useful Links
Document Source
Green Bond Principles 2018 https://www.icmagroup.org/green-social-and-sustainability-bonds/green-bond-
principles-gbp/
Irish Water National Projects https://www.water.ie/projects-plans/national-projects/
Investment Projects and Programmes Tracker – Project https://www.per.gov.ie/en/investment-projects-and-programmes-tracker/
Ireland 2040 Capital Tracker
Water Services Policy Statement https://www.water.ie/projects-plans/national-projects/leakage-reduction-programme/,
Strategy for the Future Development of National and http://www.dttas.ie/sites/default/files/publications/tourism/english/strategy-future-
Regional Greenways development-national-and-regional-greenways/greenways-strategy.pdf
The Office of Public Works https://www.opw.ie/en/floodriskmanagement/floodriskmanagementoperations/majorflo
oddefenceschemes/
Córas Iompair Éireann (CIÉ) Annual Report 2017 https://www.cie.ie/AR/CIE/2017AR-CIE-English.pdf
Department of Agriculture, Food and the Marine https://www.agriculture.gov.ie/forestservice/
Forestry Programme 2014 – 2020 https://www.agriculture.gov.ie/media/migration/forestry/forestryprogramme2014-
2020/IRELANDForestryProgramme20142020230215.pdf
Sustainable Energy Authority Ireland https://www.seai.ie/about/
Central Statistic Office – Domestic Building energy https://www.cso.ie/en/releasesandpublications/er/dber/domesticbuildingenergyratingsq
Rating uarter22018/
WindEurope.org -Wind in Power 2017 https://windeurope.org/wp-content/uploads/files/about-wind/statistics/WindEurope-
Annual-Statistics-2017.pdf
56
RESTRICTEDDisclaimer
The information in this presentation is issued by the National Treasury Management Agency (NTMA) for
informational purposes. The contents of the presentation do not constitute investment advice and should
not be read as such. The presentation does not constitute and is not an invitation or offer to buy or sell
securities.
The NTMA makes no warranty, express or implied, nor assumes any liability or responsibility for the accuracy,
correctness, completeness, availability, fitness for purpose or use of any information that is available in this
presentation nor represents that its use would not infringe other proprietary rights. The information
contained in this presentation speaks only as of the particular date or dates included in the accompanying
slides. The NTMA undertakes no obligation to, and disclaims any duty to, update any of the information
provided. Nothing contained in this presentation is, or may be relied on as a promise or representation (past
or future) of the Irish State or the NTMA.
The contents of this presentation should not be construed as legal, business or tax advice.
57
RESTRICTEDYou can also read