Green Bond Framework and Inaugural Green Bond Issuance - INVESTOR PRESENTATION July 2021 - Banca Popolare di ...
←
→
Page content transcription
If your browser does not render page correctly, please read the page content below
Green Bond Framework and Inaugural Green Bond Issuance – INVESTOR PRESENTATION July 2021
TABLE OF CONTENTS

1   BPS AT A GLANCE

2   BANCA POPOLARE DI SONDRIO’S COMMITMENT TOWARDS SUSTAINABILITY

3   BANCA POPOLARE DI SONDRIO’S GREEN BOND FRAMEWORK

4   INTENDED INAUGURAL GREEN BOND TRANSACTION AND PORTFOLIO OVERVIEW

                                                                    2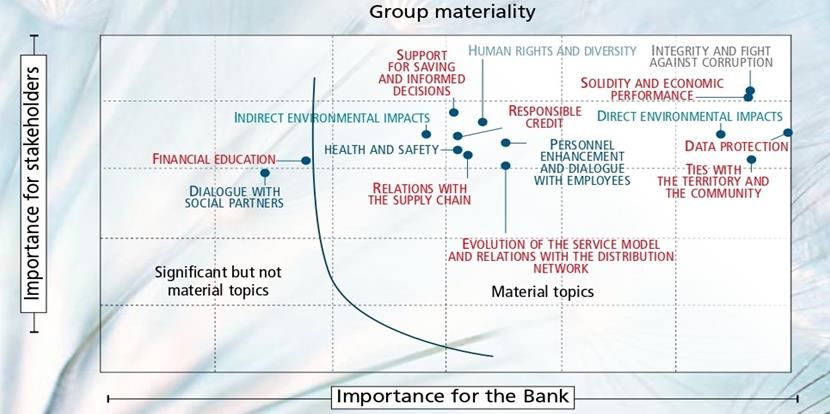
TABLE OF CONTENTS

1   BPS AT A GLANCE

2   BANCA POPOLARE DI SONDRIO’S COMMITMENT TOWARDS SUSTAINABILITY

3   BANCA POPOLARE DI SONDRIO’S GREEN BOND FRAMEWORK

4   INTENDED INAUGURAL GREEN BOND TRANSACTION AND PORTFOLIO OVERVIEW
KEY MILESTONES IN BPS HISTORY

1871: BANCA POPOLARE DI SONDRIO ESTABLISHED IN SONDRIO

1978: OPENING OF THE FIRST BRANCH IN MILAN

1990: OPENING OF THE MAIN BRANCH IN ROME

1991: LISTING ON THE “RISTRETTO” MARKET IN MILAN

1995: BANCA POPOLARE DI SONDRIO (SUISSE) SA ESTABLISHED IN LUGANO

1995: “BANCA POPOLARE DI SONDRIO BANKING GROUP” ESTABLISHED

2010: ACQUISITION OF THE CONTROLLING STAKE OF FACTORIT

2017: FULL ACQUISITION OF BANCA DELLA NUOVA TERRA

2017: RENEWAL OF BANCASSURANCE PARTNERSHIP WITH ARCA VITA

2018: FULL ACQUISITION OF PRESTINUOVA

2019: ACQUISITION OF A FURTHER 15.7% OF ARCA HOLDING                4
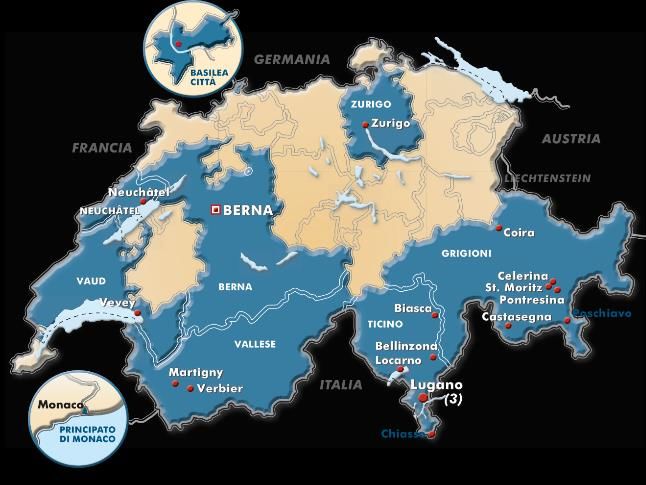
GEOGRAPHICAL DISTRIBUTION

                         6
                                          483 points of sales:
 1
               255           7            • 349 Branches
     15
                                          • 134 «Tesorerie» (Light branches)
                                          with a presence in:
                         8
          13                              • 34 Provincies
                                          • 8 Regions
                                            Banking group’s employees:
                                                       3,343
                                                                               20 branches in 8 cantons:
                                 44                                            Lugano, Basilea, Bellinzona, Berna, Biasca,
                                                                               Castasegna, Celerina, Chiasso, Coira, Locarno,
                                                                               Martigny, Neuchâtel, Pontresina, Poschiavo, St.
                                                                               Moritz, Verbier, Vevey, Zurigo.
                                                                               Principato di Monaco: Monaco

                                                                               5 branches in:
                                                                               • MILANO
                                                                               • TORINO
                                                                               • PADOVA
                                                                               • ROMA
                                                                               • BOLOGNA
                                                                               and over 400
                                                                               correspondents in
     Number of branches in the region.
                                                                               the main
SOURCE:                                                                        international
Company’s data as of 31/03/2021.                                               markets.
                                                                                                                                 5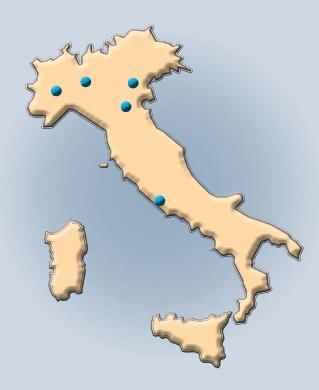
COMPETITIVE POSITIONING AND FINANCIAL RATINGS

                        TOTAL ASSETS1 [€ bio.]                                                              BRANCHES IN ITALY1
                                                                                      4,671
1,000.6
          942.2

                                                                                               2,229
                                                                                                       1,820 1,808
                                                                                                                     1,418
                  197.2 146.7
                              129.0                                                                                          426   355   349
                                             59.5 51.1 25.3 17.2                                                                               243

 Peer1 Peer2 Peer3 Peer4 Peer5 Peer6                  BPS     Peer7 Peer8             Peer1 Peer2 Peer5 Peer3 Peer4 Peer6 Peer7          BPS   Peer8

                                                                     FINANCIAL RATINGS

           Rating updated on                                          Rating updated on
           25 September 2020                                          16 November 2020                                 Rating updated on
          Long term: BB+                                                                                                 31 March 2021
                                                                 Long term: BBB (low)
          Short term: B                                          Short term: R-2 (middle)                             Long term: BBB-
          OUTLOOK: NEGATIVE                                      OUTLOOK: NEGATIVE                                    OUTLOOK: STABLE

 NOTES:
 [1] Info from corporate documents as at 31/03/2021.
 Peers: BancoBPM, Bper, Credem, Creval, Desio, Intesa Sanpaolo, Monte dei Paschi Siena, Unicredit.
                                                                                                                                                       6
MEDIUM AND LONG-TERM PROFITABILITY

    BPS NET RESULT [€ mio.]
                                                                                                                                                         857.1
    BPS GROUP NET RESULT [€ mio.]                                                                                                              655.4

  97.6 115.2     100.1 129.3        80.0    98.6        118.4 159.2     83.6 110.8             100.7 137.4             75.0 106.6
 DECEMBER 2014   DECEMBER 2015     DECEMBER 2016       DECEMBER 2017   DECEMBER 2018          DECEMBER 2019          DECEMBER 2020                   TOTAL -
                                                                                                                                                   2014 / 2020
     BPS ROE      BPS GROUP ROE
                                                               6.3%
  4.6% 5.0%              5.3%                           5.1%                                            5.1%
                  4.5%
                                   3.6% 4.0%                            3.7% 4.4%              4.2%                                           4.1% 4.8%
                                                                                                                       2.9% 3.7%

 DECEMBER 2014   DECEMBER 2015    DECEMBER 2016        DECEMBER 2017   DECEMBER 2018          DECEMBER 2019         DECEMBER 2020              AVERAGE -
                                                                                                                                               2014 / 2020

PAYOUT VS RETAINED EARNINGS [Volumes’ average 2014-2020]                                        DIVIDEND PER SHARE [€]

                                                                                                                                Total dividend paid:
                                                                                                                                    167.8 € mio.
                                                                                       0.07                     0.07
                                 24.6%
                                                                          0.06                     0.06                                                0.06
                                                                                                                            0.05

            75.4%
                                                                                                                                            0.00
                                         % PAY - OUT
                                                                          2014         2015        2016         2017        2018            2019        2020
                                         % RETAINED EARNINGS
                                                                        NOTE: [*] Dividend not paid in accordance with ECB recommendation                        7
FINANCIAL INDICATORS
Profitability and Efficiency 31 MARCH 2021 Structure 31 MARCH 2021
ROE 1 7.9%
> 5% LOANS TO CUSTOMERS/TOTAL ASSETS 57.9%
COST-INCOME RATIO 56.6% DIRECT FUNDING/TOTAL LIABILITIES 69.5%
2
COST OF RISK 0.39% LOANS TO DEPOSIT 90.7%
FINANCIAL LEVERAGE 3 16.93
Credit quality 31 MARCH 2021 Capital Adequacy 31 MARCH 2021
GROSS NPL RATIO 7.37% CET 1 RATIO [Phased-in] 16.57%
INCIDENCE NET BAD LOANS 4 1.16% CET 1 RATIO [Fully-Phased] 16.41%
COVERAGE NPL 53.0% TOTAL CAPITAL RATIO 18.70%
TEXAS RATIO 5 35.6% LEVERAGE RATIO 6.0%
LCR 293%
NSFR >100%
NOTES:
[1] Net equity – Net result for the period. In coherence with the YE target reported in the Press release of 10 May 2021.
[2] Net loans to customers/Due to customers
[3] Total assets/(Net equity – Intangible assets)
[4] Net bad loans/net loans to customers
[5] Net NPLs/(Net equity – Intangible assets) 8FINANCIAL HIGHLIGHTS
€ mio. 31 MARCH 2021 31 MARCH 2020 Difference %
Net interest income 129,1 112,2 15,1%
Net fee and commission income 84,8 78,9 7,4%
Results of financial activities * 32,1 -59,1 -
Total income 246,9 132,7 86,0%
Net adjustments to loans and financial assets -28,9 -65,3 -55,8%
Operating costs 139,6 138,1 1,1%
Gross result 86,8 -64,5 -
Net result 59,3 -46,5 -
€ mio. 31 MARCH 2021 31 DECEMBER 2020 Difference %
Direct funding from customers 35.521 35.559 -0,1%
Indirect funding from customers 36.223 34.797 4,1%
o/w Asset under Management 6.229 5.965 4,4%
Direct funding from insurance premiums 1.760 1.717 2,5%
Customer assets under administration 73.503 72.074 2,0%
Loans and receivables with customers 29.600 29.380 0,8%
NOTE: [*] Without dividends
9FOCUS ON CORE BANKING ACTIVITIES
INTEREST INCOME [€ mio.] NET COMMISSIONS [€ mio.]
15.1%
+7.4%
129 7%
85 21%
112 79 Guarantees given
Management and intermediation services
31 MARCH 2021
Collection and payment services
30%
10% 89 Services for factoring transactions
Management of current accounts
Other services
6%
25%
31 MARCH 2020 31 MARCH 2021 31 MARCH 31 MARCH
2020 2021
QUARTERLY TREND [€ mio.]
+7.4%
+15.1%
87 85
129 128 129 79 77 -2.3%
121 +1.0% 73
112
Q1-2020 Q2-2020 Q3-2020 Q4-2020 Q1-2021 Q1-2020 Q2-2020 Q3-2020 Q4-2020 Q1-2021
Interest income Net commissions 10FOCUS ON FUNDING AND LOANS
TOTAL FUNDING [€ mio.]
+2% TLTRO III FUNDING
6%
1,600 € mio. Exp. 21/12/2022
44,395 20%
43,627
31 MARCH 2021
44,395 2,100 € mio. Exp. 29/03/2023
41,261
39,857 74%
25.1% 4,368 € mio. Exp. 28/06/2023
FUNDING FROM CUSTOMERS
35,322 35,487 806 € mio.
ECB Exp. 27/03/2024
BONDS
31 31 MARCH 30 JUNE 30 31 31 MARCH
DECEMBER 2020 2020 SEPTEMBER DECEMBER 2021 8,874 € mio. Total exposure
2019 2020 2020
NET LOANS TO CUSTOMERS [€ mio.]
+1%
1% MORTGAGE LOANS
29,600 5% 4% OTHER UNSECURED LOANS
29,380 CURRENT ACCOUNT
7% 2%
38%
31 MARCH 2021
28,727 28,841 2% FACTORING
OTHER *
7.2% 11% 29,600 FOREIGN CURRENCY LOANS
REPO TRANSACTIONS
27,619 PERSONAL LOANS
27,387
BAD LOANS
31%
31 31 MARCH 30 JUNE 2020 30 31 31 MARCH
DECEMBER 2020 SEPTEMBER DECEMBER 2021
2019 2020 2020 NOTE: [*] Advances, STC advances, discounted portfolio, loans and mortgages
to artisans , agricultural loans , debt notes
11FOCUS ON DIRECT & INDIRECT FUNDING
DIRECT FUNDING FROM CUSTOMERS [€ mio.]
+1.8%
-0.3% 8% 1% 18%
1%
8%
32,878 32,791 1%
31 MARCH 2021
35,521 2,729
56%
25%
2,681 2,729 81%
31 DECEMBER 2020 31 MARCH 2021
CURRENT ACCOUNTS SAVING DEPOSITS UNSECURED
DUE TO CUSTOMERS BONDS BONDS TIME DEPOSITS ACCOUNTS SUBORDINATED
DEPOSITS IN FOREING CURRENCIES OTHER * COVERED BONDS
INDIRECT FUNDING FROM CUSTOMERS [€ mio.]
+2.5%
+4.0% 5%
+4.4% 16%
29,994
28,832
31 MARCH 2021
5,965 6,229 37,982
1,717 1,760
31 DECEMBER 2020 31 MARCH 2021 79%
ASSETS UNDER MANAGEMENT ASSETS UNDER CUSTODY DIRECT FUNDING FROM INSURANCE PREMIUMS
NOTE: [*] Repo, certificates of deposit, leasing liabilities, cashier checks and other 12FOCUS ON ASSET QUALITY
VOLUMES (€ mio.) WEIGHT (%) RATIOS (%) COVERAGE
31 MARCH 2021
GROSS NET GROSS NET GROSS NET %
TOTAL NPLs 2,286 1,074 100% 100% 7.37% 3.63% 53.03%
o/w PAST DUE 73 64 3.21% 6.00% 0.24% 0.22% 12.13%
o/w UNLIKELY TO PAY 1,131 666 49.47% 62.07% 3.65% 2.25% 41.06%
o/w BAD LOANS 1,082 343 47.33% 31.92% 3.49% 1.16% 68.32%
PERFORMING LOANS 28,724 28,527 - - 92.63% 96.37% 0.69%
TOTAL LOANS 31,010 29,600 - - 100.00% 100.00% 4.54%
TOTAL GROSS NPLs [€ mio.] GROSS NPL RATIO NET NPL RATIO
-38% 12.30% 5.37%
3,683
2011: 5,51% 2011: 4,04%
2,788 2,756 4.44%
9.17% 9.03% 4.28%
2,292 2,286
7.45% 7.37% 3.72%
3.63%
30 JUNE 2020
30 JUNE 2020
30 JUNE 2020
31 DECEMBER 2020
31 DECEMBER 2020
31 DECEMBER 2020
30 SEPTEMBER 2020
30 SEPTEMBER 2020
30 SEPTEMBER 2020
31 MARCH 2020
31 MARCH 2021
31 MARCH 2020
31 MARCH 2021
31 MARCH 2020
31 MARCH 2021
13FOCUS ON PROPRIETARY PORTFOLIO AND
RETURN ON FINANCIAL ASSETS
SECURITIES PORTFOLIO [€ mio.] ITALIAN GOVIES PORTFOLIO [€ mio.]
+9% +9%
WEIGHT ON TOTAL PORTFOLIO
11,492 6,367
5,951 5,733 6,020 5,989 5,857
+11%
10,553
10,174 10,234 +23% 61% 61% 59% 59% 56% 55%
9,723
9,356
31 31 MARCH 30 JUNE 30 31 31 MARCH 31 31 MARCH 30 JUNE 30 31 31 MARCH
DECEMBER 2020 2020 SEPTEMBERDECEMBER 2021 DECEMBER 2020 2020 SEPTEMBERDECEMBER 2021
2019 2020 2020 2019 2020 2020
BREAKDOWN BY PORTFOLIO [%] RETURN ON FINANCIAL ASSETS [€ mio.]
10%
67.0% 69.8% 67.8% 67.1% 64.9% 31 MARCH 2021
71.5%
34% 32,1
56%
26.7% 23.8% 22.5% 25.1% 24.8% 27.4%
6.3% 6.4% 6.0% 7.1% 8.0% 7.7% 0%
31 31 MARCH 30 JUNE 30 31 31 MARCH
DECEMBER 2020 2020 SEPTEMBER DECEMBER 2021
NET TRADING INCOME
2019 2020 2020
NET HEDGING INCOME
Held to collect (HTC) Trading NET GAINS FROM SALES OR REPURCHASES
Held to collect and sell (HTCS) NET GAINS ON FINANCIAL ASSETS AND LIABILITIES AT FVTPL 14FOCUS ON CAPITAL AND LIQUIDITY POSITION
CAPITAL POSITION
18.93 18.55 18.70
16.04 16.32 16.57
SREP REQUIREMENTS
13.44 13.55 13.66 13.61
11.28 10.49 11.60 12.03
11.07
9.75 CET1 RATIO
8.69%
TOTAL CAPITAL RATIO
13.50%
31 31 31 31 31 31 31 31 MARCH
DECEMBER DECEMBER DECEMBER DECEMBER DECEMBER DECEMBER DECEMBER 2021 *
[*] AT 31/03/2021
2014 2015 2016 2017 2018 2019 2020
CET1 RATIO FULLY PHASED: 16.41%
TOTAL CAPITAL FULLY PHASED: 18.54%
Common Equity Tier 1 Ratio - PHASED IN Total Capital Ratio - PHASED IN
LIQUIDITY POSITION & ELIGIBLE ASSETS
31/03/2021 9,516
(66.8%)
31 MARCH 2021
LCR RATIO
293%
4,724
(33.2%)
NSFR RATIO
> 100%
UNENCUMBERED ELIGIBLE ASSETS
ENCUMBERED ELIGIBLE ASSETS
15COVID-19 SUPPORTING MEASURES
BPS PLAYED AN ACTIVE ROLE IN SUPPORTING HOUSEHOLDS AND BUSINESSES BY:
1. Guaranteeing operational continuity both through the branch network and the online banking
solutions developed over the years and further strengthened during the crisis.
2. Granting loans (new disbursements as of 31/03/2021 from 31/03/2020 of around 2.3 € bio. of state
guaranteed loans; around 21,000 approved proposals).
3. Granting moratoria (around € 4.7 bio. residual debt, over 24,000 finalized proposals, around 16% of
the loan book o/w 59% PMI and 17% households).
Data in € bio. ≈ 4.700
≈ 7.000
≈ 2.300
Moratoria State guaranteed
Total support Moratoria
loans
# of proposals
> 24,000
> 45,000
≈ 21,000
Moratoria State guaranteed
Total support Moratoria
loans
As of 31/03/2021 still in place moratoria for around 2.6 € of residual debt. On the moratoria already
expired, the first management data relating to the punctuality of payments are comforting.
16TABLE OF CONTENTS
1 BPS AT A GLANCE
2 BANCA POPOLARE DI SONDRIO’S COMMITMENT TOWARDS SUSTAINABILITY
3 BANCA POPOLARE DI SONDRIO’S GREEN BOND FRAMEWORK
4 INTENDED INAUGURAL GREEN BOND TRANSACTION AND PORTFOLIO OVERVIEW
17BANCA POPOLARE DI SONDRIO’S HISTORICAL COMMITMENT
Mutuality
Since its foundation in 1871, the Bank has directed its action to the satisfaction
of the different stakeholders’ interests, associating the traditional objective of
pursuing profits with the identitary one of achieving a shared benefit. Ethics
In this perspective, the Group acts consistently to the UN Agenda 2030 e to the
UN Sustainable Development Goals (SDGs).
Reciprocity
Relevant
SDGs to
the
business
18SUSTAINABILITY GOVERNANCE
Role and Responsibilities
The Board of Directors:
Board level • Defines ESG guidelines, strategy and targets at Group
level;
• Oversights appropriately the ESG activities.
The Sustainability Committee at top management level,
which:
C-level
• Coordinates sustainability-related activities;
• Supports and gives proposals to the Board of Directors.
The Sustainability Organizational Unit, led by the
Responsible of Sustainability, which:
Operational level • Monitors the regulations update;
• Manages the ESG initiatives;
• Give support to the different banking areas involved in
sustainability activities.
19SUSTAINABILITY REFERENCE DOCUMENTS
Code of Ethics Sustainability Policy
It outlines the values and principles of It defines the principles, guidelines and
conduct, policies and regulations relevant sustainability themes that are
governing the Bank's activities and applies identified, implemented and monitored in
to each person operating or representing order to consider the interests of all the
the Bank directly or indirectly, contributing stakeholders, in the perspective of
to the implementation of corporate social continuous evolution.
responsibility. BPS most relevant sustainability themes
Environmental impacts
Social themes
development
Human resources
Fight against corruption
rights
Protection of human
20NON-FINANCIAL REPORTING and MATERIALITY MATRIX
BP Sondrio Group keeps a constant and solid interaction with all stakeholders in order to build further
consensus and trust and to express its responsibility towards the social environment in which it operates.
Mapping stakeholders and defining the most effective channels for them, constantly monitoring their
expectations, needs and opinions are paramount to efficiently engage them.
In order to better identify and track stakeholder interests, a materiality matrix is constantly updated. The
latest version identifies 13 material topics:
21GLOBAL COMMITMENT & SUSTAINABILITY RATING
BPS’ COMMITMENT BPS’ SUSTAINABILITY RATING
Banca Popolare di Sondrio has been participating in UN On March 9, 2021, Banca Popolare di
Global Compact since 2004, thus accepting the invitation of Sondrio was assigned a first time
the United Nations to synergistically involve the world of solicited rating of EE, attesting to the
business and non-governmental organizations in the great strong level of compliance achieved.
challenges of humanity. Furthermore, in 2018, the Bank
renewed its support for the Global Compact by joining, as a The agency states that Banca
founding member, the Italian network (Global Compact Popolare di Sondrio - at the head of
Network Italia - GCNI). the eponymous banking group -
over the years has constantly aligned
The Principles of the Global Compact have always been part
itself with international indications
of Banca Popolare di Sondrio's strategy and corporate
on sustainability, showing a regular
culture, as well as of the banking and financial activities it
progression that has concerned both
carries out on a daily basis. Therefore, as every year, the
corporate governance and
Bank confirmed its support to the initiative and reiterated
environmental issues, as well as
its commitment in the field of corporate sustainability by
social ones.
publishing its Communication on Progress (COP).
22ESG HIGHLIGHTS
A Sustainability Working Group was established in 2020 in order to
coordinate internal analysis and self-assessment activities on the impacts of
the Bank with regard to (i) environment and climate change, (ii) social issues
and (iii) governance structure.
Participation in the Carbon Disclosure Project (CDP) initiative for the first time
in 2020 through the completion of its Questionnaire on Climate Change
(minimum version), demonstrating transparency and accountability.
Participation to the Italian Banking Association (ABI) working tables on
Banking, Environment and Climate Change and Sustainability.
The Bank purchased the “ESGeo” software to collect and manage non-
financial data in order to optimize the Non Financial Reporting process.
In March 2021, the Bank launched its new institutional website: all the most
relevant initiatives concerning sustainability are included in a dedicated
section.
23ESG RISKS and OPPORTUNITIES
In 2020 BPS:
▪ has started implementing a comprehensive framework to identify, manage, control and monitor ESG-
related risks (especially operating and reputational ones) and their potential impact from an
economic/financial point of view; coherently with this the bank decided to expand its risk
management system to include ESG risks starting from:
(i) the best practices promoted at international level;
(ii) ECB and EBA guidelines;
(iii) the Recommendations published by the Task Force on Climate-related financial Disclosure
(TCFD).
▪ has started to identify and classify ESG opportunities (i.e. those components of ESG factors with a
positive impact on its business activities).
RISKS OPPORTUNITIES
A specific “ESG risks’ inventory” has been The identified opportunities have been linked to
developed with a focus on: Environmental (with sub-categories: Resources’
Efficiency, Sources of Energy, Products and Services,
❑ Environmental direct and indirect impacts; Markets, Resilience), Social and Governance aspects
and they refer to operating, commercial and
❑ Human rights and equality;
business activities.
❑ Social impact and connection with the local
These ESG opportunities are and will continue to
territory and community;
drive the ESG commitment of the Bank, aiming to
❑ Responsible lending policies. benefit all relevant stakeholders.
24ENVIRONMENTAL COMMITMENT
• Commitment to reduce the direct effects on the environment
generated by the consumption of resources (e.g. 98% of
renewable electricity is used), the generation of waste and all
other activities considered to have direct environmental impact
• Climate change is considered the main current challenge
• Identifying, monitoring and evaluation of performance
indicators in the context of the business
• aiming to adopt one or more specific climate-related targets
(especially for reduction of greenhouse gas emissions) and to
report on the progress made in achieving these targets
• The Bank intends to reduce its indirect environmental impact by
supporting its customers in the transition to sustainability
• Encouraging customers to manage their activities in a
sustainable manner through its offer of banking products and
services
• Providing loans for the purchase of high energy class
buildings, for the energy refurbishment of buildings/plants
and for the installation of systems for the production of
energy from renewable sources (photovoltaic, wind,
hydroelectric plants).
25SOCIAL & GOVERNANCE COMMITMENT
In order to mitigate the negative impacts of the pandemic, BP Sondrio
Group has activated a number of measures to support the economy and
local communities. Among the others:
SUPPORTING • Suspension of installment payments for reasons related to the
LOCAL emergency (moratoria) and State-guaranteed loans;
COMMUNITIES • Approval, on a voluntary basis, of others grants to specific target
DURING COVID- categories.
19 EMERGENCY
Most of the requests for payments moratoria came from families or, in
business activities, especially from hospitality, restaurants, travel agencies,
fashion, transport, storage and retailing.
The Group has always been committed to support the economic and social
development of the territories in which it operates. Among the others:
OTHER • Fondo di sostegno alla natalità - implemented in 2019 to support
ACTIVITIES TO families with one or more children;
SUPPORT LOCAL • Agorà - online platform providing specific contents (for example for
COMMUNITIES companies operating out of Italy);
• Business School - online platform offering webinars with a focus on
internationalization.
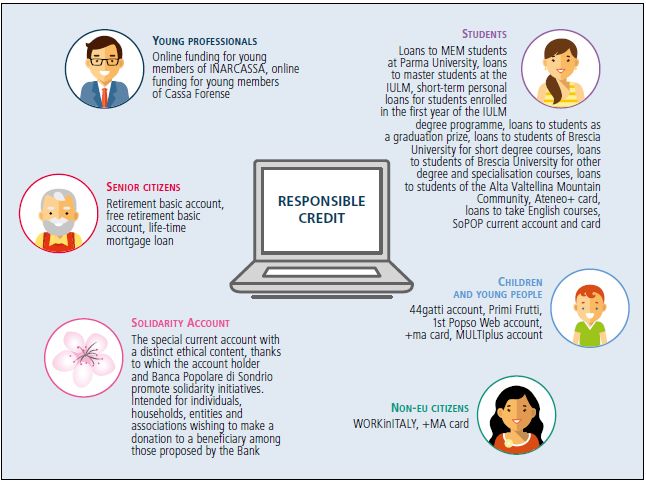
26RESPONSIBLE OFFERING The Bank is focused on the financing of socially disadvantaged groups, offering them ad-hoc products. BPS cooperates with Etica Sgr and is a placement agent of its funds in Italy. Etica Sgr is the only Italian asset manager to have set up and to manage exclusively socially responsible funds. For many years, the bank has also leveraged the expertise of Arca sgr (of which it is placement agent) which, within its offer, proposes various ESG funds. 27
TABLE OF CONTENTS

1   BPS AT A GLANCE

2   BANCA POPOLARE DI SONDRIO’S COMMITMENT TOWARDS SUSTAINABILITY

3   BANCA POPOLARE DI SONDRIO’S GREEN BOND FRAMEWORK

4   INTENDED INAUGURAL GREEN BOND TRANSACTION AND PORTFOLIO OVERVIEW

                                                                    28
BANCA POPOLARE DI SONDRIO’S GREEN BOND FRAMEWORK [1/2]
BPS is releasing its Green Bond Framework (“BPS Green Bond Framework”) to further underline its
commitment towards ESG. The Framework is aligned with the ICMA Green Bond Principles 2021.
• An amount equivalent to the net proceeds of Banca Popolare di
1 Sondrio‘s Green Bonds will be allocated exclusively to finance or
refinance new or existing Eligible Green Projects that meet BPS Green
Bond Framework Eligibility Criteria.
USE OF • The Green Eligible Categories are: Green Buildings, Renewable Energy,
PROCEEDS Clean Transportation, Energy Efficiency, Environmentally sustainable
management of living natural resources and land use, Pollution
prevention and control and Sustainable Water and Wastewater
Management.
2 • Banca Popolare di Sondrio established a Sustainability Committee
composed by top management (including the CEO) that will be
responsible, among other tasks, to review, monitor and approve Eligible
PROCESS FOR Green Projects according to BPS Green Bond Framework.
PROJECT • Green Projects will be mainly composed by corporate loans, mortgages
EVALUATION for residential or commercial energy-efficient buildings, assets related to
AND SELECTION the financing of the renovation of existing building or individual
renovation measures.
29BANCA POPOLARE DI SONDRIO’S GREEN BOND FRAMEWORK [2/2]
3 • The net proceeds can be attributed to Eligible Green Projects originated
or refinanced up to 36 months before the issuance year of the Green
Bond.
• The Bank undertakes to do everything in its power to allocate the
MANAGEMENT proceeds to Eligible Green Projects within a maximum of 36 months.
OF PROCEEDS • The net proceeds will be deposited in the general account and earmarked
for allocation to the Eligible Green Projects Portfolio.
• BPS is committing to report on an annual basis the use of proceeds and
4
impact reporting of the identified portfolio.
• BPS has obtained a Second Party Opinion from Sustainalytics.
• On an annual basis, an external auditor will carry out an independent
REPORTING AND review of:
THIRD PARTIES ․ use of proceeds associated with the selected Eligible Categories;
REVIEW ․ conformance with the Framework of the selected Eligible Green Projects;
․ allocation Reporting metrics.
301 USE OF PROCEEDS – ELIGIBLE CATEGORIES (1/4)
EU ENVIRONMENTAL
EXAMPLES OBJECTIVES /
ELIGIBLE CATEGORIES SDGS
(for all the details please refer to the Framework) ENVIRONMENTAL
BENEFITS
• Construction or acquisition of buildings belonging to
the top 15% of the most energy efficient buildings
(in Italy, an EPC class A, B and C as expanded in the
Annex) or buildings that have obtained LEED
certification of at least Gold, BREEAM certification Climate Change
of at least Excellent or Minergie certification. Mitigation
Green Buildings
---
• Renovation of existing buildings or individual Energy Savings
renovation measures that comply with one of the
following criteria: renovation leads to a reduction of
primary energy demand (PED) of at least 30% or at
least two steps of improvement in EPC label.
• Offshore and Onshore Wind.
• Concentrated Solar Power (“CSP”) / Solar
Photovoltaic (“Solar PV”). Climate Change
• Small scale Hydropower (1 USE OF PROCEEDS – ELIGIBLE CATEGORIES (2/4)
EU ENVIRONMENTAL
EXAMPLES OBJECTIVES /
ELIGIBLE CATEGORIES SDGS
(for all the details please refer to the Framework) ENVIRONMENTAL
BENEFITS
• Private Transport (passenger cars and light
commercial vehicles): Electric vehicles / Hybrid
vehicles with CO2 emission lower than 50g CO2/km.
• Urban, suburban and road passenger transport
(motor bus, tramway, streetcar, trolley bus,
underground and elevated railways ): The direct Climate Change
(tailpipe) CO2 emissions of the vehicles are zero. Mitigation
Clean Transportation • Rail Transport (Passenger or Freight): zero direct ---
(tailpipe) CO2 emissions trains and passenger GHG emissions
coaches. reduction
• Infrastructure for personal mobility: The
infrastructure that is constructed and operated is
dedicated to personal mobility: pavements, bike
lanes and pedestrian zones, electrical charging
stations.
321 USE OF PROCEEDS – ELIGIBLE CATEGORIES (3/4)
EU ENVIRONMENTAL
EXAMPLES OBJECTIVES /
ELIGIBLE CATEGORIES SDGS
(for all the details please refer to the Framework) ENVIRONMENTAL
BENEFITS
• Energy Storage Systems. Climate Change
• Energy Efficient Lighting (LED lighting). Mitigation
Energy Efficiency ---
• District Heating and Cooling. GHG emissions
• Energy Efficient smart grid / smart meters. reduction
Environmentally
sustainable • Environmentally sustainable agriculture certified by
management of recognized third-party certifications such as EU Climate Change
living natural Organic. Mitigation
resources and land • Investments in protected area (regional natural
use parks).
331 USE OF PROCEEDS – ELIGIBLE CATEGORIES (4/4)
EU ENVIRONMENTAL
EXAMPLES OBJECTIVES /
ELIGIBLE CATEGORIES SDGS
(for all the details please refer to the Framework) ENVIRONMENTAL
BENEFITS
• Development, operation and upgrade of recycling
Pollution prevention (metals, plastic and paper) plants. Climate Change
and control • Facilities, systems and equipment that are used to Mitigation
divert waste from landfills.
• Water treatment infrastructure, including
wastewater treatment systems and sewer systems.
Sustainable Water • Water distribution systems with improved efficiency. Climate Change
and Wastewater
Management • Water capture and storage infrastructure, including Mitigation
storm water management systems, water
distribution systems and aquifer storage.
• Water storage facilities.
342 PROJECTS EVALUATION AND SELECTION
Composed by the CEO, General Manager, CFO, Chief Commercial Officer, Chief Lending Officer, Chief
SUSTAINABILITY Risk Officer, Chief Information Officer, Head of Logistic and Operational support department, Head of
COMMITTEE Personnel and Organizational models department, Head of Planning, Investor Relations and directional
controls department and the Head of Sustainability Office.
On top of approving and validating the pool of eligible and monitoring its evolution over time, it has to
maintain and update the Green Bond Framework and approve reporting.
The Committee meetings take place at least quarterly.
Process for project evaluation is the following:
․ The relevant departments within the Group perform a pre-selection of potential Green
Projects;
․ They are then submitted to the Sustainability Committee, which verifies whether they are
alligned with the Eligibility Criteria;
SELECTION ․ If yes, the Green Projects are identified within the Bank interal information system.
ACTIVITY
Green Projects will comprise mainly, but not exhaustively:
․ Corporate loans and projects’ financing currently originated by Banca Popolare di Sondrio and
that in the future may also be originated by any other entity in the Group;
․ Retail residential mortgages currently originated by Banca Popolare di Sondrio and that may in
the future also be originated by any other entity in the Group;
․ Ecobonus 50%-65% / Superbonus 110% financing granted by Banca Popolare di Sondrio linked
to the renovation of existing building or individual renovation measures under the italian fiscal
system.
EXCLUSIONARY
CRITERIA
Fossil Fuel; weapons; tobacco; gambling; adult entertainment; predatory lending; nuclear; energy
production from oil, black coal, lignite and oil sands (including energy-efficient technologies that are
inherently carbon-intensive and/or primarily driven/powered by oil and/or black coal); sourcing of palm
oil from sources not certified by organizations such as the Roundtable on Sustainable Palm Oil (RSPO).
353 ALLOCATION AND IMPACT REPORTING
ALLOCATION
REPORTING The allocation report will provide information such as: total allocations of Eligible Green Projects, share
of financing versus refinancing, amount of unallocated proceeds at reporting end-period (if any),
breakdown of total amount of Eligible Green Projects per category and geographical breakdown of
Eligible Green Projects.
Eligible Categories Potential Quantitative Performance Measures
✓ CO2 emission avoided (tCO2 e)
Renewable Energy
✓ Total installed capacity (MW)
✓ CO2 emission avoided (tCO2 e)
Energy Efficiency
✓ Expected Energy savings per year (MWh)
✓ CO2 emission avoided (tCO2 e)
Clean Transportation
✓ New clean transportation infrastructure built (km)
IMPACT ✓ CO2 emission avoided (tCO2 e)
REPORTING ✓ Floor space of green real estate (m²)
Green Buildings ✓ Expected Energy savings per year (MWh)
✓ Number of residential buildings belonging to the top 15% of the most carbon
efficient buildings
Environmentally sustainable ✓ Total surface financed (hectares)
management of living natural ✓ Number of agricultural business financed
resources and land use ✓ Volume of farming input avoided (t/year)
Pollution prevention and ✓ CO2 emission avoided (tCO2 e)
control ✓ Waste diverted from landfill (tonnes)
Sustainable Water and ✓ Volume of water saved/reduced/treated (m³)
Wastewater Management ✓ Total Population served by the system
364 THIRD PARTIES REVIEW
Second Party Opinion: Banca Popolare di Sondrio has obtained a Second-Party Opinion from
EXTERNAL Sustainalytics on this Green Bond Framework.
REVIEW
Post-Issuance External Verification: on an annual basis, an external auditor will carry out an
independent review of
․ use of proceeds associated with the selected Eligible Categories;
․ conformance with the Framework of the selected Eligible Green Projects;
․ allocation Reporting metrics.
37TABLE OF CONTENTS
1 BPS AT A GLANCE
2 BANCA POPOLARE DI SONDRIO’S COMMITMENT TOWARDS SUSTAINABILITY
3 BANCA POPOLARE DI SONDRIO’S GREEN BOND FRAMEWORK
4 INTENDED INAUGURAL GREEN BOND TRANSACTION AND PORTFOLIO OVERVIEW
38INDICATIVE TERMSHEET OF BPS INAUGURAL GREEN BOND
ISSUER: Banca Popolare di Sondrio S.C.p.A.
FORMAT: Senior Preferred Unsecured, Green
EXPECTED ISSUE RATINGS
BB+ / BBBL
(FITCH/DBRS):
MATURITY: 6NC5 Y
SIZE: EUR 500mln (WNG)
To finance/refinance Eligible Green Projects according to the BPS Green Bond
USE OF PROCEEDS:
Framework
SECOND PARTY OPINION: Sustainalytics
GREEN STRUCTURING ADVISORS: BNP Paribas and Mediobanca
Banca Popolare di Sondrio S.C.p.A, BNP Paribas, J.P. Morgan, Mediobanca,
JOINT BOOKRUNNERS:
Raiffeisen Bank International and Societe Generale
Issued off the Issuer’s Euro 5 billion Euro Medium Term Note Programme dated
DOCUMENTATION:
31st July 2020 as supplemented
GOVERNING LAW / LISTING: Italian / Luxembourg Stock Exchange
39OVERVIEW OF SELECTED ELIGIBLE PROJECTS
The inaugural issue off the BPS Green Bond Framework will refinance existing asset amounting to an 81,2% of the targeted
new issue size of the intended transaction. The remaining 18,8% will be allocated to new assets/financings (eligible under
the Framework) that the issuer is committed to originate in the following 3 years
• For the assets already identified (EUR 406 mln) apply the following parameters and characteristic:
• 3-years lookback period applied: starting in 2018
• 3-years [look forward period]
• >12 years maturity
• 100% assets located in Italy
• Evaluation Date: 31 May, 2021
Type of Aggregated Amount Average Ticket size Average Tenor
Number of Loans
category Financed (mln €) (mln €) (years) 3% 4%
Green Building
187 1026 0,183 18,5
(Mortgages)
Green Building
75 1906 (# tickets) 0,108 6,2
(Super/Eco Bonus) 28%
46%
Renewable Energy 114 38 3,093 7,5
Pollution prevention
14 4 3.643 8,4 19%
and control
RENAWABLE ENERGY
SUPER/ECOBONUS
Sustainable Water
5,364
and Wastewater 16 3 6,9 GREEN BUILDINGS
Management
SUSTAINABLE WATER AND WASTEWATER MANGEMENT
POLLUTION PREVENTION AND CONTROL 40FRAMEWORK APPENDIX ON ITALIAN GREEN
RESIDENTIAL AND COMMERCIAL REAL ESTATE
Rational
Banca Popolare di Sondrio engaged CRIF S.p.A. (an independent real estate expert) to identify the eligible Green
Buildings in the framework of loans or mortgages related to the acquisition, construction and renovation of residential
and/or commercial energy-efficient properties for a Green Bond issuance, in line with EU environmental objective of
climate change mitigation and energy savings.
The CBI Taxonomy defines a Screening Indicator for Commercial and Residential buildings as the emissions footprint in
the top 15% of emissions performance in the local market.
Therefore, Banca Popolare di Sondrio analysed its portfolio in light of the following two criteria:
- EPC Label (considering only those building presenting an EPC equal or better to the C class)
- Year of construction (considering only those building constructed after the year 2016)
Banca Popolare di Sondrio Portfolio
Following these criteria 1,026 eligible loans and 1,795 buildings have been identified in the Banca Popolare di Sondrio
portfolio, corresponding to € 187,438,483 according to the current balance.
Distribution of
eligible buildings
according to the
province and the
region
41APPENDIX: FOCUS ON SUPERBONUS 110%
MAIN FEATURES
• In May 2020 the Italian Government launched a new 110% tax deduction known as “Superbonus” under the Law
Decree No. 34 of 19th May 2020 (“Decreto Rilancio”), thus providing families and businesses the opportunity to carry
out specific interventions taking advantage of a 110% tax allowance for all qualifying expenses incurred between the
1st July 2020 and the 30th June 2022 to be divided into 5 equal annual quotas and – only for the expenses incurred in
2022 – into 4 equal annual quotas.
• The Superbonus takes into account two main scopes of intervention: through the Ecobonus it addresses energy
efficiency works, whereas with the Sismabonus it refers to anti-seismic structural improvements.
SUPER ECOBONUS
• Under the Super Ecobonus there are two main types of eligible works: (i) Leading works (“Interventi principali o
trainanti“) and (ii) Linked secondary works (“Interventi aggiuntivi o trainati“).
• Leading works include for instance insulation to existing building envelope and replacement of heating / air
conditioning equipment of residential buildings, whereas linked secondary works, as the name suggests, are carried
out at a later stage once at least one leading work has already been completed. Amongst them one may find charging
stations for electric cars, as well as installation of photovoltaic systems.
• Among other strict parameters, in order for these expenses to be considered as qualifying under the fiscal facility, it is
fundamental that the works carried out (both leading / linked secondary) lead to at least two steps of improvement
in the EPC label of the residential building. The EPC (in Italy APE) improvement is demonstrated by a pre-post
report released by a qualified expert.
SUPER SISMABONUS
• Under the Super Sismabonus the 110% tax allowance is granted for any seismic structural improvements to any
kind of building, without any limits in terms of number of residential units subject to the intervention, as long as the
unit is located in seismic zones classified either 1, 2 or 3.
42APPENDIX: FOCUS ON ECOBONUS 50%-65%
MAIN FEATURES
• Even before the Superbonus, the Italian Government introduced another tax credit called Ecobonus 50/65% under
the Law Decree No. 63 of 4th June 2013, to which modifications have been applied over time until the last 2021
Budget Law. Similarly to the Superbonus, also the Ecobonus grants some tax credits allowing in this case 50/65% of tax
deduction for expenses incurred to bring some sort of energy efficiency improvements to already existing buildings
(i.e. it does not apply to new construction) to be divided into 10 equal annual quotas. Amongst the qualifying
expenses one may find for instance interventions leading to overall upgrading of the building, as for example
insulation to existing building envelope, as well as the substitution of existing heating systems with new Class A or
higher condensing boilers.
• The Law may require either a qualified expert or the system manufacturer certifying the energy efficiency
improvements brought as per the Ecobonus principles. Last but not least, most of the times the EPC certificate is
also required. To be noted that if the interventions carried out under the Ecobonus are combined with linked
secondary works as defined in the Superbonus, then the expenses incurred may be considered as qualifying for
Superbonus 110%.
43DISCLAIMER
❑ This document has been prepared by Banca Popolare di Sondrio for information purpose only and does
not constitute a public offer under any applicable legislation or an offer to sell or solicitation of an offer
to purchase or subscribe for securities or financial instruments or any advice or recommendation with
respect of such securities or other financial instruments.
❑ The document has been drawn up on the basis of data and information on which Banca Popolare di
Sondrio has not carried out autonomous verification and that have been obtained from, and are based
upon, sources that company believes to be reliable. Consequently, Banca Popolare di Sondrio makes no
representations (either express or implied) or warranty on the completeness, timeliness or accuracy of
any such data or information.
❑ Any forward-looking statements contained in this document, which are therefore inherently uncertain,
have been made in reliance of a number of assumptions, expectations, projections and provisional data
concerning future events and are subject to significant risks and uncertainties, many of which are
outside the company’s control. There are a variety of factors that may cause actual results and
performance to be materially different from the explicit or implicit contents any forward-looking
statements and thus, such forward-looking statements are not a reliable indicator of future
performance. The company has no obligation to publicly update or revise any forward-looking
statements, nor any other information included in this document, whether as a result of new
information, future events or otherwise, except as may be required by applicable law. The information
and opinions contained in this Presentation are provided as at the date hereof and are subject to change
without notice.
❑ Notwithstanding the foregoing, Maurizio Bertoletti, in his capacity as manager in charge of financial
reporting declares that the accounting information contained in this Presentation reflects the group’s
documented results, financial accounts and accounting records.
4445
You can also read