The Inuence of Mass Media on Italian Web Users During COVID-19: An Infodemiological Analysis
←
→
Page content transcription
If your browser does not render page correctly, please read the page content below
The In uence of Mass Media on Italian Web Users During COVID-19: An Infodemiological Analysis Alessandro Rovetta ( rovetta.mresearch@gmail.com ) Mensana srls Lucia Castaldo Mensana srls Research Article Keywords: COVID-19 pandemic, growing infodemic, infoveillance and infodemiology methods DOI: https://doi.org/10.21203/rs.3.rs-563151/v1 License: This work is licensed under a Creative Commons Attribution 4.0 International License. Read Full License
The Influence of Mass Media on Italian Web Users during COVID-19:
an Infodemiological Analysis.

Alessandro Rovetta1, Lucia Castaldo1
1
 Mensana srls, Research and Disclosure Division, Brescia, Italy

Corresponding author
Alessandro Rovetta,
Mensana srls, Research and Disclosure Division,
Via Malta 12 – 25124 Brescia, Italy.
Email: rovetta.mresearch@gmail.com
Phone: 39-3927112808
ORCID: 0000-0002-4634-279X
Web of Science Researcher ID: AAT-9063-2020

Funding
This research did not receive any specific grant from funding agencies in the public, commercial, or
not-for-profit sectors.

Author information
Alessandro Rovetta designed the study, collected the data, performed the data analysis, and wrote the
manuscript. Lucia Castaldo contributed to the collection and analysis of data.

Copyright statement
This work is copyrighted (Patamu deposit number: 151420). The certain date of the generation of the
author's proof is certified with time stamps and its validity is guaranteed pursuant to the 910/2014 EU
eIDAS regulation for Digital Trust services.
Abstract
Alongside the COVID-19 pandemic, the world has had to face a growing infodemic, which has caused
severe damage to economic and health systems and has often compromised the effectiveness of
infection containment regulations. Although this has spread mainly through social media, there are
numerous occasions in which the mass media have shared dangerous information, giving resonance
to statements without a scientific basis. For these reasons, infoveillance and infodemiology methods
are increasingly exploited to monitor online information traffic. The same tools have also been used
to make epidemiological predictions. Among these, Google Trends - a service by GoogleTM that
quantifies the web interest of users in the form of relative search volume - has often been adopted by
the scientific community. In this regard, the purpose of this paper is to use Google Trends to estimate
the impact of Italian mass media on users' web searches in order to understand the role of press and
television channels in both the infodemic and the interest of Italian netizens on COVID-19. In
conclusion, our results suggest that the Italian mass media have played a decisive role both in the
spread of the infodemic and in addressing netizens' web interest, thus favoring the adoption of terms
unsuitable for identifying the novel coronavirus (COVID- 19 disease). Therefore, it is highly
advisable that the directors of news channels and newspapers be more cautious and government
dissemination agencies exert more control over such news.
1 Introduction
The COVID-19 pandemic has put a strain on economies and health systems around the world [1, 2].
As of March 21, 2020, the death toll is around 2.71 million and the trend continues to grow [3]. In
the meanwhile, besides the disease, the world has had to face a growing infodemic capable of causing
damage of equal severity [4]. The role of social media (e.g., Facebook, Instagram, and Twitter) and
even traditional media (e.g., national newscasts and newspapers) in the spread of infodemic
information has now been recognized by a large literature [5-10]. Furthermore, there is strong
evidence that these two communication sectors are not separate: indeed, mass media have been able
to heavily influence the trends of users' web searches [10-12]. In such a vast and complex scenario, a
quantitative estimate of this phenomenon is difficult to be achieved as a wide range of factors are
involved. Nonetheless, the online behavior of users has often been monitored not only for mere
infoveillance but also to i) make predictions at a deeper epidemiological level, ii) assess either the
psychological state and risk perception of web users or particular requests for medical assistance, iii)
carry out analyses of environmental sustainability [13-18]. As a consequence, given this international
crisis, the need for a deep understanding of the web media-user relationship is imperative. In this
paper, we considered the influence of the main Italian media on web users looking for causal
correlations, cross-correlations, and other relationships between different variables. Specifically,
three aspects were investigated: i) the adoption of the most appropriate terms for the identification of
SARS-CoV-2 and related COVID-19 by media and web users, assigning each term a specific value
on the infodemic scale (I-scale, [10]), ii) any causal correlations and cross-correlations between article
titles of the two most read newspapers in Italy (i.e., “La Repubblica” and “Il Corriere della Sera”)
and web searches on Google during the first wave, and iii) the contribution of Italian media in the
spread of fake news. Data relating to media were collected from their official websites and YouTube
channels, while web users’ interest was evaluated through the infoveillance tool “Google Trends” by
Google [19]. As highlighted by Cervellin et al. [20], Google Trends is heavily subjected to the media,
which is why it is essential to dissect any causal link. Therefore, this paper aims to answer the
following research questions: R1) how much have the Italian media influenced Italian web users in
the adoption of terms to identify the novel coronavirus (COVID-19)? R2) how much have the Italian
media influenced the web interest in the novel coronavirus (COVID-19)? R3) What was the role of
the Italian mass media in the COVID-19 infodemic? R4) Is Google Trends a reliable tool for
epidemiological analysis as it reflects a real Italian web users’ interest in the topic or are its data just
the outcome of what has been published in the media? This last question comes to be particularly
relevant, especially if one considers that some scholars found a direct correlation in the rise in
COVID-19 positive cases and the Google searches for information on its symptoms; whereas others
demonstrated that web searches were simply connected to a growing interest in COVID-19 generated
by the press, instead of a real feeling of unwellness and physical indisposition experienced by the
web user themselves.
2 Results
2.1 Media influence on Italian web users
Infodemic and scientific names: trends and correlations
A substantial difference in the adoption of scientific names “2019-nCoV” and “novel coronavirus”
against the more infodemic “coronavirus” was found at the beginning of the pandemic between the
most read newspapers “La Repubblica”, “Il Corriere della Sera”, and others (including “Il Sole 24
Ore”, “Il Fatto Quotidiano”, “Il Giornale” and “La Stampa”), and sources like Google and PubMed
(Table 1).

 2019-ncov novel coronavirus coronavirus Chinese (corona)virus
 Infodemic Scale 0 1 4 9
 PubMed 42.7% 45.2% 12.1%
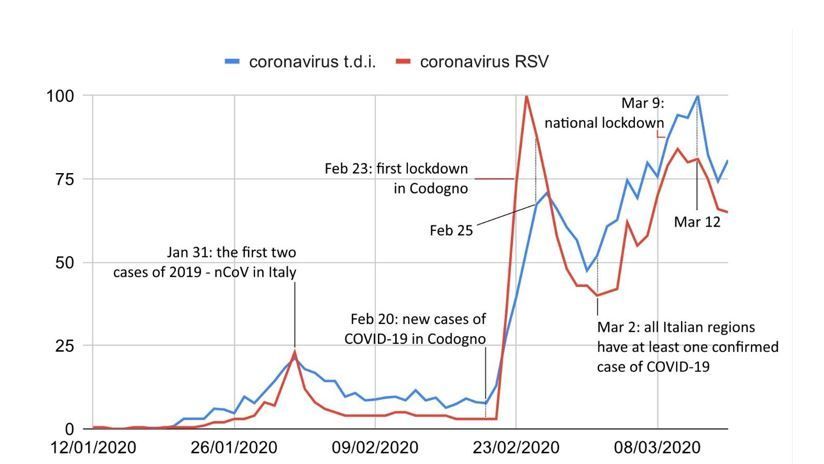
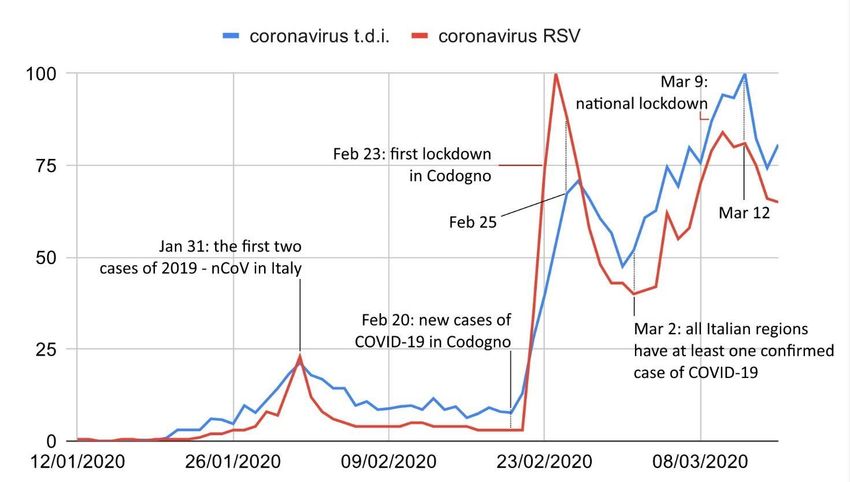
Figure 1. Comparison between weekly RSVs of the keywords “coronavirus” (yellow) and “covid” (green) with the
number of times the latter have been adopted by the newspaper “La Repubblica” (blue and red, resp.) from January 1 to
September 6, 2020. All values were normalized to 100. RSV = Google Trends relative search volume, t.d.i = titles daily
increase.

In the period from the week “January 13-19” to that of the peak “March 9-15”, the average percentage
discrepancy between all data pairs was significantly smaller than in the following months up to
August (∆1, % = 68 ± 6, 2, = 115 ± 11, = 3.8). By restricting the analysis to the period
January 12– March 12, 2020 so as to use daily cumulative values, 5 trends with significantly
correlates were observed (Figure 2): 1 = .95, 1 < .001; 2 = .78, 2 < .001; 3 = .93, 3 =
.008; 4 = .94, 4 < .001; 5 = .94, 5 < .001. From March 12 onwards, a single decreasing trend
with a significant correlation was observed until the week of 2-8 August ( 6 = .97, 6 < .001).
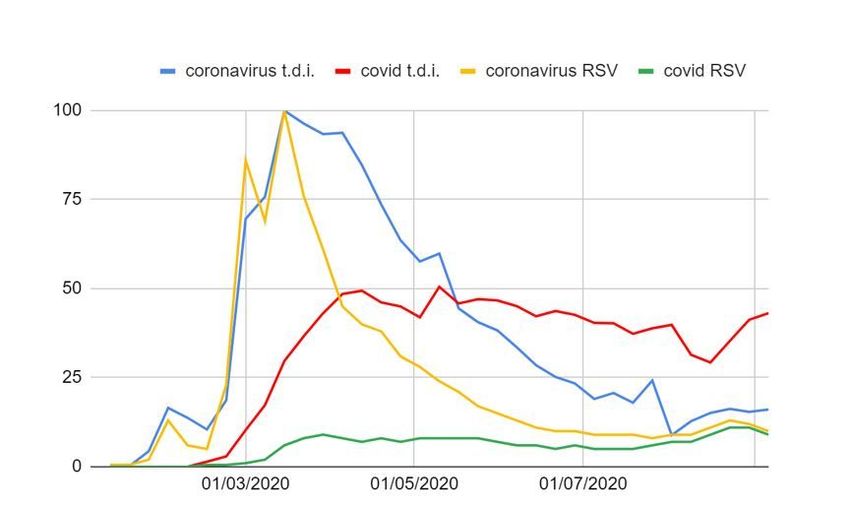
Figure 2. Comparison between daily RSVs (red) of the keywords “coronavirus” and “covid” with the number of times
they have been adopted by the newspaper “La Repubblica” (blue) from January 12 to March 12, 2020. All values were
normalized to 100. The black lines represent the beginning or the end of a trend. RSV = Google Trends relative search
volume, t.d.i = titles daily increase.

As for “Il Corriere della Sera”, the results were slightly different: firstly, the percentage discrepancies
between “coronavirus” RSV and t.d.i. were statistically confident (∆1, % = 99 ± 13, 2, = 92 ±
9, = 0.5); secondly, one correlation among the six investigated was weak ( 1 = .61, 1 = .037; 2 =
.56, 2 = .013; 3 = .91, 3 = .012; 4 = .24, 4 = .604; 5 = .57, 5 = .067, 6 = .96, 6 <
.001).
After the introduction of the scientific names “SARS-CoV-2” and “COVID-19”, the use of the
moderately infodemic and non or slightly infodemic names has partially changed compared to the
previous period (Table 2). However, even in this case, all the media are characterized by greater use
of the generic name “coronavirus”.

 sars-cov-2 covid (and related) Novel coronavirus coronavirus
 Infodemic Scale 0 1 1 4
 PubMed 27.5% 38.6% 28.8% 5.1%
 Ministry of Health 1.3% 78.2% 9.0% 11.5%
 Google 24.3% 28.4% 25.7% 21.6%
 La Repubblica 0.6% 33.2% 1.3% 64.8%
 Il Corriere d. Sera 1.2% 44.0% 1.0% 53.8%
 Other Newspapers 1.6% 39.9% 1.4% 57.1%
 Rai (Google News) 0.0% 15.4% 0.6% 84.0%
 Mediaset (Google News) 0.0% 7.0% 0.7% 92.3%
Table 2. Rate of adoption of COVID-19-related terms during the lockdown (Feb 11 - May 18, 2020).
In the period February 11 - May 18, 2020, the denominations “SARS-CoV-2” and “COVID-related”
were used differently by Italian users (∀ < 1 = 64, respectively). “COVID-related”
terms were used less frequently than “coronavirus” until the second week of September ( , % =
404, = 5.0). Until the second week of May, the weekly adoption of “COVID-related” terms by “La
Repubblica” was significantly lower than that of the term “coronavirus” (∀∆ % ∈ [642, 18]).
Furthermore, the percentage discrepancies between “COVID-related” RSV and t.d.i. were substantial
( % = 509 ± 32 in the whole investigated period). Nonetheless, correlations were found in the
period from the week 10-16 February to 23-29 March ( 1 = .99, 1 < .001) and in the period from
the week 23-29 March to 20-26 July ( 2 = .64, 2 = .007). Finally, among all the COVID-related
terms, “covid” was the one most exploited by users despite the more appropriate and specific “covid-
19” ( = 47 = 2). The results for “Il Corriere della Sera” were similar (∆ , % =
773 ± 69, 1 = .97, 1 < .001; 2 = .49, 2 = .037).
Therefore, if a causal correlation of the type “newspaper titles → RSV” exists, three pieces of evidence
are highlighted: i) it caused a variation of the RSV really similar to that of the titles of “La
Repubblica” and “Il Corriere della Sera” before the peak, ii) it caused a more pronounced variation
of the RSV after the peak (for small variations of the independent variable, large variations of the
dependent variable were observed), iii) it substantially influenced the Italian web users in the adoption
of the terms used to identify SARS-CoV-2, generating a dangerous disparity between scientific and
more infodemic denominations.

Evidence supporting causation
Non-causal correlations could be due to a) stochastic phenomena, and b) other triggering phenomena
(spurious correlations). We found up to 6 significant consecutive trends ( = .007 ± .006,
∀ < .04) and as many strong correlations. Let us consider the hypothesis “a” thus supposing that
the correlations found are due to chance and their probability of occurring is 50%, which is a large
overestimate since it would mean that - generating random data - the probability of obtaining a
monotonous trend is the same as getting heads when flipping a coin. The probability of getting such
a scenario from chance is given by (0.5)6 < .016. A more realistic estimate was obtained by
generating random values using the “Random Generator Number” provided by Dr. Haahr [23]: in
particular, by generating 50 data series composed of 6 numbers and looking for 1225 Pearson and
Spearman correlations between them, significant correlations (i.e. close to the threshold = .05)
were obtained in about 6.5% of pieces of evidence are highlighted; consequently, the probability of
obtaining 6 consecutive significant correlations was (6.5/100)6
2-12. After that, although COVID-19 cases continued to rise until April, both RSV and the
“coronavirus” newspaper titles started declining. As a result, a preliminary conclusion that could be
drawn is that web users have been more influenced by the media, instead of the trend of COVID-19
cases. Nonetheless, linear regression and multiple regression analyses were performed between the
quantities COVID-19 cases, newspaper titles, RSV following the scheme shown in Figure 3 (next
page). These results also suggest a greater influence of newspapers towards RSV, although there is a
marked dependence between all the variables. Furthermore, by improperly assuming independence
between the normalized variables COVID-19 cases ( 1 ) and Newspapers titles ( 2 ) and calculating
an LSM multiple regression plan for the RSV ( ̂), we got ̂ = 16 1 + 1.7 2 − 17 and ̂ = 0.05 1 +
 2 − 15.

Figure 3. Causal implications scheme and linear regression results. V.E. = variability explained, RSV = Google Trends
relative search volume.

Although it is glaring that, in some cases, both COVID-19 cases and newspapers have contributed to
conditioning Italian web users, COVID-19 cases had a more temporary and discontinuous effect than
newspaper titles. Anyway, it must be considered that even this kind of news is disseminated by
disclosure sources which can be I) official government sources (i.e. the Italian Ministry of Health and
the Higher Institute of Health), II) private websites, blogs, and social networks, or III) media. Let us
consider each and every hypothesis . Hypothesis “I”: assume that all citizens, once they have become
aware of the COVID-19 issue, have consulted official sources . Considering that the official Italian
Government Printing Offices used , in the vast majority of cases, the less infodemic names (83.5%),
and the amount of news they reported was limited and not correlated with RSV (e.g. from January 1
to March 12 the Ministry of Health produced 91 articles against tens of thousands by media), we can
exclude this hypothesis. Hypothesis “II”: let us suppose then that the RSV was influenced by
unofficial sources not directly related to press and newscasts. Since press and newscast have their
independent sources and we already excluded every random correlation as well as any global
correlations with COVID-19 cases, we can only suppose a causal global process of the type “media
→ private websites, blogs, social networks → RSV” which confirms the fundamental role of media.
Therefore, the only hypothesis with empirical evidence is that media, such as press and newscasts,
not only have predominantly determined the web searches’ trends, but also the terms used to carry
out such searches (i.e., Hypothesis “III”).
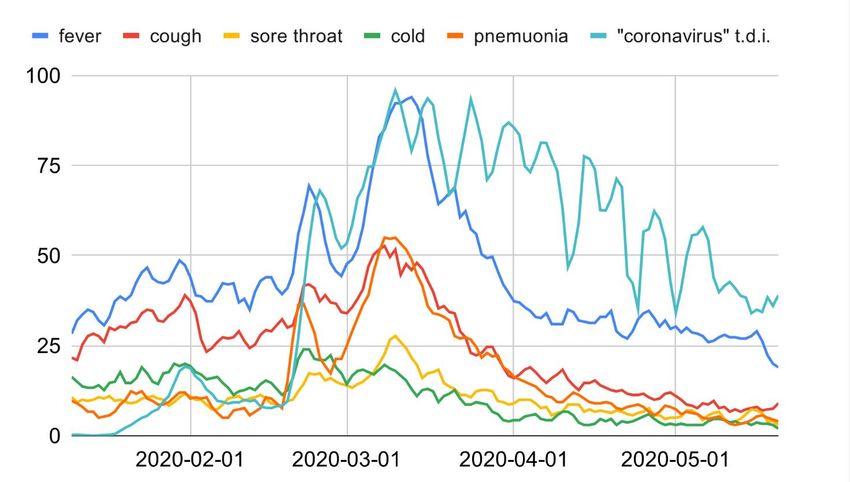
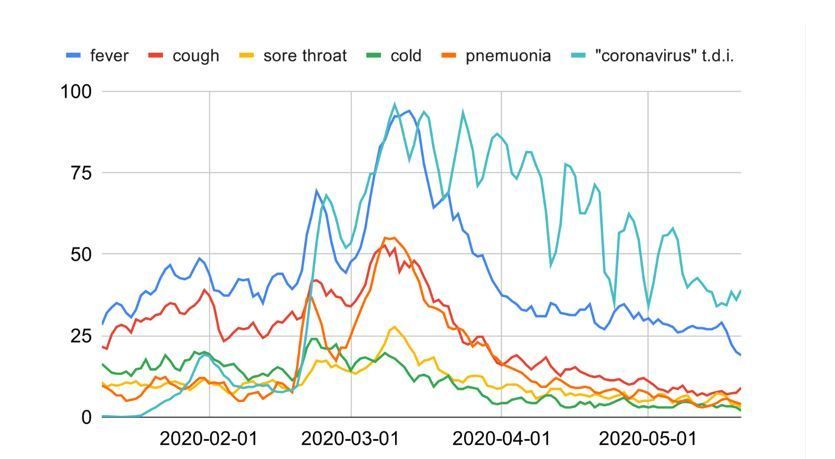
COVID-19 symptoms-related web searches
As for the queries previously investigated, the keyword “coronavirus symptoms + covid symptoms”
in the timelapse January 20 - May 23 has been influenced by media ( = .92 ± .03, ∀ < .007).
Its RSV was highly sensitive to news, reaching peaks of 74 ± 0.7, 86 ± 0.8, and 100 ± 0.1 on
January 31, February 23, and March 9, respectively. Among the COVID-19 symptoms reported by
the Italian Ministry of Health, the most typed on search engines during the whole pandemic were the
Italian terms for fever ( = 49 ± 4.6), cough (23.0 ± 3.5), cold (15.2 ± 2.2), sore throat (12.5 ±
1.3), and pneumonia (12.3 ± 3.2). During the previous 3 years (2017-2019), these showed winter
seasonalities but neither global nor local trends or unit-roots (∀ < .004, ∀ < 0.05,
supplementary figure 1). This allowed us to easily identify two anomalies: February-May 2020, with
∆ % ∈ [50, 835], ∈ [14,21], and August-November 2020, with ∆ % ∈ [46, 264], ∈
[2.8, 6.2] (except for “cough”). Therefore, the impact of the pandemic on this type of search has been
substantial. Nonetheless, there is evidence that counteracts the potential use of such web searches to
predict COVID-19 cases: in fact, the general RSV trend in the period February – May 2020 presents
more similarities and correlations with newspaper titles than with COVID-19 cases (Figure 4).

Figure 4. Comparison between COVID-19 symptoms-related web queries (Google Trends relative search volumes) and
“La Repubblica” newspaper titles containing the word “coronavirus” from January to May 2020.

In particular, although the analysis of cross-correlations has identified some optimum values with a
lag of 2 days, the onset of local RSV trends never preceded that of newspaper headlines. Additionally,
we once again observed two clear decreasing trends in RSV between late February and early March
and after 15 March, despite the continued increase in COVID-19 cases.
COVID-19 web interest during the second wave
The “coronavirus + covid” query had a near-stationary RSV between early June and early August
( = .135, = −0.09, % = 8.3%). This was much less pronounced than during the first
wave (∆% = −71.4, = −14.2) due to the sharp decrease in COVID-19 cases and the easing of
containment measures. From August 2020 to March 17, 2021, web interest in COVID-19 remained
significantly lower than that of the first lockdown (∆% = −57.8, = −4.2), thus showing spikes of
RSV at the start of the second wave ( = 23 ± 0.4, August 2020), a steep rise of cases from
October 1, 2020 until about mid-November ( = 35 ± 0.7), and mid-February, anticipating
the increase in cases at the end of February by about 10 days ( = 23 ± 0.5). The use of the
term “covid” has surpassed that of the more generic and infodemic “coronavirus” (59% 41% from
September 2020 to March 2021). On the contrary, the more technical “SARS-CoV-2” has not been
adopted by web users (∀ < 1). This time, as far as the adoption of COVID-19-related terms is
concerned, strong differences have been noticed between newspapers and other sources, including
“Rai” and “Mediaset” (Table 3).

 sars-cov-2 covid (and related) Novel coronavirus coronavirus
 Infodemic Scale 0 1 1 4
 PubMed 26.6% 42.9% 27.6% 2.8%
 Ministry of Health 0.9% 90.9% 1.8% 6.4%
 Google 25.7% 28.6% 22.9% 22.9%
 La Repubblica 0.9% 76.5% 0.3% 22.3%
 Il Corriere d. Sera 1.5% 75.1% 0.6% 22.7%
 Other Newspapers 1.1% 74.0% 0.1% 24.8%
 Rai (Google News) 0.5% 49.3% 0.0% 50.2%
 Mediaset (Google News) 0.0% 38.6% 1.3% 60.1%
Table 3. Rate of adoption of COVID-19-related terms during the lockdown (May 19, 2020 – March 17, 2021).

Despite the use of COVID-related terms by newspapers exceeding that of the generic name
“coronavirus” in May 2020, the web users showed a delay of 4 months to do the same. Finally, web
users’ interest in COVID-19 decreased by about 20% compared to the first wave.

2.2 Media influence on COVID-19 Infodemic
YouTube videos
The YouTube channels of the following news broadcasts were investigated (the number of
subscribers is in brackets): Rai (4.08 million), LA7 Attualità (730,000), MediasetPlay (605,000), La
Repubblica (576,000), Corriere della Sera (145,000), and Tgcom24 (52,700). Only videos with over
100,000 views were considered for analysis (the number of views is in brackets). The views of videos
containing the keyword “coronavirus” overwhelmed those containing the keywords “COVID-
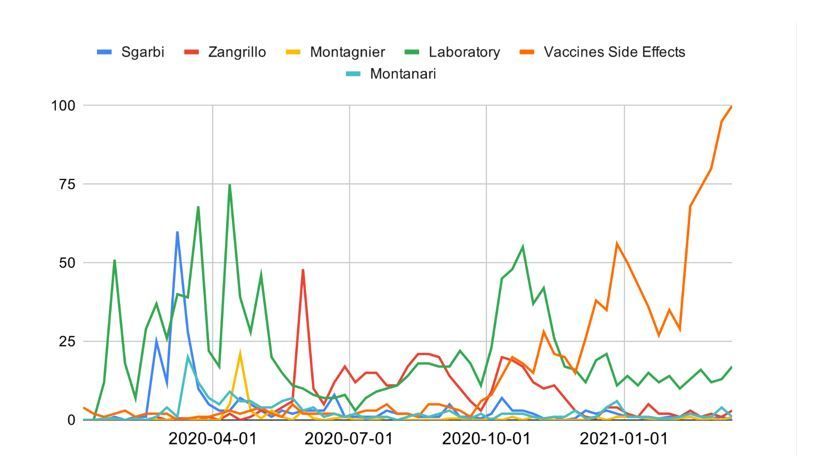
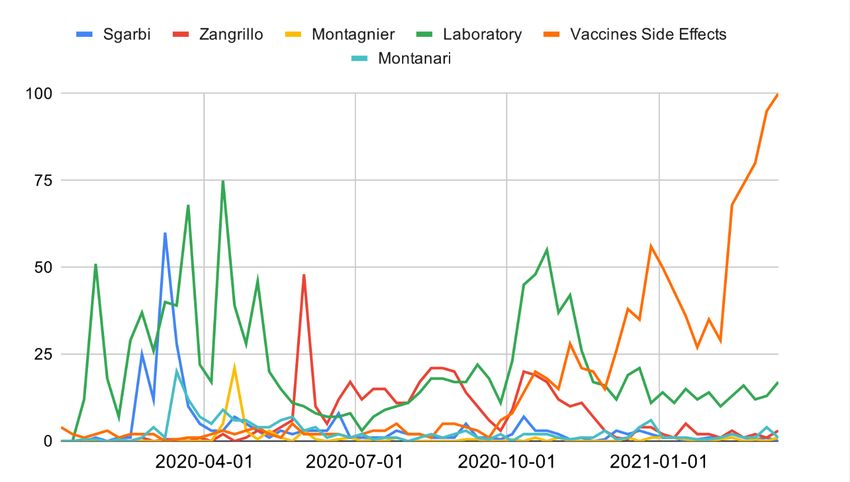
related” and “sars-cov-2” (50.07 million vs 8.51 million, % = 141.9). Moreover, some videos with
the most views had extremely infodemic titles, such as the following Italian headlines, here provided
in their English translation: “Covid does not exist” (621,945, 1st on La7 Attualità), “The 2015 Rai-
Leonardo video on the virus created in China in the laboratory. The scientific community...”
(401,648, 4th on Il Corriere della Sera, “Coronavirus, Vittorio Sgarbi: "It is not an epidemic because
there is no risk of death” (440,296, 2nd on La7 Attualità), “Coronavirus, Sgarbi: The confinement of
asymptomatic people is fascism” (396,144, ), “Coronavirus, the Senate conference of "deniers": In
Italy, the virus no longer exists” (189,655, 47th on La Repubblica), “Covid, Prof. Roberto Bernabei:
It's a normal disease...” (141,233, 21th on La7 Attualità), “Coronavirus, the reassurance of the
infectious disease specialist Matteo Bassetti: It's not an infection...” (the video talks about similarities
between Covid-19 and common seasonal flu, 203,347, 14th on La7 Attualità). Finally, the presence
of growing interest in information channels that discloses serious fake news must be taken into
account. In particular, the YouTube channel ByoBlu (524,000 subscribers) often shares scientifically
unjustified opinions of people that have become famous for their conspiratorial positions on COVID-
19. However, an exact estimate of such a phenomenon is difficult to make, as many videos have been
blacked out by YouTube due to their misinformative nature [24].

Web searches
Some statements from prominent personalities, including scientists, have directed the web interest of
users towards disinformation and misinformation (Figure 5).

Figure 5. Infodemic query RSVs since the start of the pandemic. The "astrazeneca" query is not shown in order to allow
you to view the other RSV trends.
Among these, on February 23, 2020, Dr. Maria Rita Gismondo compared COVID-19 to a seasonal
flu [25]. On the same day, the RSV of the “coronavirus flu + covid flu” query went from 0 to 100,
maintaining high values until March 22 ( = 40.2 ± 3.2). On February 24, 2020, politician
Vittorio Sgarbi minimized the risk of death from COVID-19 without any supporting scientific
evidence [26]. On the same day, the proper RSV of the “coronavirus sgarbi + covid sgarbi” query
went from 2 to 75. Moreover, Sgarbi became the protagonist of a long series of infodemic statements,
including the incitement to violate the anti-COVID-19 regulations [27]. Over the same period, the
RSV from the previous query remained high, hitting two new maxima on 10 and 14 March ( =
100, = 93, respectively). Other major fake news circulated through the media involved the
creation of COVID-19 in a Chinese laboratory. The following reasons contributed to this
phenomenon: i) a 2015 report by a local news program, reproposed by the media, ii) the words of the
politician Matteo Salvini, and iii) the statements of the Nobel Prize winner Luc Montagnier [10, 28].
Another promoter of conspiracy theories was Dr. Stefano Montanari [29]. Soon after his statements,
there was a spike in the RSV of the query “montanari coronavirus + montanari covid”. On May 31,
2020, Dr. Zangrillo declared the disappearance of COVID-19 [30]. The same day, there was a heavy
rise in the query “coronavirus zangrillo + covid zangrillo”. However, the major infodemic impact of
the media has been on vaccines, especially for the “AstraZeneca” one. Figure 5 shows a clear trend
in the weekly RSV of the query “vaccines side effects” from the second week of February 2021
onwards ( = 10, = .009). By narrowing the range to get daily RSVs, a clear level shift can
be observed from 12 to 14 February 2021. In particular, comparing the periods January 20 - February
13 and February 17 - March 9, a dramatic percentage increase in web interest (∆% = 205.7%, =
17.4) was observed. However, the peak is reached on March 11 ( = 100), with a sharp rise
starting on March 9. In the same period, a long series of totally misleading headlines were published
by the main Italian newspapers, thus fomenting the distrust of vaccines [31, 32]. Finally, in the same
periods, the RSV of the query “astrazeneca side effects” has had an extreme increase ∆% =
2991.4%, = 16.9.
3 Discussion
The results of this paper suggest that not only have the main Italian mass media heavily influenced
the trend of web interest in COVID-19, but they have also had a strong impact on the terms adopted
by users to identify the virus. In particular, there was a pronounced disparity between the use of
scientific names and the more infodemic ones: official sources, such as the Ministry of Health or
international medical databases such as PubMed, used little or no infodemic terms such as “2019 n-
cov” (I-scale = 0), “COVID-19” (I-scale = 0), “COVID” (I-scale = 1), “novel coronavirus” (I-scale =
1). On the contrary, in the early stages of the pandemic the mass media used the term “coronavirus”
(I-scale = 4) in about 90% of cases, while from the second half of May 2020 onwards the “COVID-
related” names became the most adopted in the majority of cases. Exceptional situations are those of
RAI and Mediaset, in which the term “coronavirus” remained the most used. Alongside this, when
SARS-CoV-2 was raging in China and the first Italian cases arose, the Italian mass media often
referred to the virus with extremely infodemic terms such as “Chinese coronavirus” (I-scale = 8) or
“Chinese virus” (I-scale = 9), while the query “2019-ncov'' did not produce any results in the RaiPlay
and MediasetPlay search engines. In the same period, strong phenomena of racism towards Chinese
people in Italy were observed [9]. The correlation analysis showed that, during the early stages of the
pandemic, the relative search volume trends of the same keywords were essentially determined by
that of the newspaper headlines on the same topics. Furthermore, the web users responded with a
delay of about 4 months to equalize the use of the terms “COVID-related” with that of the generic
name “coronavirus”. Queries related to the symptoms of the disease also had a trend which is
comparable to that of the newspaper headlines on COVID-19. Indeed, the role of the media was
impacting even as far as mere infodemic is concerned: giving a voice to television commentators with
no medical or epidemiological skills and doctors whose conspiratorial positions were not justified by
scientific literature, they fed a climate of mistrust of health authorities and anti-COVID-19 measures,
both pharmacological and non-pharmacological ones. Evidence for this is that peaks in the relative
search volume of queries on the same topic and/or containing the name of the television guest
concerned with them were detected in conjunction with the aforementioned statements, interviews,
and article titles. Moreover, some among the most viewed videos on news broadcasters’ YouTube
channels had highly infodemic headlines. Specifically, the topics of greatest media and public interest
were: i) the creation of the virus in a Chinese laboratory, a thesis supported by prominent politicians
such as Matteo Salvini and even by the Nobel Prize winner Luc Montagnier; ii) an overestimation of
the COVID-19 crisis, a hypothesis supported by the politician Vittorio Sgarbi but also by Dr. Maria
Rita Gismondo who compared the disease to seasonal flu, and iii) the disappearance of COVID-19,
a hypothesis supported by Dr. Alberto Zangrillo. It should be borne in mind that none of the above-
mentioned notions was supported by any scientific evidence. Finally, there was the “AstraZeneca”
vaccine matter. The European Medicines Agency authorized Astra Zeneca’s SARS-CoV-2 vaccine
for use in all adults aged over 18 on 29 January 2021 [36]. The first concerns about its inoculation
arose with the suspension in several European countries, including Italy, in early March 2021 [37].
Although it was specified that these suspensions were merely precautionary, many Italian newspapers
used unnecessarily alarmist and terrifying headlines due to some reports of possible thromboembolic
events. This event has also been reported by the website “Bufale.net”, a private Italian fact-checking
portal against disinformation, hoaxes and alarmism that are rampant on the Internet [31]. Thus,
although the vaccine has now been re-approved by the European Medicine Agency [38], queries about
its possible side effects still have an increasing trend as shown in Figure 5. Therefore, the answers to
questions R1, R2, R3 and R4 are, respectively: R1) the Italian media have substantially influenced
the Italian web user in the adoption of terms used to identify the novel coronavirus (COVID-19
disease), R2) the Italian media have substantially influenced the web interest of Italian users in the
novel coronavirus topic (COVID-19 disease), R3) the Italian media have contributed in a remarkable
way to the spread of fake news and unjustified alarmism related to the novel coronavirus (COVID-
19 disease), and R4) Google Trends has shown great limitations as a predictive tool of possible
epidemiological situations as the average web user has been strongly addressed by the mass media
also and even in the search for COVID-19 symptoms.

Limitations
This analysis was subject to some limitations. First, there are no guarantees that the interest of Italian
web users can represent a true-to-life picture of the entire Italian population interests, thus limiting
the conclusions of this paper to Italian Internet users. Furthermore, causal correlations were only
searched between Google Trends relative search volume and the titles used by the two main Italian
newspapers. Future research could investigate the correlations between the Italian population and the
mass media, also involving non-netizens and all Italian media. Finally, the paper cannot represent the
totality of the interests of web users that arose during the COVID-19 pandemic.

Conclusions
Since the main Italian mass media have strongly influenced both the perception of risk and interest
of Italian web users towards the novel coronavirus (COVID-19 disease), we suggest that the Italian
authorities put strict and effective controls on the information circulating in Italy. Furthermore, the
authors of this paper invite the directors of the main Italian newspapers and newscasts to stick to the
scientific denominations of SARS-CoV-2 or any other future viruses or diseases, choosing less
sensationalist article titles so as not to foment the infodemic. Finally, the authors of this paper
recommend carefully weighing the influence of mass media on users' web searches before adopting
any epidemiological predictive models based on Google Trends or similar infoveillance tools.
4 Methods
4.1 Design
To evaluate the impact of the media on Italian users’ web interest, we compared the use of specific
keywords by the main Italian media with the relative search volume (RSV) of the same keywords on
Google Trends, looking for: i) significant and substantial correlations and cross-correlations between
RSVs and the article titles of the two most read newspapers, ii) triggering events, i.e., events that
triggered a trend (e.g., the beginning of a trend of the query “the covid does not exist” in conjunction
with related public statements reported by newspapers), and iii) similarities and differences in
keyword adoption rates.

4.2 Data collection
Given the heterogeneity of the data collected, different methods were used for each type of source
investigated. Specific keywords were searched in specific periods according to the following scheme:
 - January 1 – February 13, 2020 (period 1): 2019-ncov, novel coronavirus, coronavirus, chinese
 virus, chinese coronavirus.
 - February 11 – May 18, 2020 (period 2): sars-cov-2, covid-related (i.e. covid, covid 19,
 covid19, covid-19), novel coronavirus, coronavirus
 - May 19, 2020 – March 17, 2021 (period 3): sars-cov-2, covid-related (i.e. covid, covid 19,
 covid19, covid-19), novel coronavirus, coronavirus
Given the diversity of the search algorithms of the investigated platforms, different selection criteria
were adopted in order to make the results comparable.
 - PubMed: the results of each query were counted. Since the search engine provided
 intersections in the results for the “coronavirus” ( ) and “novel coronavirus” ( ) queries, the
 − calculation was performed to estimate the exact number of the former.
 URL: https://pubmed.ncbi.nlm.nih.gov/

 - Ministry of Health: the number of official press releases containing each specific query was
 counted.
 URL:http://www.salute.gov.it/portale/nuovocoronavirus/archivioComunicatiNuovoCoronav
 irus.jsp?lingua=italiano&anno=2020&area=nuovocoronavirus&comunicati.page=4

 - Google: the number of results containing each specific query was counted.
 URL: https://www.google.it/

 - La Repubblica: data was collected from the official archive. The titles containing each of the
 specific keywords have been counted. The “advanced search” and “exact search” filters were
 used.
 URL: https://ricerca.repubblica.it/repubblica/archivio/repubblica/

 - Il Corriere della Sera: data was collected from the official archive. The titles containing each
 of the specific keywords have been counted. Since the search engine provided intersections
 in the results for the “coronavirus” ( ) and “novel coronavirus” ( ) queries, the −
 calculation was performed to estimate the exact number of the latter. The “free search” filter
 was used.
URL: http://archivio.corriere.it/Archivio/interface/landing.html

 - Titoli Giornali (Other Newspapers): data was collected from the official archive. The titles
 containing each of the specific keywords have been counted.
 URL: https://www.titoligiornali.it/

 - Rai (Google News): the number of results containing each specific query was counted. The
 term “rai” has been added to each query. The selected item was “Google News”.
 URL: https://www.google.it/
 - Mediaset (Google News): the number of results containing each specific query was counted.
 The term “rai” has been added to each query. The selected item was “Google News”.
 URL: https://www.google.it/

 - YouTube: the number of results containing each specific query was counted. Each query was
 accompanied by the name of the YouTube channel investigated. The filter “sort by number of
 views” was used.
 URL: https://www.youtube.com/

 - Google Trends. All data on the searched queries was downloaded in the “.csv” file format.
 The exact list of keywords is shown in section 2 (Results).
 URL: https://trends.google.it/trends/

4.3 Statistical analysis
Linear regression
When data were normally distributed, the angular coefficient ( ) of the interpolating line was
calculated to evaluate the importance or absence of a trend. Moreover, Pearson ( ) and adjusted
Pearson (∗ ) coefficients were also calculated. Finally, the percentage of variability of the dependent
variable explained by the independent variable ( . . = 2 ∙ 100) was calculated.
Mann-Kendall test
To highlight the presence of trends within a dataset, after an initial graphical analysis, the Mann-
Kendall test ( ) was used. Furthermore, the importance of the trend was evaluated with the Sen's
slope (SS).
Mean values
The mean value of a data series “ ” was indicated with “ ”. All average values were presented in
the form “ ± ”, where “ ” indicates the standard error of the mean. These measurements
were used when the datasets were normally distributed or containing at least 30 elements [33]. The
variability of a dataset was evaluated through the percentage standard deviation ( %), calculated as
the ratio between the standard deviation and the mean value multiplied by 100.
Percentage increases
The percentage increases between two time-dependent values were calculated with the following
formula:
 % = [ ( + | |) − ( )]/ ( ) ∙ 100.
When the values did not depend on time, the following formula was used:
 % = 100 ∙ ( 2 − 1 )/ { 1 , 2 }.
Percentage differences
The percentage difference between two values was calculated with the formula:
 % = 200 ∙ | 2 − 1 |/( 1 + 2 ).
Pearson and Spearman correlations
When the datasets were normally distributed, Pearson's correlation ( ) was used; otherwise,
Spearman's ( ) was used. The correlation strength was assessed independently of the P-values. When
arithmetic averages containing both correlations were calculated, the notation “ ” was used.

P-values and significance threshold
P-values were used as a continuous measure of the strength of evidence against the null hypothesis
[34]. However, an indicative significance threshold of 5% ( = .05) was set in all tests.
Shapiro-Wilk test
To evaluate the distributive normality of a dataset, the Shapiro-Wilk test combined with a graphical
analysis was used.
Welch's t-test
When the datasets were found to be normally distributed, Welch’s t-test ( ) was used. Furthermore,
when the size of the analyzed sets exceeded 30 elements, the central limit theorem was exploited to
use Welch’s test even with data not normally distributed [35]. Two values were judged to belong to
different distributions approximately when > 1.9.

4.4 Software
Microsoft Excel 2020 software was used for data analysis. In addition, RealStatistics
(https://www.real-statistics.com/) and XLSTAT (https://www.xlstat.com/en/) packages were used.
References [1] Verma, P., Dumka, A., Bhardwaj, A., Ashok, A., Kestwal, M.C., Kumar, P. A Statistical Analysis of Impact of COVID19 on the Global Economy and Stock Index Returns. SN Comput Sci. 2(1):27; 10.1007/s42979-020-00410-w (2021). [2] Akande, O.W., Akande, T.M. COVID-19 pandemic: A global health burden. Niger Postgrad Med J. 27(3):147-155; 10.4103/npmj.npmj_157_20 (2020). [3] COVID-19 Dashboard by the Center for Systems Science and Engineering (CSSE) at Johns Hopkins University (JHU). Johns Hopkins University & Medicine. Accessed: March 21, 2021. https://coronavirus.jhu.edu/MAP.HTML [4] Managing the COVID-19 infodemic: Promoting healthy behaviours and mitigating the harm from misinformation and disinformation. World Health Organization (WHO). Accessed: March 21, 2021. https://www.who.int/news/item/23-09-2020-managing-the-covid-19-infodemic-promoting-healthy- behaviours-and-mitigating-the-harm-from-misinformation-and-disinformation [5] Cinelli, M., et al. The COVID-19 social media infodemic. Sci Rep. 10, 16598; 10.1038/s41598- 020-73510-5 (2020). [6] Ferrara, E., Cresci, S., Luceri, L. Misinformation, manipulation, and abuse on social media in the era of COVID-19. J Comput Soc Sc. 3, 271–277; 10.1007/s42001-020-00094-5 (2020). [7] Gottlieb, M., Dyer, S. Information and Disinformation: Social Media in the COVID-19 Crisis. Acad Emerg Med. 27(7):640-641; 10.1111/acem.14036 (2020). [8] Islam, M.S. et al. COVID-19-Related Infodemic and Its Impact on Public Health: A Global Social Media Analysis. Am J Trop Med Hyg. 103(4):1621-1629; 10.4269/ajtmh.20-0812 (2020). [9] Rovetta, A., Bhagavathula, A.S. COVID-19-Related Web Search Behaviors and Infodemic Attitudes in Italy: Infodemiological Study. JMIR Public Health Surveill. 6(2): e19374; 10.2196/19374 (2020). [10] Rovetta, A., Bhagavathula, A.S. Global Infodemiology of COVID-19: Analysis of Google Web Searches and Instagram Hashtags. J Med Internet Res. Aug; 22(8): e20673; 10.2196/20673 (2020).
[11] Dagher, S.H., Lamé, G., Hubiche, T., Ezzedine, K., Duong, T.A. The Influence of Media
Coverage and Governmental Policies on Google Queries Related to COVID-19 Cutaneous
Symptoms: Infodemiology Study. JMIR Public Health Surveill. 7(2): e25651; 10.2196/25651 (2021).

[12] González-Padilla, D.A., Tortolero-Blanco, L. Social media influence in the COVID-19
Pandemic. Int Braz J Urol. 46(Suppl 1): 120–124; 10.1590/S1677-5538.IBJU.2020.S121 (2020).

[13] Milinovich, G. J., Williams, G. M., Clements, A. C. A. & Hu, W. Internet-based surveillance
systems for monitoring emerging infectious diseases. Lancet Infect. Dis. 14, 160–168;
10.1016/S1473-3099(13)70244-5 (2014).

[14] Brodeur, A., Clark, A.E., Fleche, S., Powdthavee, N. COVID-19, lockdowns and well-being:
Evidence from Google Trends. J Public Econ. 193: 104346; 10.1016/j.jpubeco.2020.104346 (2020).

[15] Garaus, M., Garaus, C. The Impact of the Covid-19 Pandemic on Consumers' Intention to Use
Shared-Mobility Services in German Cities. Front. Psychol. 12:646593; 10.3389/fpsyg.2021.646593
(2021).

[16] Greene, S.K. et al. Nowcasting for Real-Time COVID-19 Tracking in New York City: An
Evaluation Using Reportable Disease Data From Early in the Pandemic. JMIR Public Health Surveill.
7(1):e25538; 10.2196/25538 (2020).

[17] Kristensen, K., et al. Exploring the use of web searches for risk communication during COVID-
19 in Germany. Sci Rep. 11, 6419; 10.1038/s41598-021-85873-4 (2021).

[18] Wong, M.Y.Z., Gunasekaran, D.V., Nusinovici, S., Sabanayagam, C., Yeo, K.K., Cheng, C.,
Tham, Y. Telehealth Demand Trends During the COVID-19 Pandemic in the Top 50 Most Affected
Countries: Infodemiological Evaluation. JMIR Public Health Surveill. 7(2):e24445; 10.2196/24445
(2020).

[19] Google Trends. GoogleTM. https://support.google.com/trends/

[20] Cervellin, G., Comelli, I., Lippi, G. Is Google Trends a reliable tool for digital epidemiology?
Insights from different clinical settings. J Epidemiol Glob Health. 7(3):185-189;
10.1016/j.jegh.2017.06.001 (2017).

[21] Rainews official website. Emergenza coronavirus. Accessed: March 17, 2021.
https://www.rainews.it/ran24/speciali/2020/covid19/world.php

[22] SkyTg24 official website. Coronavirus. Accessed: March 17, 2021.
https://tg24.sky.it/mondo/coronavirus

[23] Haahr, M. Random.org. School of Computer Science and Statistics. Accessed: March 10, 2021.
https://www.random.org/integers/?num=6&min=1&max=100&col=1&base=10&format=html

[24] Menichini, R. No vax e complottisti: i social corrono ai ripari contro la disinformazione. La
Repubblica. March 13, 2021. Accessed: March 19, 2021.
https://www.repubblica.it/esteri/2021/03/13/news/no_vax_e_complottisti_i_social_corrono_ai_ripar
i_contro_la_disinformazione-292022010/

[25] Za, V., Landini, F. Coronavirus clampdown spreads fear and doubt in northern Italy. Reuters.
February 23, 2020. Accessed: March 20, 2021.
https://www.reuters.com/article/us-china-health-italy-anxiety/coronavirus-clampdown-spreads-fear-
and-doubt-in-northern-italy-idUKKCN20H0OS

[26] La7 official website. Coronavirus, Vittorio Sgarbi: “Non è un'epidemia perché non c'è rischio di
morte”. La7.it. February 24, 2020. Accessed: March 20, 2021.
https://www.la7.it/otto-e-mezzo/video/coronavirus-vittorio-sgarbi-non-e-unepidemia-perche-non-
ce-rischio-di-morte-24-02-2020-309263
[27] Benedictus, L. No, Italy hasn’t recounted its coronavirus data and found that most died from
other diseases. Full Fact. May 22, 2020. Accessed: March 20, 2021.
https://fullfact.org/health/sgarbi-coronavirus/

[28] Nardelli, A., D’Urso, J. Italy’s Far-Right And Nationalist Leaders Are Pushing Debunked
Conspiracy Theories About The Coronavirus To Millions Of Followers. BuzzFeed.News. March 26,
2020. Accessed: March 20, 2021.
https://www.buzzfeed.com/albertonardelli/coronavirus-matteo-salvini-giorgia-meloni-conspiracy

[29] Luna, R. Coronavirus, scienziati italiani denunciano guru online complottista. La Repubblica.
March 25, 2020. Accessed: March 20, 2021.
https://www.repubblica.it/scienze/2020/03/25/news/coronavirus_gl_scienziati_italiani_denunciano_
i_guru_online_che_gridano_al_complotto-252285764/
[30] La Repubblica editorial staff. Coronavirus, Zangrillo: “Il Covid non esiste più, qualcuno
terrorizza il paese”. Richeldi: “No, il virus circola”. May 31, 2020. Accessed: March 20, 2021.
https://www.repubblica.it/cronaca/2020/05/31/news/coronavirus_zangrillo_il_covid_clinicamente_
non_esiste_piu_qualcuno_terrorizza_paese-258111004/

[31] “Bufale” editorial staff. “I giornali stupiti per i rifiuti al vaccino AstraZeneca dopo giorni di
titoloni su reazioni avverse”. Bufale.net. March 14, 2021. Accessed: March 20, 2021.
https://www.bufale.net/i-giornali-stupiti-per-i-rifiuti-al-vaccino-astrazeneca-dopo-giorni-di-titoloni-
su-reazioni-avverse/

[32] Today.it editorial staff. “AstraZeneca, paura in Europa”: polemiche per il titolo di Repubblica.
Today.it. March 12, 2021. Accessed: March 20, 2021.
https://www.today.it/rassegna/vaccino-astrazeneca-oggi-repubblica.html

[33] Mascha, E.J., Vetter, T.R. Significance, Errors, Power, and Sample Size: The Blocking and
Tackling of Statistics. Anesth Analg. 126(2):691-698; 10.1213/ANE.0000000000002741 (2018).

[34] Amrhein, V., Korner-Nievergelt, F., Roth, T. The earth is flat (p > 0.05): significance thresholds
and the crisis of unreplicable research. PeerJ. 5: e3544; 10.7717/peerj.3544 (2017).

[35] Kwak, G., Kim, J.H. Central limit theorem: the cornerstone of modern statistics. Korean J
Anesthesiol. 70(2): 144–156; 10.4097/kjae.2017.70.2.144 (2017).

[36] Torjesen, I. Covid-19: AstraZeneca vaccine is approved in EU with no upper age limit. BMJ;
372:n295; 10.1136/bmj.n295 (2021).

[37] Wise, J. Covid-19: European countries suspend use of Oxford-AstraZeneca vaccine after reports
of blood clots. BMJ. 372:n699 doi:10.1136/bmj.n699 (2021).

[38] Mahase, E. Covid-19: AstraZeneca vaccine is not linked to increased risk of blood clots, finds
European Medicine Agency. BMJ. 372:n774; 10.1136/bmj.n774 (2021).
Figures

Figure 1

Comparison between weekly RSVs of the keywords “coronavirus” (yellow) and “covid” (green) with the
number of times the latter have been adopted by the newspaper “La Repubblica” (blue and red, resp.)
from January 1 to September 6, 2020. All values were normalized to 100. RSV = Google Trends relative
search volume, t.d.i = titles daily increase.
Figure 2

Comparison between daily RSVs (red) of the keywords “coronavirus” and “covid” with the number of
times they have been adopted by the newspaper “La Repubblica” (blue) from January 12 to March 12,
2020. All values were normalized to 100. The black lines represent the beginning or the end of a trend.
RSV = Google Trends relative search volume, t.d.i = titles daily increase.

Figure 3

Causal implications scheme and linear regression results. V.E. = variability explained, RSV = Google
Trends relative search volume.
Figure 4

Comparison between COVID-19 symptoms-related web queries (Google Trends relative search volumes)
and “La Repubblica” newspaper titles containing the word “coronavirus” from January to May 2020.
Figure 5

Infodemic query RSVs since the start of the pandemic. The "astrazeneca" query is not shown in order to
allow you to view the other RSV trends.

Supplementary Files
This is a list of supplementary les associated with this preprint. Click to download.

 Supplementarymaterial.docx
You can also read