B2bTools: online predictions for protein biophysical features and their conservation
←
→
Page content transcription
If your browser does not render page correctly, please read the page content below
W52–W59 Nucleic Acids Research, 2021, Vol. 49, Web Server issue Published online 31 May 2021
https://doi.org/10.1093/nar/gkab425
b2bTools: online predictions for protein biophysical
features and their conservation
Luciano Porto Kagami1 , Gabriele Orlando1 , Daniele Raimondi 1 , Francois Ancien1,2 ,
Bhawna Dixit1,3,4 , Jose Gavaldá-Garcı́a1,3,4 , Pathmanaban Ramasamy 1,4,5,6 ,
Joel Roca-Martı́nez1,3,4 , Konstantina Tzavella1,3,4 and Wim Vranken 1,3,4,*
1
Interuniversity Institute of Bioinformatics in Brussels, ULB-VUB, Brussels 1050, Belgium, 2 3Bio, Université Libre de
Bruxelles, Brussels 1050, Belgium, 3 Structural Biology Brussels, Vrije Universiteit Brussel, Brussels 1050, Belgium,
Downloaded from https://academic.oup.com/nar/article/49/W1/W52/6290078 by guest on 27 November 2021
4
VIB Structural Biology Research Centre, Brussels, 1050, Belgium, 5 VIB-UGent Center for Medical Biotechnology,
VIB, Ghent 9000, Belgium and 6 Department of Biomolecular Medicine, Ghent University, Ghent, 9000, Belgium
Received February 02, 2021; Revised April 21, 2021; Editorial Decision April 30, 2021; Accepted May 05, 2021
ABSTRACT GRAPHICAL ABSTRACT
We provide integrated protein sequence-based pre-
dictions via https://bio2byte.be/b2btools/. The aim
of our predictions is to identify the biophysical be-
haviour or features of proteins that are not read-
ily captured by structural biology and/or molecu-
lar dynamics approaches. Upload of a FASTA file
or text input of a sequence provides integrated pre-
dictions from DynaMine backbone and side-chain
dynamics, conformational propensities, and derived
EFoldMine early folding, DisoMine disorder, and Ag-
mata -sheet aggregation. These predictions, sev-
eral of which were previously not available online,
capture ‘emergent’ properties of proteins, i.e. the
inherent biophysical propensities encoded in their
sequence, rather than context-dependent behaviour
(e.g. final folded state). In addition, upload of a multi- INTRODUCTION
ple sequence alignment (MSA) in a variety of formats
Traditionally, our understanding of how proteins operate
enables exploration of the biophysical variation ob-
and how evolution shapes them is based on the overall pro-
served in homologous proteins. The associated plots tein fold and its amino acid sequence, using multiple se-
indicate the biophysical limits of functionally relevant quence alignments (MSAs). The recent impressive perfor-
protein behaviour, with unusual residues flagged by mance of AlphaFold (1) demonstrates how well we can now
a Gaussian mixture model analysis. The prediction predict the relationship between these two, however a sig-
results are available as JSON or CSV files and di- nificant part of the proteome shows highly dynamic and/or
rectly accessible via an API. Online visualisation is structurally ambiguous behaviour, which is still very diffi-
available as interactive plots, with brief explanations cult to address. Our single-sequence based DynaMine pre-
and tutorial pages included. The server and API em- dictor (2) and its web server (3) attempted to capture the
ploy an email-free token-based system that can be ‘emerging’ protein backbone dynamics property, as deter-
used to anonymously access previously generated mined by local interactions between amino acids. We have
since extended the DynaMine range of predictors, based on
results.
the same principle, with side-chain dynamics and conforma-
tional propensity, and have developed predictors for early
* To whom correspondence should be addressed. Tel: +32 629 19 52; Email: wim.vranken@vub.be
Present addresses:
Daniele Raimondi, ESAT-STADIUS, KU Leuven, Leuven 3001, Belgium.
Gabriele Orlando, Switch laboratory, KU Leuven, Leuven 3000, Belgium.
C The Author(s) 2021. Published by Oxford University Press on behalf of Nucleic Acids Research.
This is an Open Access article distributed under the terms of the Creative Commons Attribution-NonCommercial License
(http://creativecommons.org/licenses/by-nc/4.0/), which permits non-commercial re-use, distribution, and reproduction in any medium, provided the original work
is properly cited. For commercial re-use, please contact journals.permissions@oup.com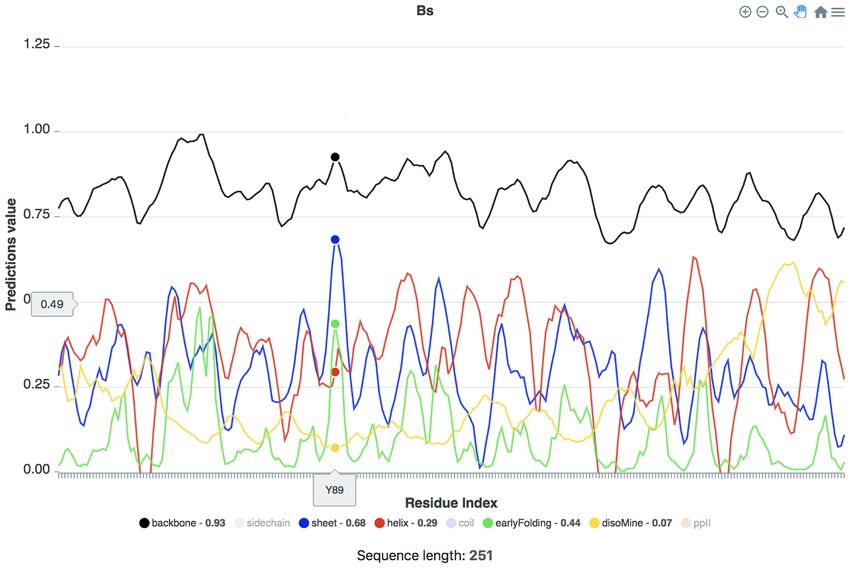
Nucleic Acids Research, 2021, Vol. 49, Web Server issue W53

folding (4), disorder (5) and aggregation (6) that are depen-       Table 1. REST API endpoints
dent on the DynaMine suite predicted biophysical features.          Method              Endpoint                       Description
We now make all these predictions directly available from a
single place in an integrated server, with the side-chain dy-       POST         /msatools/api/             Sends the data in JSON format for
                                                                                                            processing.
namics, conformational propensities, early folding and ag-          GET          /msatools/api/queue/       Gets the data after processing1 .
gregation predictions not previously directly accessible on-
line.                                                               1 It is necessary to use an alphanumeric hash ID provided in the submission
   Within the community, servers already exist that pro-            to obtain the result.
vide a wide variety of predictions for a single protein se-
quence at a time, notably PredictProtein (7), PSIPRED (8)           data. All modern browsers accept the b2bTools frontend,
and SCRATCH (9), whose output includes a variety of pre-            which combines statically rendered HTML documents with
dictions such transmembrane regions, solvent accessibility,         selective layers of interactivity using the jQuery JavaScript
disulfide bonds, antigenicity, etc.. Other servers predict sin-

                                                                                                                                                  Downloaded from https://academic.oup.com/nar/article/49/W1/W52/6290078 by guest on 27 November 2021
                                                                    library. The website uses ApexCharts as its visualization li-
gle features but allow the upload of multiple sequences,            brary, which enables browser-based visualisation of large
for example there are many online predictors of protein             data sets and provides a flexible API. The requests from
disorder, such as Espritz (10), PrDOS (11) and IUPred2A             the web interface are first sent to NGINX and then sent to
(12), with the CAID competition now providing bench-                RESTful APIs.
marking (13). For aggregation predictions, PASTA2.0 (14)               The b2bTools RESTful API is based on the Django
and AGGRESCAN3D (15) exist, while for protein flexibil-             REST framework 3.11 and provides programmatic access
ity, the PredyFlexy server (16) was developed. In addition,         to our predictor tools, for single sequences using a JSON
many predictors exist for secondary structure (17), but cru-        as input, for MSA-based predictions using the multiple se-
cially, these predictions are based on protein structure data       quence alignment file as input (see https://www.bio2byte.be/
from the PDB, whereas the core DynaMine dynamics and                b2btools/documentation/dynamine/ and links therein). Us-
conformational propensities predictions are based on the            ing only two easy-to-use endpoints (Table 1), the API re-
in-solution behaviour of proteins, as observed from their           turns its results in JSON (JavaScript Object Notation) for-
NMR chemical shift values. The DynaMine training data               mat. To obtain the results, it is necessary to use an alphanu-
set also includes a wide range of protein behaviour, from           meric hash ID provided by the submission process, thus en-
fully disordered proteins to well-folded ones, thus enabling        suring greater security and data confidentiality.
it to provide more general predictions on their biophysi-
cal behaviour. These predictions then form the basis for the
unique EFoldMine early folding predictions we provide, as           Job management
well as the DisoMine disorder and Agmata aggregation pre-           The management of computational workflows and batch
dictions. Conceptually, the information we provide relates          jobs depends on the Python RQ 1.2 library (Redis Queue),
to ‘emergent’ properties of proteins, in other words the be-        which is supported by the Redis message broker.
havior the protein is capable of, not its final state in a par-
ticular context (e.g. when folded).
                                                                    Backend
   As a novel feature, to our knowledge not available else-
where, we now attempt to capture how evolutionary pres-             The backend consists of the integrated set of predictors in
sure shapes the (predicted) biophysical features of a pro-          Python 3.7, available as a standalone package from https:
tein, by calculating multiple sequence alignment (MSA)              //bitbucket.org/bio2byte/bio2byte server public/; please see
based statistics. With this approach, we want to highlight          the README.md file therein for a full description. The
conserved biophysical features that cannot be directly ob-          DynaMine suite of predictors (backbone and sidechain dy-
served from a single protein structure, nor from multiple           namics, secondary structure propensities) forms the core of
sequences, hence enabling the exploration of protein be-            the predictions, with EFoldMine dependent on these pre-
haviour and functionality from a new perspective. We also           dictions. DisoMine and Agmata are each in turn depen-
highlight residues that have unusual properties in the 7D           dent on EFoldMine. These predictors are available from the
‘biophysical space’ we predict through a Gaussian mixture           singleSeq/ directory in the package. The MSA-based pre-
model that is directly trained on the MSA-based statis-             dictions include the DynaMine, EFoldMine and DisoMine
tics. This functionality is available at https://bio2byte.be/       predictions, and are available from the multipleSeq/ direc-
b2btools/, and makes the concept of biophysical features            tory. Additional external dependencies are joblib v0.14.1,
and their conservation available to the scientific community.       numpy v1.19.1, Pillow v7.0.0, pomegranate v0.13.5, scikit-
This website is free and open to all users and there is no lo-      learn v0.21.3, scipy v1.4.1, six v1.14.0, pytorch v1.3.1,
gin requirement.                                                    torchvision v0.4.2 and matplotlib v3.1.2. General code em-
                                                                    ployed in the server, e.g. a parser for MSA’s, is available
MATERIALS AND METHODS                                               in the general/ directory. Ready-to-run python scripts are
                                                                    available in the run/ directory, and additional information
Frontend
                                                                    on how to run it can be found employing the –h flag while
The website (https://bio2byte.be/b2btools/) is implemented          running the script.
in Python 3.7 using the Django 3.0 framework. We use                   The MSA-based predictions can handle most common
the NGINX HTTP server as a gateway and an SQLite 3                  MSA formats (CLUSTAL, FASTA, STOCKHOLM, BAL-
database for persistent storage and retrieval of requested          IBASE, PSI, A3M, BLAST and PHYLIP). This feature was
W54 Nucleic Acids Research, 2021, Vol. 49, Web Server issue

originally developed in the context of the RNAct project              • For single sequences as an input, the user can upload
(http://rnact.eu/) to compare the biophysical characteristics            a file containing one or several unaligned sequences
of different RNA Recognition Motif (RRM) families at the                 in FASTA format (in ‘Choose File’). Alternatively, it is
MSA level (available from https://bitbucket.org/bio2byte/                possible to type or paste sequences in FASTA format
seqrrm/), but was adapted and implemented for use on                     in the input text box.
the server. From the MSA, the non-gapped individual se-               • For multiple sequence alignments (MSA) as an input,
quences are recreated, on which the predictions are com-                 the user can upload a file in a variety of formats,
puted. The obtained results are then mapped back to the                  such as CLUSTAL, FASTA, STOCKHOLM, BAL-
original alignment, so that each position in the MSA is                  IBASE, PSI, A3M, BLAST and PHYLIP. The input
associated with NP-NG prediction values for each predic-                 text box does not work for MSAs.
tion type, with NP being the total number of sequences in             At this point, the web page will try to detect the type
the MSA, NG being the number of gaps in that column.                  of file within the frontend browser, and the page will be
Per MSA column, 5 statistical values are then calculated;             updated accordingly. When pressing ‘submit’ the protein

                                                                                                                                      Downloaded from https://academic.oup.com/nar/article/49/W1/W52/6290078 by guest on 27 November 2021
top outlier, first quartile, median, third quartile and bottom        sequence data will be sent to the server, parsed and vali-
outlier. Individual protein predictions that fall within the          dated, and the sequences will be identified, leading to the
quartile range are therefore ‘normal’ with respect to the se-         next page.
quences in the MSA, while values outside of this range in-         3. The user can then decide which predictions to run on
dicate deviating behaviour for the sequence under study. To           their data:
quantify this deviating behavior, a further statistical study is      • For single sequences, a list of the protein identifiers de-
performed to assess which residues have biophysical behav-               tected in the FASTA file will be displayed, and on the
ior that deviates significantly from the MSA. The biophys-               left-hand side the user can select the predictors to run.
ical predictions calculated for all the individual sequences             Currently, Dynamine, Disomine, EFoldMine, and Ag-
in the MSA are fitted on-the-fly using a Gaussian mixture                mata can be selected simultaneously to generate inte-
model (GMM) with a single component using the sklearn                    grated results, with PSPer available separately. Brief
Python library. This allows reduction of the number of di-               explanations are provided for each tool under ‘Info’.
mensions from the seven biophysical predictions (backbone                There is presently a limit of 10 sequences for Agmata,
and sidechain dynamics, helix, sheet, coil and early fold-               and of 50 sequences for all other predictors, to be re-
ing propensities and disorder) to a single scoring value. The            vised in the future.
more negative the value, the further that residue is from the         • For MSAs, the number of aligned sequences is shown.
MSA-based model. This enables determination of residues                  Click the ‘Run predictions’ button to obtain the Dy-
that are over the 95, 99 and 99.9 percentiles as estimated by            naMine, EFoldMine and DisoMine predictions, with
the GMM, which are indicated in the visualization.                       a brief explanation available under ‘More info’. There
                                                                         is presently a limit of 200 sequences.
                                                                   4. The result page should load within a few seconds for
RESULTS
                                                                      uploaded files, although Agmata results are significantly
For an overview of the input, predictions and output/                 slower, taking up to a couple of minutes.
visualisation possibilities, see Figure 1. Below we describe       5. For both single sequence(s) and MSAs, results are shown
in more detail how to use the web server for single sequence          as interactive plots, with the top plot showing the results
predictions, and for predictions based on a multiple se-              for one protein at a time. The protein to display can be
quence alignment (MSA).                                               selected using the dropdown menu at the top of the page.
                                                                      The plot itself shows the selected tool’s predictions along
                                                                      the protein sequence. By default, only the requested re-
Obtaining and displaying predictions
                                                                      sults are shown, but additional available predictions can
1. The first step in using the b2bTools web server is generat-        be toggled on by clicking on their name in the legend;
   ing a unique token or using a previously generated one             in general, predictions can be toggled off or on this way
   (top left of page). The token ensures secure web server            by clicking on their name in the legend underneath the
   access; users only have access to their results with the to-       plot. The x-axis range can be changed in two ways: by
   ken, and no credentials have to be entered. The token              using the two-way slider above the plot, with the start
   can be re-used to retrieve or delete earlier results when          and end residue indicated, or by entering values man-
   accessing the web server, for example for jobs that take           ually in the boxes above the slider. When hovering the
   a long time to finish. Without this unique token, earlier          cursor over the plot, its position is shown, with on the y-
   results cannot be accessed any more. Note that we pro-             axis the current value, and on the x-axis the amino acid
   vide the option to send the token to the user via e-mail           one-letter code and sequence position number. The ac-
   via the ‘Send token to email’ option in the top bar, but           tual predicted values are shown in the legend. Hovering
   this is not obligatory.                                            the cursor over a particular label in the legend will high-
2. The second step is to provide the protein sequence(s) for          light the corresponding values in the plot. The menu at
   prediction. Examples for each type of protein sequence             the top right of the plot offers a selection of functions,
   input are available for direct testing on the left-hand side       providing from left to right:
   of the page under ‘Test examples’, which will go directly          • Zoom in
   to step 3. The user can provide their own sequence(s) in           • Zoom out
   the following way:                                                 • Selection zoom: zoom in the selected region of the plot
Nucleic Acids Research, 2021, Vol. 49, Web Server issue W55
Downloaded from https://academic.oup.com/nar/article/49/W1/W52/6290078 by guest on 27 November 2021
Figure 1. Overview of the joint input for the b2bTools server (left), the predictions that are accessible depending on input type (middle) and the output
possibilities (right). The bottom box in grey relates to tools described elsewhere which are also accessible from the joint input page.
• Panning: drag the view around the plot disomine/. In this case, step 3 of the above pipeline will be
• Reset zoom: reset the zoom to default view skipped, and the results immediately shown. In addition,
• Download: images as SVG and PNG, data in CSV for- it is possible to access all results previously generated with
mat your current token via the ‘Past results’ link in the top bar.
A detailed explanation of the different predictions is
available by clicking on ‘Click for explanation’ under-
Case studies
neath the plot.
For MSAs, a second plot is available that compares the Single sequence prediction. As a case study to highlight
results of the selected protein (for the top plot) with the the analysis possibilities of the server, we present 10 pro-
distribution of predicted values for all the sequences in teins that form TIM barrel folds (with codes Bs, Ch, Ec,
the MSA; the black line is the median, the dark grey Hu, Lm, Pf, Tb, Tm, Vm, Ye), which were previously com-
lines first/third quartile, and the light grey line the out- pared and their thermostability studied (18). These proteins
lier range. Only MSA positions that are not gaps in the all adopt TIM barrel folds, but have relatively low shared
selected protein are shown, with the predictions for the pairwise sequence identities (37%-55%, with 3 outliers that
protein in red. The user can select which prediction val- have higher shared identity, Tb-Lm, Ch-Hu and Ec-Vm).
ues to display from the dropdown menu below the plot. To this dataset we added the sTIM-11 protein, successfully
The other options are the same as described for the top designed de novo to fold as a TIM barrel by using a subunit
plot. A detailed explanation is available by clicking on repeat strategy, and the OctaV1 protein, which was designed
the ‘Click for explanation’ underneath the plot. In addi- to fold as a TIM barrel, but in fact folds differently, even
tion, when hovering over the top plot, the results from though its secondary structure elements are generally in the
the GMM are given for the residue corresponding to the intended (TIM barrel) positions (19). An interactive ver-
x-axis position, with more negative values meaning this sion of these data is available via https://www.bio2byte.be/
residue is unusual in relation to the values observed in b2btools/tutorial/singleseq/. By default, the interactive plot
the MSA. The displayed values are colour-coded when displays the predictions (y-axis) in relation to the protein se-
below the 5% (orange), 1% (red) and 0.1% (dark red, quence for the selected protein (x-axis). All predictions are
white text) percentile limits calculated from all values in this case turned on, but you can toggle individual predic-
for all proteins in the MSA. An overview of the num- tions on and off by clicking on their name below the plot.
ber of residues belonging to these categories, with their When you run a specific predictor, for example DisoMine,
percentage in relation to the overall length of the pro- only that data will be displayed, but all predictions that were
tein, is shown underneath the sequence length informa- executed to obtain the final one will be available; click on
tion (GMM score analysis), together with the list of rel- their name below the plot to display them. When you hover
evant residues. over the plot, it will display the amino acid residue that the
6. For the predicted results, the user can access the API di- cursor is currently on (x-axis, Y89 in Figure 2), and the cor-
rectly via the ‘API’ button, or they can download the responding prediction values are listed next to their name at
results in JSON or CSV format. For MSA-based pre- the bottom of the plot (see Figure 2). The length of the dis-
dictions, two CSV files are available, one with the per- played protein sequence is visible underneath the plot (here
protein predictions, one with the MSA-based statistics. 253 residues), and a brief explanation of the interpretation
Both are organised according to the MSA, with gap po- for the predictions is available by ‘Click for explanation’.
sitions shown as None. Figure 2 shows the individual DisoMine (and related)
predictions, with the ‘sidechain’, ‘coil’, and ‘ppII’ values
Note that it is also possible to directly access a predic- turned off, for the Bs protein (Uniprot P00943, a structure
tor by using a direct link, for example https://bio2byte.be/ is available as PDB code 1BTM; note that such structureW56 Nucleic Acids Research, 2021, Vol. 49, Web Server issue
Downloaded from https://academic.oup.com/nar/article/49/W1/W52/6290078 by guest on 27 November 2021
Figure 2. Single sequence predictions for the Bs protein as displayed in the server, showing the Dynamine backbone dynamics (black), sheet (blue) and helix
(red) propensities, and the early folding (green) and disorder predictions (yellow). The prediction values for the amino acid residue (here Y89) corresponding
to the cursor position (large dots) are shown next to their name in the legend at the bottom.
information is not used in our predictions). This protein between amino acids in the OctaV1 sequence seem to de-
has low DisoMine (disorder) values, except for the last 25 termine a different overall behaviour, which might in this
C-terminal residues, which do have strong helix propensi- case influence the secondary structures that are formed first
ties. The DynaMine backbone dynamics values are gener- when folding, and so change the fold it finally obtains. These
ally above 0.80, in agreement with the fact that this is a differences are highlighted in the MSA-based visualisation.
well-folded protein (see https://www.ebi.ac.uk/pdbe/pdbe-
kb/proteins/P00943 for an overview). Overall, for all the MSA-based prediction. We aligned the 11 sequences of
other TIM barrel proteins, there are consistent peaks for TIM barrel proteins described above based on their struc-
beta sheet propensities, which tend to coincide with the tures in the PDB with the PROMALS3D server (20,21),
early folding peaks (e.g. Y89 in Figure 2), with helix propen- and added to this alignment, based on the location of its
sities generally of similar maximum height as the beta sheet. secondary structure elements (19), the OctaV1 sequence.
Displaying the designed sTIM-11 protein online (data not We here describe the results for the resulting MSA. An in-
shown here) will evidence the subunit repeats, as groups teractive version is available via https://www.bio2byte.be/
of signals are repeated 4 times, with some differences be- b2btools/tutorial/msatools/, the MSA used to generate the
cause of the fine-tuning of their final design. This protein plots is available from supplementary data. The first plot
is shorter, but the overall pattern of the signals is similar to at the top of the page is the same as described for the sin-
that of the natural TIM barrel proteins. The OctaV1 pro- gle sequence prediction, with the individual sequence recre-
tein (data not shown here), despite being designed-based ated without gaps from the MSA information, but now dis-
on a TIM barrel structure template (19), shows more differ- plays the GMM scores in relation to the MSA. The second
ences, with much higher helix propensities in relation to beta plot at the bottom shows, for the protein selected at the top
sheet and early folding peaks corresponding to the regions of the page, the variation in predicted biophysical parame-
with high helical propensity. This indicates that its ‘emer- ters within the MSA. This variation is displayed according
gent’ behaviour, or what the OctaV1 sequence is capable of to simple box plot statistics, with median, first/third quar-
doing based on local amino acid interactions, is quite dif- tile, and outlier range of the distributions shown (Figure 3).
ferent from TIM barrel proteins, whilst the designed sTIM- Columns in the MSA that are ‘gapped’ for the selected pro-
11 remains similar. In other words, the local interactions tein are not shown here. In other words, what is displayedNucleic Acids Research, 2021, Vol. 49, Web Server issue W57
Downloaded from https://academic.oup.com/nar/article/49/W1/W52/6290078 by guest on 27 November 2021
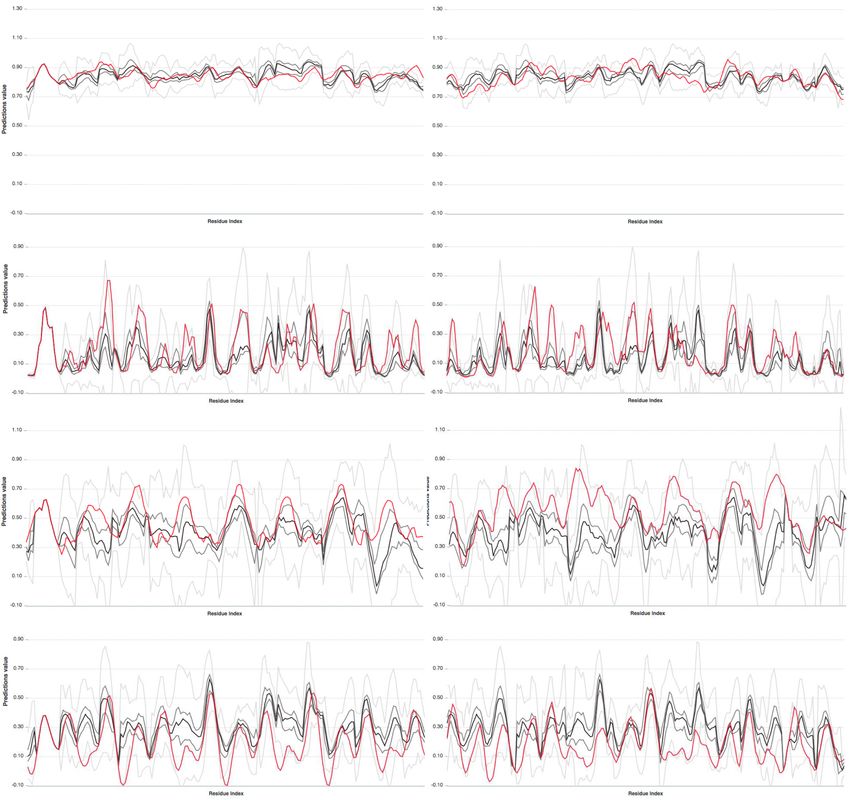
Figure 3. Multiple sequence alignment statistics for the sTIM-11 (left column) and OctaV1 (right column) proteins for backbone dynamics (A, E), early
folding (B, F) and helix (C, G) and sheet propensity (D,H). The regions corresponding to Arg22–Asp35 (sTIM-11) and Lys12–Asp25 (OctaV1) (dash-dot
box), Asp67–Trp76 (sTIM-11) and Ile68–Glu77 (OctaV1) (dashed box) and Lys124–Val131 (sTIM-11) and Phe134–Gly141 (OctaV1) (dotted box) are
indicated. The red lines show the actual sTIM-11 (left) and OctaV1 (right) predictions, the black line the median, the dark grey lines first/third quartile,
and light grey the outlier range for the predicted values for the corresponding position in the MSA. Individual images were created from the ‘Download
png’ plot feature.
is how the biophysical prediction for each aligned position OctaV1 protein, which was designed using Rosetta (22)
varies for all the proteins that are in the MSA, but only based on a TIM barrel structure, but in fact folds differently.
for positions that are not gaps in the selected protein. You For both proteins, the backbone dynamics are very similar
can select the type of prediction that you want to display in to the MSA-based distributions, with the red line mostly
the selection box below the plot and turn each distribution falling within its quartile ranges (dark grey lines). The early
statistic on and off by clicking on its name. The ‘prediction’ folding predictions show some immediate differences, with
field corresponds to the same type of prediction shown in some peaks being higher in both proteins (both proteins,
the top plot. dashed box), many similar (e.g. sTIM-11, dotted box) and
In Figure 3 we compare the individual predictions (red one notably absent (OctaV1 dotted box). Note that the
line) to the MSA statistics (black/grey lines) for backbone dashed and dotted box regions do not correspond exactly to
dynamics, early folding, helix and sheet propensity for the each other due to gaps in the alignment, but they do corre-
successfully de novo designed sTIM-11 protein, and for the spond to the same overall region in the individual sequence.W58 Nucleic Acids Research, 2021, Vol. 49, Web Server issue
The early folding differences imply that, compared to natu- corporate, we provide an integrated set of more general pre-
ral TIM barrel proteins, many regions of both the sTIM-11 dictions on protein biophysical behaviour. Instead of aim-
and OctaV1 protein will start to fold earlier, but only a few ing to predict a final folded state, it is rather the inherent
regions will have delayed folding. From the helix and sheet properties present in the protein, due to local interactions
propensities, it is apparent that overall, the helix propen- of amino acids close to each other in the sequence, that are
sities for sTIM-11 are similar to the MSA-based distribu- targeted. Such a type of analysis can provide a new angle to
tions, whilst OctaV1 has overall higher propensities. Both understanding protein behaviour, and is especially impor-
proteins have generally lower -sheet propensities, but the tant for proteome-scale studies, where the fold or dynamic
pronounced -sheet propensity peaks are present in sTIM- behaviour of many proteins remains unknown and is likely
11, while some notable ones are absent in OctaV1. Relating ambiguous (the ‘dark proteome’) (23).
back to the early folding changes, the dashed region has lit- As a novel feature, to our knowledge not available any-
tle -sheet propensity for both proteins, whilst it has very where, we also attempt to capture how evolutionary pres-
high helix propensity for OctaV1, but similar propensity for sure shapes the (predicted) biophysical features of a protein,
Downloaded from https://academic.oup.com/nar/article/49/W1/W52/6290078 by guest on 27 November 2021
sTIM-11. The dotted region, on the other hand, has similar by calculating multiple sequence alignment (MSA) based
helix propensity in both proteins, while the -sheet propen- statistics. With this approach, we want to highlight con-
sity is similar in sTIM-11, but much reduced in OctaV1 served biophysical features that cannot be directly observed
(outside of the quartile range). Also note that the region from a single protein structure nor from multiple sequences.
preceding the dotted box has much higher helix propen- This enables the exploration of protein behaviour and func-
sity in OctaV1, and much lower -sheet propensity in both tionality from a new perspective, in essence trying to cap-
proteins, with similar early folding propensity. These differ- ture the concept of biophysical features and their conserva-
ences are also reflected in the GMM scores for both pro- tion in a ‘biophysical fingerprint’. This also enables the def-
teins; for OctaV1, 17.51% of residues belong to the worst inition of a 7D ‘biophysical space’ that can be interpreted
5% of values (for all proteins in the MSA), 5.53% to the with methods such as Gaussian mixture models (GMM)
worst 1%, and 0.92% to the worst 0.1%, totalling 23.96%. to pinpoint which residues in which proteins show unusual
For sTIM-11, only 7.78% belong to the worst 5% category, behavior compared to all proteins in the MSA. With re-
and 1.11% to the 1% category. Out of the natural TIM bar- spect to interpretation of such data, we stress that this is
rel proteins, only Bs is more unusual, with 9.56% in the 5% highly dependent on the quality and type of MSA used; a
category, 2.79% in the 1% category, with most of these val- structure-based alignment of similarly folded proteins with
ues in the C-terminal end. To illustrate how the GMM picks highly diverse sequences is likely to highlight features im-
up regions that are unusual with respect to the MSA-based portant for that particular protein fold, whereas an align-
statistics, consider the K12-D25 region for OctaV1 (Figure ment of more closely related sequences within a domain of
3, dot-dash box), the residues of which are all in the worst life might rather delineate the biophysical limits of a spe-
1–5% category. Even though, on sight, the individual pre- cific protein function. Overall, this kind of approach might
dictions seem to be just within the quartile range (except highlight patterns not obvious from protein structures, nor
for sheet), the GMM picks up that the combined predic- from amino acid conservation in MSAs, and can thus com-
tions here have an unusual multi-dimensional distribution, plement computationally intensive approaches to under-
indicating that this region might be relevant for the differ- stand protein behaviour, such as molecular dynamics, and
ent folding of OctaV1. Similarly, the L75 and A75 residues enable in silico screenings of, for example, newly designed
in the I68-E77 region are unusual, whereas the F134-G141 sequences.
region in fact falls within the expected GMM range. We will continue to expand the website with new capabil-
Overall, we therefore expect that this exploratory type of ities, for example the ability to align proteins based on their
analysis can help to highlight relevant differences of inter- biophysical characteristics, similar to what we already pro-
est in proteins via the inherent biophysical characteristics vide for the ShiftCrypt NMR chemical shift-based align-
encoded by protein sequences. For designing sequences, it ments (24,25). In the meantime, we remain very interested
might help alleviate misfolding by comparing to the bio- in feedback from users to pinpoint case studies, and to pro-
physical signal of natural sequences, and in addition could vide suggestions for improvements and novel approaches we
help to identify differences between natural proteins of sim- could include to analyse these data.
ilar structure, for example in relation to changes in fold-
ing pathway (4). Neither of these can, to the best of our
DATA AVAILABILITY
knowledge, be easily determined from the structure, nor
from molecular dynamics simulations. In addition, the anal- The webserver is available at https://bio2byte.be/b2btools/.
yses described here require only the protein sequences, and The API web service is available at https://bio2byte.
a multiple sequence alignment. be/msatools/api/, with documentation available at https:
//bio2byte.be/b2btools/dynamine/ (and for other levels of
prediction: disomine, efoldmine, msatools).
DISCUSSION
The backend b2btools is available at https://bitbucket.
The integrated set of predictors on this web server are org/bio2byte/bio2byte server public/.
free and open to all, using a token-based system for secu- The case study interactive visualisations are available
rity without login requirement. Because of the in-solution at https://www.bio2byte.be/b2btools/tutorial/singleseq/ and
NMR data on which the core DynaMine predictions are https://www.bio2byte.be/b2btools/tutorial/msatools/.
based, as well as the wider set of protein behaviour they in- No accession numbers are available.Nucleic Acids Research, 2021, Vol. 49, Web Server issue W59
SUPPLEMENTARY DATA 9. Cheng,J., Randall,A.Z., Sweredoski,M.J. and Baldi,P. (2005)
SCRATCH: a protein structure and structural feature prediction
Supplementary Data are available at NAR Online. server. Nucleic Acids Res., 33, W72–W76.
10. Walsh,I., Martin,A.J.M., Di Domenico,T. and Tosatto,S.C.E. (2012)
ESpritz: accurate and fast prediction of protein disorder.
ACKNOWLEDGEMENTS Bioinformatics, 28, 503–509.
11. Ishida,T. and Kinoshita,K. (2007) PrDOS: prediction of disordered
We thank Francesco Codice and Francesco Tabaro for work protein regions from amino acid sequence. Nucleic Acids Res., 35,
on previous web services of the group, which inspired the W460–W464.
12. Mészáros,B., Erdos,G. and Dosztányi,Z. (2018) IUPred2A:
current implementation, and Kim Van Roey for thorough context-dependent prediction of protein disorder as a function of
reading of the manuscript and editorial suggestions. redox state and protein binding. Nucleic. Acids. Res., 46,
W329–W337.
13. Necci,M., Piovesan,D. and CAID Predictors, DisProt
FUNDING CuratorsCAID Predictors, DisProt Curators and Tosatto,S.C.E.
(2021) Critical assessment of protein intrinsic disorder prediction.
Downloaded from https://academic.oup.com/nar/article/49/W1/W52/6290078 by guest on 27 November 2021
European Union’s Horizon 2020 research and innova- Nat. Methods, 18, 421–481.
tion programme under the Marie Skłodowska-Curie grant 14. Walsh,I., Seno,F., Tosatto,S.C.E. and Trovato,A. (2014) PASTA 2.0:
an improved server for protein aggregation prediction. Nucleic. Acids.
agreement [813239 to J.R.-M. and J.G.-G.]; Research Foun- Res., 42, W301–W307.
dation Flanders (FWO) [G.0328.16N to P.R., G.O., B.D.]; 15. Zambrano,R., Jamroz,M., Szczasiuk,A., Pujols,J., Kmiecik,S. and
European Regional Development Fund (ERDF); Brussels- Ventura,S. (2015) AGGRESCAN3D (A3D): server for prediction of
Capital Region-Innoviris within the framework of the Op- aggregation properties of protein structures. Nucleic Acids Res., 43,
erational Programme 2014–2020 through the ERDF-2020 W306–W313.
16. de Brevern,A.G., Bornot,A., Craveur,P., Etchebest,C. and Gelly,J.-C.
project [ICITY-RDI.BRU to F.A.]; Vrije Universiteit Brus- (2012) PredyFlexy: flexibility and local structure prediction from
sel Research Council under the Interdisciplinary Research sequence. Nucleic Acids Res., 40, W317–W322.
Program TumorScope [IRP20 to K.T.]. Funding for open 17. Yang,Y., Gao,J., Wang,J., Heffernan,R., Hanson,J., Paliwal,K. and
access charge: European Union’s Horizon 2020 research Zhou,Y. (2018) Sixty-five years of the long march in protein
secondary structure prediction: the final stretch? Brief.
and innovation programme under the Marie Skłodowska- Bioinformatics, 19, 482–494.
Curie grant agreement [813239]. 18. Maes,D., Zeelen,J.P., Thanki,N., Beaucamp,N., Alvarez,M.,
Conflict of interest statement. None declared. Thi,M.H., Backmann,J., Martial,J.A., Wyns,L., Jaenicke,R. et al.
(1999) The crystal structure of triosephosphate isomerase (TIM) from
Thermotoga maritima: a comparative thermostability structural
REFERENCES analysis of ten different TIM structures. Proteins, 37, 441–453.
19. Figueroa,M., Sleutel,M., Vandevenne,M., Parvizi,G., Attout,S.,
1. AlQuraishi,M. (2020) A watershed moment for protein structure Jacquin,O., Vandenameele,J., Fischer,A.W., Damblon,C.,
prediction. Nature, 577, 627–628. Goormaghtigh,E. et al. (2016) The unexpected structure of the
2. Cilia,E., Pancsa,R., Tompa,P., Lenaerts,T. and Vranken,W.F. (2013) designed protein Octarellin V.1 forms a challenge for protein structure
From protein sequence to dynamics and disorder with DynaMine. prediction tools. J. Struct. Biol., 195, 19–30.
Nat. Commun., 4, 2741. 20. Pei,J. and Grishin,N.V. (2014) PROMALS3D: multiple protein
3. Cilia,E., Pancsa,R., Tompa,P., Lenaerts,T. and Vranken,W.F. (2014) sequence alignment enhanced with evolutionary and
The DynaMine webserver: predicting protein dynamics from three-dimensional structural information. Methods Mol. Biol., 1079,
sequence. Nucleic. Acids. Res., 42, W264–W270. 263–271.
4. Raimondi,D., Orlando,G., Pancsa,R., Khan,T. and Vranken,W.F. 21. Pei,J., Tang,M. and Grishin,N.V. (2008) PROMALS3D web server
(2017) Exploring the sequence-based prediction of folding initiation for accurate multiple protein sequence and structure alignments.
sites in proteins. Sci. Rep., 7, 8826. Nucleic Acids Res., 36, W30–W34.
5. Orlando,G., Raimondi,D., Codicè,F., Tabaro,F. and Vranken,W.F. 22. Rohl,C.A., Strauss,C.E.M., Misura,K.M.S. and Baker,D. (2004)
(2020) Prediction of disordered regions in proteins with recurrent Protein structure prediction using Rosetta. Methods Enzymol., 383,
neural networks and protein dynamics. bioRxiv doi: 66–93.
https://doi.org/10.1101/2020.05.25.115253, 28 May 2020, preprint: 23. Perdigão,N., Heinrich,J., Stolte,C., Sabir,K.S., Buckley,M.J.,
not peer reviewed. Tabor,B., Signal,B., Gloss,B.S., Hammang,C.J., Rost,B. et al. (2015)
6. Orlando,G., Silva,A., Macedo-Ribeiro,S., Raimondi,D. and Unexpected features of the dark proteome. Proc. Natl Acad. Sci.
Vranken,W.F. (2020) Accurate prediction of protein beta-aggregation U.S.A., 112, 15898–15903.
with generalized statistical potentials. Bioinformatics, 36, 2076–2081. 24. Orlando,G., Raimondi,D. and F Vranken,W. (2019) Auto-encoding
7. Yachdav,G., Kloppmann,E., Kajan,L., Hecht,M., Goldberg,T., NMR chemical shifts from their native vector space to a residue-level
Hamp,T., Hönigschmid,P., Schafferhans,A., Roos,M., Bernhofer,M. biophysical index. Nat. Commun., 10, 2511.
et al. (2014) PredictProtein–an open resource for online prediction of 25. Orlando,G., Raimondi,D., Kagami,L.P. and Vranken,W.F. (2020)
protein structural and functional features. Nucleic. Acids. Res., 42, ShiftCrypt: a web server to understand and biophysically align
W337–W343. proteins through their NMR chemical shift values. Nucleic Acids
8. Buchan,D.W.A. and Jones,D.T. (2019) The PSIPRED protein Res., 48, W36–W40.
analysis workbench: 20 years on. Nucleic Acids Res., 47, W402–W407.You can also read