Optical and impedimetric study of genetically modified cells for diclofenac sensing - j-sens-sens-syst.net
←
→
Page content transcription
If your browser does not render page correctly, please read the page content below
J. Sens. Sens. Syst., 8, 215–222, 2019
https://doi.org/10.5194/jsss-8-215-2019
© Author(s) 2019. This work is distributed under
the Creative Commons Attribution 4.0 License.

          Optical and impedimetric study of genetically modified
                        cells for diclofenac sensing
       Margarita Guenther1 , Falko Altenkirch2 , Kai Ostermann2 , Gerhard Rödel2 , Ingo Tobehn-Steinhäuser3 ,
                              Steffen Herbst3 , Stefan Görlandt3 , and Gerald Gerlach1
               1 Solid-State Electronics Laboratory, Technische Universität Dresden, 01062 Dresden, Germany
                       2 Institute
                                 of Genetics, Technische Universität Dresden, 01062 Dresden, Germany
                          3 CiS Forschungsinstitut für Mikrosensorik GmbH, 99099 Erfurt, Germany

                         Correspondence: Margarita Guenther (mguenthe@mail.zih.tu-dresden.de)

               Received: 28 March 2018 – Revised: 25 April 2019 – Accepted: 29 April 2019 – Published: 21 May 2019

       Abstract. Whole-cell biosensors, based on genetically modified yeast cells, were employed to detect anthro-
       pogenic micropollutants (e.g. drugs). Specific stimuli, e.g. traces of drugs, lead to the induction of fluorescence
       in the respective cells. Receptors of the cells detect specific signal molecules and induce the formation of flu-
       orescent proteins. In this work, genetically modified cells of the yeast Saccharomyces cerevisiae BY4741 were
       confined in a four-chamber microfluidic cell, providing an optical monitoring of the cell behaviour and their
       supply with the nutrients. The measurements of the time-dependent fluorescence intensity were performed with
       different concentrations of the drug diclofenac, and the sensitivity of yeast cells to diclofenac was demonstrated.
       Cell viability was monitored by simultaneous impedance recording.

1   Introduction                                                   cessitate special laboratories with appropriate staff and lo-
                                                                   gistical efforts. Therefore, small, sensitive, robust, and on-
Anthropogenic micropollutants such as drugs are often              line capable biosensors are needed for on-site applications
barely removed in water treatment plants, eventually enter-        (Steinke et al., 2018; Rau et al., 2014).
ing the water cycle. Pharmaceutical residues in natural and           In this context, whole-cell biosensors, based on geneti-
treated waters have ecotoxicological effects on the aquatic        cally modified yeast cells, which produce a fluorescent pro-
wildlife and can lead to organ damage and general impair-          tein upon sensing diclofenac, are of great interest because of
ment in animals. The anti-inflammatory drug diclofenac is          their low-cost mass production and cost-effective instrumen-
one of the most prescribed and most frequently detected            tation, and the possibility of integrating them into multi-array
compounds in wastewaters and the environment. Low con-             or microprocessor-controlled diagnostic tools. Multisensors,
centrations (1 µg L−1 ) of diclofenac can lead to death of some    based on living cells as biological transducers, could con-
fish species due to liver and kidney failure (Schwaiger et al.,    tribute to an inline-capable wastewater analysis approach.
2004).                                                             Receptors of the cells detect specific signal molecules, and
   In practice, there are very accurate and reliable analytical    directly or upon activation of a signal cascade induce the
methods available for the detection of diclofenac in surface       transcription of a reporter gene, leading to the production
water, e.g. liquid chromatography–tandem mass spectrome-           of a fluorescent protein (Adeniran et al., 2015; Schuller et
try (Hernando et al., 2006; Ferrer-Aguirre et al., 2016), high-    al., 2017). If specific receptors for the substance to be de-
resolution mass spectrometry with liquid chromatography            tected are unknown, compound-responsive promoters can be
(Richardson and Ternes, 2014), gas chromatography–mass             used. The possible cross-sensitivity mediated by different
spectrometry (Deng et al., 2003), or ultra performance liquid      transcription factors (TFs) could be lowered or eliminated by
chromatography (Nováková et al., 2006; Petrie et al., 2015).       incorporating additional signal-specific TF binding sites that
However, they require time-consuming and costly sampling           enhance the desired signal (Schuller et al., 2017).
and subsequent analysis in laboratory environment and ne-

Published by Copernicus Publications on behalf of the AMA Association for Sensor Technology.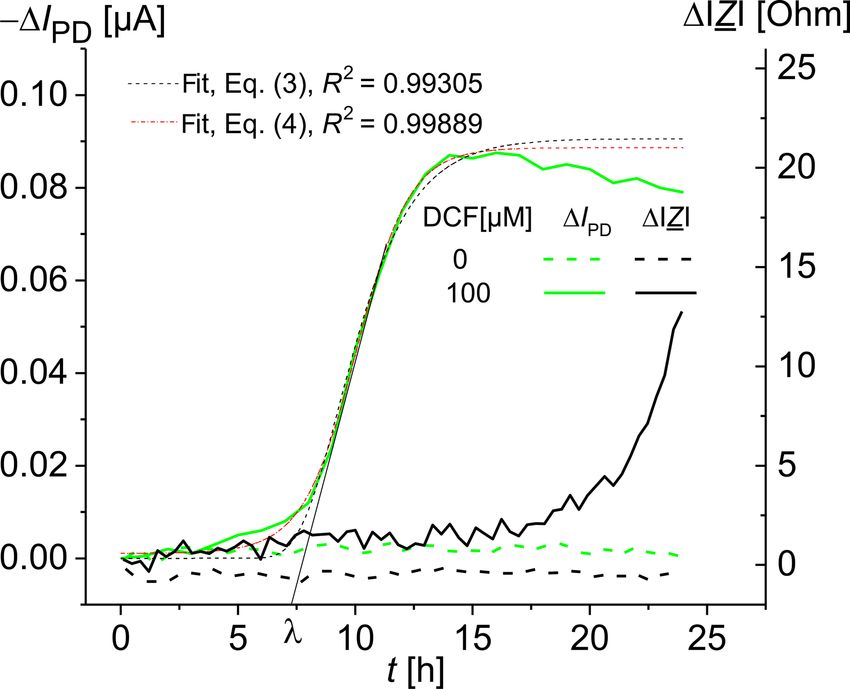
216                                                       M. Guenther et al.: Genetically modified cells for diclofenac sensing

   The diclofenac-responsive promoter of the Saccharomyces               UK), 20 g L−1 d(+)-glucose (Carl Roth GmbH, Ger-
(S.) cerevisiae PDR5 gene is involved in the pleiotropic drug            many), and 2.002 g L−1 Kaiser mix SC complete
resistance (PDR), a mechanism that enables cells to be-                  (Formedium, UK).
come resistant to different cytotoxic compounds. In yeast, di-
clofenac targets are the mitochondrial respiratory chain sub-         – Yeast extract peptone dextrose (YPD): 2 % glucose, 2 %
units Rip1p of complex III and Cox9p of complex IV (Van                 bacto-peptone, 1 % yeast extract.
Leeuwen et al., 2011a). Involved in diclofenac resistance in          – Phosphate-buffered saline (PBS): 137 mM NaCl,
S. cerevisiae are cell wall signaling via the protein kinase            2.7 mM KCl, 10.0 mM Na2 HPO4 , 1.76 mM KH2 PO4 ,
C (PKC) pathway, altered zinc homeostasis, and the induc-               pH 7.4 (Sigma-Aldrich Chemie GmbH, Germany).
tion of PDR (Van Leeuwen et al., 2011b). Diclofenac induces
transcription of the PDR5 gene encoding a plasma mem-                 – Buffer solution: 0.5 M NaCl, 0.5 M imidazole, 20 mM
brane ATP-binding cassette (ABC) transporter that acts as               TRIS.
the main contributor in this PDR response (Van Leeuwen
                                                                   Potassium chloride (KCl) was purchased from Merck (Ger-
et al., 2011b). Hence, the diclofenac-responsive PDR5 pro-
                                                                   many) and diclofenac sodium salt (D6899) from Sigma-
moter is an appropriate candidate for a promoter engineering
                                                                   Aldrich Chemie GmbH (Germany). Low-melting agarose
approach (Schuller et al., 2017).
                                                                   (Plaque agarose, 840101) was obtained from Biozym Scien-
   For quantitative determination of the reporter protein, a
                                                                   tific GmbH (Germany).
real-time quantification of the fraction of viable cells in the
biosensor is necessary (Posseckardt et al., 2018), e.g. by fluo-
rescence or by impedance spectroscopy or by a combination          2.2   Cells and cell culture
of both methods (Günther et al., 2017; Schröder et al., 2017;      In this study, cells of the Saccharomyces cerevisiae
Tobehn-Steinhäuser et al., 2018).                                  (S.cerevisiae) strain BY4741 were used. In order to verify
   In this work, a novel whole-cell biosensor is presented,        the sensitivity of the photonic transducer, the photodiode cur-
in which a perfusion-designed microfluidic system is com-          rent was measured in dependence on the concentration of
bined with an effective and long-term-stable packaging en-         isolated enhanced green fluorescent protein (eGFP) as well
abling the simultaneous read-out of optical and impedimetric       as of S.cerevisiae BY4741-p426GPD-eGFP cells that consti-
signals. The genetically modified yeast cells are completely       tutively express eGFP (Mumberg et al., 1995) (for details,
enclosed in this packaging; the medium continuously flows          see the data in Sect. S1 and Figs. S2, S3, and S4 of the Sup-
through the channels and chambers with living cells. To cre-       plement). However, in the whole-cell sensor device, S. cere-
ate a more realistic cell environment, nutrients and other im-     visiae BY4741 p426PDR5-tGFP cells were used because of
portant media factors were continuously supplied by fresh          the faster folding of tGFP compared to eGFP (Evdokimov
media and removal of waste products. The analysis of the           et al., 2006). Cells transformed with the multicopy plasmid
concentration-dependent optical signal was performed dur-          p426PDR5-tGFP, applying the 5’ untranslated region (UTR)
ing long-term measurements with diclofenac in the measure-         of the PDR5 gene, show a diclofenac-dependent expression
ment medium. Cell metabolic activity was monitored by si-          of the turbo green fluorescent protein (tGFP) (Schuller et al.,
multaneous impedance recording.                                    2017; Van Leeuwen et al., 2011b).

2     Materials and methods                                        Preparation of S. cerevisiae BY4741 p426PDR5-tGFP
                                                                   cells
2.1    Chemicals
                                                                   Yeast cells of strain BY4741 were transformed with 1 µg
The following media were used for the culturing and sus-           plasmid p426PDR5-tGFP, utilizing Zymo Research Yeast
pending yeast cells.                                               transformation kit II according to the manufacturer’s instruc-
    – Minimal medium (MM): 20 g L−1 glucose, 5 g L−1 am-           tions. Transformed cells from overnight cultures (minimal
      monium sulfate, 2.5 g L−1 yeast nitrogen base with-          medium in conical flasks, 30 ◦ C, 180 rpm) were centrifuged
      out amino acids, 60 mg L−1 L-histidin, 80 mg L−1 L-          (3000 × g, 1 min, 20 ◦ C), washed once in minimal medium,
      leucine, 20 mg L−1 L-methionin (Carl Roth GmbH,              and resuspended in minimal medium. The optical density
      Germany).                                                    at λ = 600 nm of an appropriate diluted sample was deter-
                                                                   mined with a VWR V-1200 spectrophotometer. For subse-
    – Synthetic defined medium (SD) (Formedium, UK): 2 %
                                                                   quent experiments, the required number of cells were cen-
      glucose, 0.17 % yeast nitrogen base without ammonium
                                                                   trifuged down and resuspended in the corresponding volume
      sulfate and without amino acids, 0.5 % ammonium sul-
                                                                   of minimal medium.
      fate.
                                                                      The cell numbers were determined by measuring the op-
    – Synthetic complete medium (SC): 6.9 g L−1 yeast nitro-       tical density of the cell suspension at 600 nm (OD600 ). The
      gen base (of which 5 g L−1 is (NH4 )2 SO4 ; Formedium,       relationship between the cell number and OD600 was linear

J. Sens. Sens. Syst., 8, 215–222, 2019                                                  www.j-sens-sens-syst.net/8/215/2019/
M. Guenther et al.: Genetically modified cells for diclofenac sensing 217
only for OD600 ≤ 0.3. Therefore, the cell suspension was di-
luted in order to obtain OD600 between 0.1 and 0.2. After-
wards, the cell numbers were calculated with an OD600 =
1 corresponding to 107 cells mL−1 . Additionally, the cell
numbers were controlled by means of the transmission-
type inverted microscope Bresser-Science IVM-401 with the
Neubauer improved cell counting chamber.
To adjust the optical density of OD600 = 2, the cell num-
ber was determined as stated above, pelleted by centrifuga-
tion, washed, and resuspended in double-concentrated MM.
In order to immobilize cells, 40 µL of the cell suspension
with OD600 = 2 in double-concentrated MM was mixed with
40 µL of 1.5 % low-melting agarose in distilled water at
50 ◦ C, resulting in OD600 = 1 and a 0.75 % agarose in single
MM. Afterwards, each of the lower chambers (a measuring
chamber and a reference chamber) of the four-chamber mi-
crofluidic cell, placed on the glass substrate, was filled with
40 µL of the cell suspension–gel mixture and covered with a
porous polycarbonate (PC) membrane (Fig. 1). After the in-
stallation of the upper part of the microfluidic cell, two cham-
bers of the upper part were connected to a pump. The mea-
Figure 1. Design of the four-chamber microfluidic cell with mea-
surement started after solidification of the cell suspension–
suring and reference channels: top view (a) and cross section
gel mixture by cooling down to 21 ◦ C. During the mea-
through the measuring and reference channel, respectively (b).
surements, the upper microfluidic chamber of the measuring (1) Glass substrate with coated ITO interdigitated electrode arrays,
channel was overflowed with diclofenac (DCF) containing (2) PDMS foil (21.5 mm × 21.5 mm × 0.5 mm) with two openings
MM, whereas MM without diclofenac was pumped through (15 mm × 5 mm), which form the lower chambers, (3) yeast cells
the reference channel. immobilized in gel in the lower chamber, (4) porous polycarbon-
ate membrane, (5) upper chamber in PDMS, (6) upper PDMS part
with fluidic micro-channels, (7) 22x22 MicCell PC rohling system
(GeSiM mbH) with microfluidic connectors, (8) fitting UNF 1/4-28,
2.3 Design of the microfluidic cell
and (9) Tygon®tube 1/1600 OD with a ferrule.
The living cells were immobilized on the glass substrate
in a four-chamber microfluidic cell, allowing the indepen-
dent measurements for the measuring and reference chan- 2.4 Optical read-out
nels (Fig. 1). The optical transmitter–receiver module was
installed below the glass substrate. For the monitoring of the The optical signal was detected using a photonic transducer
cell behaviour, a microfluidic cell (made from polydimethyl- SFD100 (OPTO-MST Sensoren und Systeme GmbH, Erfurt,
siloxane (PDMS), Sylgard 184, Dow-Corning Inc.) was used. Germany), based on a photodiode OC808 (effective active
Two lower chambers (15 mm × 5 mm × 0.5 mm) of the four- area 1 cm2 ). The transducer was integrated in an optical mod-
chamber microfluidic cell, placed on the glass substrate, were ule (CiS Forschungsinstitut für Mikrosensorik GmbH, Erfurt,
filled with 40 µL of the cell suspension–gel mixture and cov- Germany) comprising two blue LED light sources (470 nm,
ered with a porous polycarbonate membrane (Unique-Mem® one for each channel) and the corresponding excitation–
Track-Etched Membrane, thickness 20 µm, pore size 1 µm, emission filter set for the green fluorescent (GFP) proteins
Oxyphen AG, Wetzikon, Switzerland). Afterwards, the up- (Tobehn-Steinhäuser et al., 2018). The photodiode current
per part of the microfluidic cell made using a 22×22 MicCell was measured by means of a current-voltage converter, based
polycarbonate rohling system (GeSiM mbH, Radeberg, Ger- on an operational amplifier OP177, and a LabJack U6-PRO
many) (Gast et al., 2006) was installed. Two chambers of the card.
upper part were connected to a pump and served for the nutri- The LED light sources and the corresponding excitation–
ent or measuring solution supply with a rate of 20 µL min−1 . emission filter set were chosen in accordance with the
The yeast cells (cell size ca. 5 µm) were completely enclosed excitation–emission spectral ranges of the green fluorescent
in this packaging, had no contact with the environment, and proteins. The fluorescence of tGFP (absorption maximum at
were supplied with the nutrients. The packaging enabled a 482 nm, emission maximum at 503 nm, Evdokimov et al.,
simultaneous monitoring of optical and impedimetric signals 2006; Tsien, 1998; Mujiono et al., 2015) was excited by a
by using glass substrates with coated transparent ITO (in- blue LED light source (470 nm, Fig. S1) and detected by an
dium tin oxide) interdigitated electrode arrays (see Fig. S5). OC808 photodiode with an OG515 long-pass emission filter.
www.j-sens-sens-syst.net/8/215/2019/ J. Sens. Sens. Syst., 8, 215–222, 2019218 M. Guenther et al.: Genetically modified cells for diclofenac sensing
The LED light source was supplied with a constant cur- inflection point (t50 ) represents the time of a half-maximal
rent of 8 mA at 26 mV. The temperature near the sample was effect. This model is often used in biochemistry to describe
measured using a temperature sensor LM61CIZ (Texas In- the behaviour of microorganisms under different physical or
struments Inc.). During the operation of the LED light source chemical conditions (Arroyo-López et al., 2009; Zwietering
for 0.5 min, the temperature increase in the sample plane et al., 1990).
was less than 0.5 K. The experiments were carried out under Alternatively, in order to better fit an initial phase of the
clean-room conditions at a constant temperature of 21 ◦ C. growth curve, the following two-part logistic function can be
All experiments were performed as biological triplicates. used:
Afterwards, the mean values and standard deviation (SD)
A2 − A1 A4 − A3
were calculated. The concentration dependence of the opti- y = A1 + + . (4)
(log t1,50 −t)p1
cal signal was fitted with OriginPro (Version 9.1G) using the 1 + 10 1 + 10(log t2,50 −t)p2
Fitting analysis.
2.5 Impedimetric read-out
Data analysis In order to enable a combination of optical and electrical
A four-parameter logistic function (Eq. 1) was used for a re- measurements, transparent ITO (indium tin oxide, 0.5 µm
gression analysis of the sigmoidal dose-response curve: thick) interdigital structures for impedance spectroscopy
were coated on the B270i glass wafers (wafer thickness
A2 − A1 (1.0 ± 0.1) mm) (Fig. S5). The prepared structures were op-
y = A1 + , (1) tically transparent and conductive. The living cells were
1 + 10(log x0 −x)p
immobilized on the glass substrate with two coated ITO-
where x is the concentration of diclofenac and y is the opti- electrode arrays in a four-chamber microfluidic cell.
cal signal. The range between the lower (A1 ) and upper (A2 ) Two ITO-electrode arrays provided the independent
asymptotes is defined as the dynamic signal range, whereas impedance measurements for the measuring and reference
only the 10 %–90 % block of this range is determined as a channels. Each array consists of 24 fingers (with a finger
working range. The inflection point (x0 ) represents the ana- length L of 11 mm). The distance S between the fingers
lyte concentration which corresponds to an increase of 50 % varies between 2.5 and 133.5 µm and the width W between
in the dynamic signal range (effective concentration, EC50). 5 and 186 µm (Fig. S5 and Table S1). Using a multiplexer,
The slope of the tangent in the inflection point is given by the it was possible to connect the finger structures arbitrarily
parameter p. to form arrays or to operate them individually. As a result,
According to the rules of the German standard DIN the penetration depth d of the electric field into the medium
32645:2008-11 (German standard DIN 32645:2008-11, could be varied and estimated as d = W + S (Mamishev et
2008), the limit of detection xLoD was calculated as al., 2004). The multiplexer board (CiS, Erfurt, Germany)
sL consists of a main board and a needle adapter board. The
xLoD = k , (2) latter was detachably connected to the main board by two
p
ZIF flex connections. It consists of a 2 × 12 dual analogue
where sL is the standard deviation of the signal without the multiplexer, 2 × 24 spring contact pins, and four micro coax
analyte (i.e. of the blank measurements) and p is the slope connectors. The main board was connected to an impedance
of the calibration curve. The factor k = 3 was used in com- analyser ISX-3v2 (Sciospec GmbH, Germany). The recorded
pliance with the IUPAC rules (Inczedy et al., 1998; IUPAC, impedance spectrum of the genetically modified yeast cells at
2014). t = 0 h, shown in Fig. S6, was used as a reference.
The time-dependent increase in the optical signal in the The cell constant Kcell = 5.4 cm−1 was determined for
presence of diclofenac was fitted using the modified Gom- interdigitated structures using a calibration medium of
pertz model (Zwietering et al., 1990): 0.1 M KCl solution (Fig. S6).
n hµ e io
max
y = A exp − exp (λ − t) + 1 , (3) 3 Results and discussion
A
with the lag phase duration λ and the maximum specific The sensor concept, based on living cells as biological trans-
growth rate µmax . For the optical signal, y = ln(It /I0 ) ap- ducers, was validated using genetically modified Saccha-
plies, where I0 is the initial value of the signal and It is the romyces cerevisiae cells (strain BY4741), which express the
signal at time t; the asymptote A = ln(Imax /I0 ) is the satu- turbo green fluorescent protein (tGFP).
ration value reached with Imax , and e = exp(1). The maxi- Transformed S. cerevisiae BY4741 p426PDR5-tGFP
mum specific growth rate µmax is defined as the tangent in cells, which express tGFP under the control of the
the inflection point of the three-phase growth curve. The lag diclofenac-responsive PDR5 gene promoter, were immobi-
time λ is defined as the t-axis intercept of this tangent. The lized in a 0.75 % agarose gel and confined in a microfluidic
J. Sens. Sens. Syst., 8, 215–222, 2019 www.j-sens-sens-syst.net/8/215/2019/M. Guenther et al.: Genetically modified cells for diclofenac sensing 219
cell, installed on the glass substrate. Two lower chambers of
the four-chamber microfluidic cell, placed on the glass sub-
strate, were filled with the cell suspension–gel mixture and
covered with a porous polycarbonate (PC) membrane. After-
wards, the upper part of the microfluidic cell was installed.
Two chambers of the upper part were connected to a pump
and served for the supply of nutrient (MM in the reference
channel) and measuring solution (diclofenac containing MM
in the measuring channel). The same diclofenac-sensitive
cells were immobilized in the lower chambers of the measur-
ing and reference channels. Therefore, both channels were
irradiated with light of the same wavelength (470 nm). The
optical measurements were performed by periodic switching
between the LED light sources of the measuring and refer-
ence channels. The difference between the values of the pho-
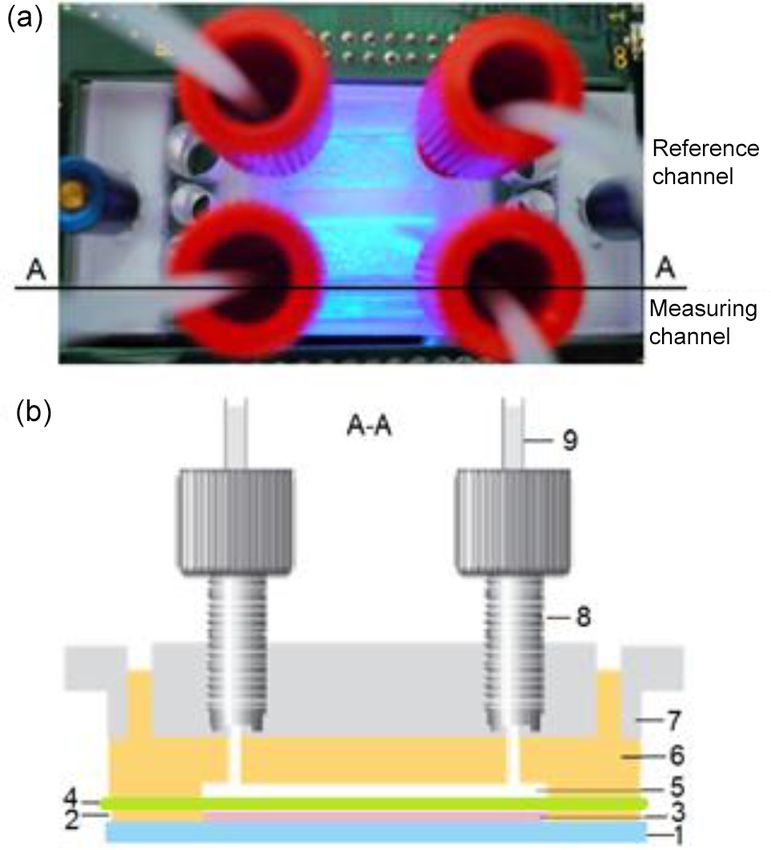
todiode current of these channels was taken as an optical sig- Figure 2. Change in the photodiode current IPD in dependence
nal. on the concentration of diclofenac (DCF) for living S. cerevisiae
BY4741 p426PDR5-tGFP cells, immobilized in 0.75 % agarose gel
Figure 2 shows the change in the photodiode current IPD as
in the lower microfluidic chambers (7 × 10⁶ cells mL−1 ). The up-
a function of the diclofenac concentration after a 16 h over-
per microfluidic chamber of the measuring channel was overflowed
flow with DCF containing MM. For each DCF concentration, with MM, containing DCF, at a rate of 20 µL min−1 . MM without
newly cultured cells were used. The optical signal was deter- DCF was pumped through the reference channel.
mined using the optical module, which was located below the
microfluidic cell containing the immobilized yeast cells. The
drift of the photodiode current reached its minimal value of
5 nA s−1 at the excitation time of 0.5 min. Therefore, the IPD values of 13.5, 12.1, and 10.7 h, respectively, were obtained
values at the excitation time te = 0.5 min were used to deter- for the time t50 of a half-maximal effect. Besides the detec-
mine the characteristic concentration–response curve of the tion after a defined time (as in Fig. 2), a kinetic analysis is
sensor. The data clearly document that the fluorescence in- also feasible.
creases with increasing DCF concentration. Upon detecting Recent data by Schuller et al. (2017) based on fluorescence
a DCF molecule with specific receptors, the cells produce a microscopy showed that S. cerevisiae BY4741 p426PDR5-
fluorescent reporter protein. We observed that an impedance tGFP cells react to diclofenac with a time delay ti that de-
increase appeared in solution with diclofenac during long- creases with increasing DCF concentration. For DCF con-
term measurements (Fig. 3). This may be caused by increas- centrations of 1, 10, and 100 µM, fluorescence changes were
ing protein production. observed after 11, 6, and 3 h, respectively. The fluorescence
The concentration–response data set was fitted using the response reached its saturation at a DCF concentration of
logistic fit function of Eq. (1) with four parameters. The data 75 µM DCF (Schirmer et al., 2018). The smaller saturation
set and the logistic fit function were plotted in a semilog- value for 100 µM DCF is possibly due to the inhibitory ef-
arithmic graph, as shown in Fig. 2. The limit of detec- fect of the high DCF concentrations on the cell growth (Van
tion xLoD was calculated using Eq. (2). The limit of detec- Leeuwen, 2011a). As an expression of the fluorescent pro-
tion (LoD) and EC50 of the calibration curve were 0.56 µM teins depends on vital cells, measuring impedance should
(0.18 mg L−1 ) and 32 µM (10.18 mg L−1 ), respectively. The help to expand the knowledge gained from fluorescence mea-
working range was defined between 6.2 µM (1.97 mg L−1 ) surements. For example, a change in impedance might hint at
and 68.5 µM (21.79 mg L−1 ). The obtained results are pre- different viability of the cells in the chambers.
sented in Table 1 in comparison with literature values. As recently shown by means of fluorescence microscopy
The time-dependent increase in the optical signal in the and flow cytometry, the fluorescence intensity of samples
presence of diclofenac shows an initial phase in which the with S. cerevisiae BY4741 p426PDR5-tGFP cells correlates
specific signal increase rate starts at a value of zero at the with the fraction of fluorescent cells within the cell popula-
time ti = 3 h and then accelerates to a maximal value µmax in tion in dependence on the DFC concentration and the time
a certain period of time, resulting in a lag time λ (Fig. 3). In after drug application (Schirmer et al., 2018). Therefore, in
addition, the curve contains a final phase in which the rate de- order to compare the results of different experiments, it is
creases and finally reaches zero, so that an asymptote A (see necessary to determine the fraction of fluorescent cells in the
Eq. 3) is reached. The experimental curve was fitted using sample. Additionally, one has to ensure that the copy number
Eqs. (3) and (4), and the values λ = 7.3 h, µmax = 0.02 h−1 , of the PDR5-tGFP construct per cell is identical. A suitable
and t50 = 9.9 h were obtained for the DCF concentration of measure to avoid copy number variation that is commonly
100 µM. For DCF concentrations of 25, 50, and 75 µM, the observed in the case of multicopy plasmids (Karim et al.,
www.j-sens-sens-syst.net/8/215/2019/ J. Sens. Sens. Syst., 8, 215–222, 2019220 M. Guenther et al.: Genetically modified cells for diclofenac sensing
Table 1. Limit of detection (LoD) and working range for detection of diclofenac in comparison with literature values.
Method LoD (g L−1 ) Working range (g L−1 ) Medium Reference
ELISAa 1 × 10⁻⁸ 0.2–2 × 10⁻⁷ Water Hlaváček et al. (2016)
ULISAb 5 × 10⁻⁸ 0.1–1 × 10⁻⁶ Water Hlaváček et al. (2016)
RIfSc 2.84 × 10⁻⁷ 0.40–2.23 × 10⁻⁶ PBS buffer Rau et al. (2014)
RIfSc 1.13 × 10⁻⁷ 0.44–6.22 × 10⁻⁶ Milk Rau et al. (2014)
Optical SPRd sensor 1.2 × 10⁻⁶ 1.24–80 × 10−6 HEPES buffer Altintas et al. (2015)
Optical whole-cell sensor 1.8 × 10⁻⁴ 1.97–21.79 × 10⁻³ Minimal medium This paper
Potentiometric electrode 2.9 × 10⁻³ 3.2 × 10⁻³ –3.18 Water Brennan et al. (2017)
a Enzyme-linked immunosorbent assay (ELISA). b Upconversion-linked immunosorbent assay (ULISA). c Reflectometric interference spectroscopy
(RIfS). d Surface plasmon resonance (SPR).
4 Conclusions
In this report we introduce a device of a biosensor in which
immobilized yeast sensor cells are completely enclosed in a
microfluidic cell with no direct contact with the environment.
The packaging provided the reliable and long-term stable de-
tection of the sensor cell-caused optical signal as well as the
simultaneous read-out of the impedimetric signal for moni-
toring the cell viability. Solutions with different diclofenac
concentrations were used to demonstrate the sensitivity of
S. cerevisiae BY4741 p426PDR5-tGFP cells in the detection
of the model analyte diclofenac. Ongoing experiments ad-
dress the development of sensor cells with a higher sensitiv-
ity and a better signal stability, e.g. by genomic integration
of the PDR5-tGFP construct, to allow the comparison of dif-
Figure 3. Time-dependent change in the photodiode current IPD
ferent experiments. On the hardware level, future activities
and the impedance modulus |Z| at 100 kHz for living S. cerevisiae
BY4741 p426PDR5-tGFP cells, immobilized in 0.75 % agarose gel
will focus on the development of a small detection unit for
in the lower microfluidic chambers (7 × 10⁶ cells mL−1 ). The up- the read-out of the fluorescence. Such sensor systems, based
per microfluidic chambers were overflowed with MM, containing on the whole-cell concept, could contribute to an improved,
0 µM DCF (in the reference channel) and 100 µM DCF (in the mea- inline-capable wastewater analysis.
suring channel), respectively, at a rate of 20 µL min−1 .
Data availability. The underlying measurement data are not pub-
licly available and can be requested from the authors if required.
Supplement. The supplement related to this article is available
online at: https://doi.org/10.5194/jsss-8-215-2019-supplement.
2013) is the generation of yeast cells with the PDR5-tGFP
module stably integrated into the genome.
For practical application of the described biosensor con- Author contributions. Conceptualization was by GR, KO, and
cept, a further improvement of the sensor performance is GG; experiments and data analysis were performed by MG; prepa-
needed. Current approaches aim at the development of the ration of cells was done by FA; preparation of ITO-electrode arrays
was done by ITS; preparation of the multiplexer board was done by
cells towards higher sensitivity into the low nM-detection
SH; preparation of the optical read-out module was done by SG;
range of diclofenac by mutagenesis of the involved tran- writing and original draft preparation were by MG; writing review
scription factors and their DNA-binding sites (Schuller et al., and editing were done by MG, GR, KO, and GG; visualization was
2017). As other substances, e.g. the antibiotic sulfamethox- by MG.
azole or the endocrine disruptor 2,4-dichlorophenol, could
inhibit the cell growth (Borga and Borga, 1997) and thus af-
fect the sensor signal, the cross-sensitivity of the sensor cells
has to be carefully investigated in future studies.
J. Sens. Sens. Syst., 8, 215–222, 2019 www.j-sens-sens-syst.net/8/215/2019/M. Guenther et al.: Genetically modified cells for diclofenac sensing 221
Competing interests. The authors declare that they have no con- Ferrer-Aguirre, A., Romero-González, R., Vidal, J. L. M., and
flict of interest. Frenich, A. G.: Simple and quick determination of analgesics
and other contaminants of emerging concern in environmen-
tal waters by on-line solid phase extraction coupled to liq-
Special issue statement. This article is part of the special issue uid chromatography–tandem mass spectrometry, J. Chromatogr.
“Dresden Sensor Symposium 2017”. It is a result of the Dresden A., 1446, 27–33, https://doi.org/10.1016/j.chroma.2016.04.009,
Sensor Symposium 2017, Dresden, Germany, 4–6 December 2017. 2016.
Gast, F.-U., Dittrich, P. S., Schwille, P., Weigel, M., Mertig, M.,
Opitz, J., Queitsch, U., Diez, S., Lincoln, B., Wottawah, F.,
Acknowledgements. The authors are grateful to Chris- Schinkinger, S., Guck, J., Käs, J., Smolinski, J., Salchert, K.,
tine Schirmer, Juliane Posseckardt, and Wolfgang Fichtner from the Werner, C., Duschl, C., Jäger, M. S., Uhlig, K., Geggier, P.,
Kurt-Schwabe-Institut für Mess- und Sensortechnik e.V. Meinsberg and Howitz, S.: The microscopy cell (MicCell), a versatile
as well as Steffen Howitz from the GeSiM mbH for fruitful modular flowthrough system for cell biology, biomaterial re-
discussions and the help to prepare the microfluidic cell. The search, and nanotechnology, Microfluid. Nanofluid., 2, 21–36,
financial support by the German Federal Ministry of Education and https://doi.org/10.1007/s10404-005-0047-6, 2006.
Research is kindly acknowledged (BioSAM HIGS 03WKCL01F). German standard DIN 32645:2008-11: Deutsches Institut für Nor-
mung e.V. (DIN) Chemische Analytik – Nachweis-, Erfassungs-
und Bestimmungsgrenze unter Wiederholbedingungen – Be-
griffe, Verfahren, Auswertung (Chemical analysis – Decision
Financial support. This research has been supported by the Ger-
limit, detection limit and determination limit under repeatability
man Federal Ministry of Education and Research (grant BioSAM
conditions – Terms, methods, evaluation), 2008.
HIGS-03WKCL01F).
Günther, M., Gerlach, G., Schirmer, C., Posseckardt, J., Fichtner,
W., Mertig, M., Altenkirch, F., Ostermann, K., Schuller, A.,
Rödel, G., Winzer, A. T., Tobehn-Steinhäuser, I., Schröder, M.,
Review statement. This paper was edited by Fred Lisdat and re- Gläser, M., Scharff, W., and Zimmermann, P.: Combined optical-
viewed by two anonymous referees. impedimetric whole-cell biosensor, in: Proceedings of the 13th
Sensor Symposium of Dresden, Dresden, Germany, 4–6 Decem-
ber 2017, AMA Association for Sensors and Measurement, 120-
125, https://doi.org/10.5162/13dss2017/3.7, 2017.
References Hernando, M. D., Heath, E., Petrovic, M., and Barceló, D.:
Trace-level determination of pharmaceutical residues by LC-
Adeniran, A., Sherer, M., and Tyo, K. E. J.: Yeast-based biosensors: MS/MS in natural and treated waters. A pilot-survey study, Anal.
Design and applications, FEMS Yeast Res., 15, 1–15, 2015. Bioanal. Chem., 385, 985–991, https://doi.org/10.1007/s00216-
Altintas, Z., Guerreiro, A., Piletsky S. A., and Tothill, 006-0394-5, 2006.
I. E.: NanoMIP based optical sensor for pharmaceuti- Hlaváček, A., Farka, Z., Hübner, M., Horňáková, V., Němeček,
cals monitoring, Sensor Actuat. B-Chem., 213, 305–313, D., Niessner, R., Skládal, P., Knopp, D., and Gorris, H. H.:
https://doi.org/10.1016/j.snb.2015.02.043, 2015. Competitive upconversion-linked immunosorbent assay for the
Arroyo-López, F. N., Orli, S., Querol, A., and Barrio, E.: Ef- sensitive detection of diclofenac, Anal. Chem., 88, 6011–6017,
fects of temperature, pH and sugar concentration on the growth https://doi.org/10.1021/acs.analchem.6b01083, 2016.
parameters of Saccharomyces cerevisiae, S. kudriavzevii and Inczedy, J., Lenguel, T., and Ure, A. M.: Compendium of analytical
their interspecific hybrid, Int. J. Food Microbiol., 131, 120–127, nomenclature. Definitive rules, in: The Orange Book, 3rd edn.
https://doi.org/10.1016/j.ijfoodmicro.2009.01.035, 2009. Blackwell Science, Oxford, 1998.
Borga, O. and Borga, B.: Serum protein binding of nonsteroidal IUPAC: Compendium of Chemical Terminology, Gold Book, Ver-
anti-inflammatory drugs: a comparative study, J. Pharmacokinet. sion 2.3.3, p. 839, https://doi.org/10.1351/goldbook.L03540,
Biop., 25, 63–77, 1997. 2014.
Brennan, E., Futvoie, P., Cassidy, J., and Schazmann, B.: Karim, A. S., Curran, K. A., and Alper, H. S.: Characterization
An ionic liquid-based sensor for diclofenac determina- of plasmid burden and copy number in Saccharomyces cere-
tion in water, Int. J. Environ. An. Ch., 97, 588–596, visiae for optimization of metabolic engineering applications,
https://doi.org/10.1080/03067319.2017.1333607, 2017. FEMS Yeast Res., 13, 107-116, https://doi.org/10.1111/1567-
Deng, A., Himmelsbach, M., Zhu, Q.-Z., Frey, S., Sengl, M., Buch- 1364.12016, 2013.
berger, W., Niessner, R., and Knopp, D.: Residue analysis of Mamishev, A. V., Sundara-Rajan, K., Yang, F., Du, Y., and Zahn,
the pharmaceutical diclofenac in different water types using M.: Interdigital sensors and transducers, P. IEEE, 92, 808–845,
ELISA and GC–MS, Environ. Sci. Technol., 37, 3422–3429, https://doi.org/10.1109/JPROC.2004.826603, 2004
https://doi.org/10.1021/es0341945, 2003. Mujiono, T., Sukekawa, Y., Nakamoto, T., Mitsuno, H., Kan-
Evdokimov, A. G., Pokross, M. E., Egorov, N. S., Zaraisky, A. G., zaki, R., and Misawa, N.: A cell-based odor sensing system
Yampolsky, I. V., Merzlyak, E. M., Shkoporov, A. N., Sander, I., using fluorescent technique and lock-in measurement robust
Lukyanov, K. A., and Chudakov, D. M.: Structural basis for the against disturbance, in: Proc. IEEE Sensors 2015, 695-698,
fast maturation of Arthropoda green fluorescent protein, EMBO https://doi.org/10.1109/ICSENS.2015.7370351, 2015.
Rep., 7, 1006–1012, https://doi.org/10.1038/sj.embor.7400787,
2006.
www.j-sens-sens-syst.net/8/215/2019/ J. Sens. Sens. Syst., 8, 215–222, 2019222 M. Guenther et al.: Genetically modified cells for diclofenac sensing Mumberg, D., Muller, R., and Funk, M.: Yeast vectors for the con- Schuller, A., Rödel, G., and Ostermann, K.: Tuning the trolled expression of heterologous proteins in different genetic sensitivity of the PDR5 promoter-based detection of di- backgrounds, Gene, 156, 119–122, 1995. clofenac in yeast biosensors, Sensors, 17, 1506–1522, Nováková, L., Solichová, D., and Solich, P.: Advantages of ul- https://doi.org/10.3390/s17071506, 2017. tra performance liquid chromatography over high-performance Schwaiger, J., Ferling, H., Mallow, U., Wintermayr, H., and Negele, liquid chromatography: comparison of different analytical ap- R. D.: Toxic effects of the non-steroidal anti-inflammatory proaches during analysis of diclofenac gel, J. Sep. Sci., 29, 2433– drug diclofenac Part I: histopathological alterations and bioac- 2443, https://doi.org/10.1002/jssc.200600147, 2006. cumulation in rainbow trout, Aquat. Toxicol. 68, 141–150, Petrie, B., Barden, R., and Kasprzyk-Hordern, B.: A review https://doi.org/10.1016/j.aquatox.2004.03.014, 2004. on emerging contaminants in wastewaters and the environ- Steinke, N., Rio, M., Wuchrer, R., Schuster, C., Ljasenko, E., ment: current knowledge, understudied areas and recom- Knopp, D., Gerlach, G., and Härtling, T.: Detection of di- mendations for future monitoring, Water Res., 72, 3–27, clofenac molecules by planar and nanostructured plasmonic https://doi.org/10.1016/j.watres.2014.08.053, 2015. sensor substrates, Sensor Actuat. B-Chem., 254, 749–754, Posseckardt, J., Schirmer, C., Kick, A., Rebatschek, K., Lamza, T., https://doi.org/10.1016/j.snb.2017.07.123, 2018. and Mertig, M.: Monitoring of Saccharomyces cerevisiae viabil- Tobehn-Steinhäuser, I., Günther, M., Görlandt, S., Herbst, ity by non-Faradaic impedance spectroscopy using interdigitated S., Wünscher, H., Ortlepp, T., and Gerlach, G.: Mul- screen-printed platinum electrodes, Sensor Actuat. B, 255, 3417– tisensors for whole-cell analytics, IAPGOS, 8, 39–41, 3424, https://doi.org/10.1016/j.snb.2017.09.171, 2018. https://doi.org/10.5604/01.3001.0012.0702, 2018. Rau, S., Hilbig, U., and Gauglitz, G.: Label-free optical biosen- Tsien, R.: The green fluorescent protein, Annu. Rev. Biochem., 67, sor for detection and quantification of the non-steroidal anti- 509–544, 1998. inflammatory drug diclofenac in milk without any sam- Van Leeuwen, J. S., Orij, R., Luttik, M. A. H., Smits, G. J., Ver- ple pretreatment, Anal. Bioanal. Chem., 406, 3377–3386, meulen, N. P. E., and Vos, J. C.: Subunits Rip1p and Cox9p of https://doi.org/10.1007/s00216-014-7755-2, 2014. the respiratory chain contribute to diclofenac-induced mitochon- Richardson, S. D. and Ternes, T. A.: Water analysis: emerging drial dysfunction, Microbiology, 157, 685–694, 2011a. contaminants and current issues, Anal. Chem., 86, 2813–2848, Van Leeuwen, J. S., Vermeulen, N. P. E., and Vos, J. C.: Involve- https://doi.org/10.1021/ac500508t, 2014. ment of the pleiotropic drug resistance response, protein kinase Schirmer, C., Posseckardt, J., Kick, A., Rebatschek, K., Ficht- C signaling, and altered zinc homeostasis in resistance of Sac- ner, W., Ostermann, K., Schuller, A., Rödel, G., and Mer- charomyces cerevisiae to diclofenac, Appl. Environ. Microbiol., tig, M.: Encapsulating genetically modified Saccharomyces 77, 5973–5980, 2011b. cerevisiae cells in a flow-through device towards the detec- Zwietering, M. H., Jongenburger, I., Rombouts, F. M., and van’t tion of diclofenac in wastewater, J. Biotechnol., 284, 75–83, Riet, K.: Modeling of the bacterial growth curve, Appl. Environ. https://doi.org/10.1016/j.jbiotec.2018.08.003, 2018. Microbiol., 56, 1875–1881, 1990. Schröder, M., Gläser, M., Schirmer, C., Posseckardt, J., Ficht- ner, W., Mertig, M., Tobehn-Steinhäuser, I., Herbst, S., Schädel, M., Wünscher, H., Ortlepp, T., Winzer, A., Günther, M., Al- tenkirch, F., Wenzel, M., Schuller, A., Rödel, G., Ostermann, K., Soltmann, U., Haufe, H., Scharff, W., and Meyer, A.: Highly integrated whole-cell sensors for the environmental and medical technology, in: Proceedings of the 13th Sensor Sym- posium of Dresden, Dresden, Germany, 4–6 December 2017, AMA Association for Sensors and Measurement, 148–152, https://doi.org/10.5162/13dss2017/5.2, 2017. J. Sens. Sens. Syst., 8, 215–222, 2019 www.j-sens-sens-syst.net/8/215/2019/
You can also read