Prenatal exposure to ultrasound waves impacts neuronal migration in mice
←
→
Page content transcription
If your browser does not render page correctly, please read the page content below
SEE COMMENTARY
                                            Prenatal exposure to ultrasound waves impacts
                                            neuronal migration in mice
                                            Eugenius S. B. C. Ang, Jr.*†, Vicko Gluncic*†, Alvaro Duque*, Mark E. Schafer‡, and Pasko Rakic*§
                                            *Department of Neurobiology and Kavli Institute for Neuroscience, Yale Medical School, Sterling Hall of Medicine, Room C-318, 333 Cedar Street,
                                            New Haven, CT 06510; and ‡Sonic Tech, Inc., 23 Brookline Court, Ambler, PA 19002

                                            Communicated by Dale Purves, Duke University Medical Center, Durham, NC, June 29, 2006 (received for review August 5, 2005)

                                            Neurons of the cerebral neocortex in mammals, including humans,
                                            are generated during fetal life in the proliferative zones and then
                                            migrate to their final destinations by following an inside-to-
                                            outside sequence. The present study examined the effect of ultra-
                                            sound waves (USW) on neuronal position within the embryonic
                                            cerebral cortex in mice. We used a single BrdU injection to label
                                            neurons generated at embryonic day 16 and destined for the
                                            superficial cortical layers. Our analysis of over 335 animals reveals
                                            that, when exposed to USW for a total of 30 min or longer during
                                            the period of their migration, a small but statistically significant
                                            number of neurons fail to acquire their proper position and remain
                                            scattered within inappropriate cortical layers and兾or in the subja-
                                            cent white matter. The magnitude of dispersion of labeled neurons
                                            was variable but systematically increased with duration of expo-
                                            sure to USW. These results call for a further investigation in larger
                                            and slower-developing brains of non-human primates and contin-
                                            ued scrutiny of unnecessarily long prenatal ultrasound exposure.

                                            brain malformations 兩 cerebral cortex 兩 embryonic development

                                            A      fundamental feature of cerebral cortical organization is
                                                  that positions of its neuronal constituents into horizontal
                                            (laminar) and vertical (radial) arrays ultimately define their
                                            connectivity and function (1). Cortical neurons acquire appro-
                                            priate positions by migration from the site of their origin in the
                                            proliferative zones lining the cerebral ventricle, according to a
                                            precise schedule (2, 3) and along well defined pathways (4–6).                 Fig. 1. The experimental design of the system used for exposure of pregnant

                                                                                                                                                                                                               NEUROSCIENCE
                                            When the rate of neuronal migration and the sequence of arrival                mice to USW. The mouse is placed in the tube chamber with abdomen
                                            are altered because of genetic and兾or environmental factors,                   embedded in conductant jelly and separated from the transducer by a tissue
                                                                                                                           stand-off pad (TSP). Diagnostic levels of USW were delivered during 5– 45 min.
                                            various consequences, including abnormal behavior, have been
                                                                                                                           The embryos were monitored on the screen, and pulse, oxygenation, and
                                            observed (7–13). In terms of orientation and directionality of                 temperature in the mothers were recorded (35).
                                            movement, neuronal migration to the cerebral cortex can be
                                            classified into radial (proceeding radially from the ventricular to
                                            the pial surface) (5, 14) and tangential (running parallel to the              In addition, it was reported that diagnostic levels of ultrasound
                                            brain surface) (15–17). Contact interaction between migrating                  can disrupt membrane attachments or cells both in vitro (32, 33)
                                            neurons and the surfaces of neighboring cells plays a decisive                 and in vivo (34) and alter the cell cycle of the intestinal
                                            role in selecting the migratory pathway and determining their                  epithelium in vivo (35). Because ultrasound energy is a high-
                                            final position (18, 19). Neuronal migration involves translocation             frequency mechanical vibration (36), we hypothesized that it
                                            of the nucleus and the surrounding cytoplasm with the leading                  might influence membrane-mediated, cell-to-cell attachments
                                            process, which requires rearrangement of the cytoskeleton (20,                 and兾or nuclear translocation essential for neuronal migration.
                                            21). As a consequence of these complex cellular and molecular
                                                                                                                           Because the migratory neurons and the adjacent radial glial
                                            interactions, the process of neuronal migration is highly sensitive
                                                                                                                           guides in the embryonic brain are surrounded by extracellular
                                            to a variety of biological, physical, and chemical agents, as well
                                            as to specific genetic mutations (7–13). For example, repeated                 spaces filled with low-viscosity fluids (5), the USW might affect
                                            exposure of the rodent and primate fetal brain to environmental                cell motility through radiation force or microstreaming (36). In
                                            agents, such as alcohol (9), drugs (22), neurotrophic viruses (23),            this study, we examined the possible effect of USW on neuronal
                                            and ionizing irradiation (24, 25), causes misplacement of neurons              migration in mice at a late stage of corticogenesis, when the
                                            and behavioral deficits.
                                               To our knowledge, the effect of ultrasound waves (USW) on
                                                                                                                           Conflict of interest statement: No conflicts declared.
                                            the rate of migration in the cerebral cortex has never been tested,
                                                                                                                           Freely available online through the PNAS open access option.
                                            although it has been reported that the exposure of pregnant mice
                                                                                                                           Abbreviations: USW, ultrasound wave(s); En, embryonic day n; Pn, postnatal day n.
                                            and non-human primates to USW may affect the behavior of
                                            their exposed offspring (26, 27). There also is some evidence that             See Commentary on page 12661.
Downloaded by guest on September 18, 2021

                                                                                                                           †E.S.B.C.A.
                                            the frequent exposure of the human fetus to USW is associated                                and V.G. contributed equally to this work.
                                            with a decrease in newborn body weight (28, 29), an increase in                §To   whom correspondence should be addressed. E-mail: pasko.rakic@yale.edu.
                                            the frequency of left-handedness (30), and delayed speech (31).                © 2006 by The National Academy of Sciences of the USA

                                            www.pnas.org兾cgi兾doi兾10.1073兾pnas.0605294103                                                     PNAS 兩 August 22, 2006 兩 vol. 103 兩 no. 34 兩 12903–12910
Table 1. Overview of experimental conditions and results
Schedule Control兾USW-exposed Effect
Dispersion
Duration, N⫻ Hr No. of No. of No. of Mean SD of difference,
Litter code min Period min betw. pups columns counted cells dispersion dispersion % t P
C1兾U1 420 8 12 ⫻ 35 4 7兾7 42兾42 3,669兾3,722 0.133兾0.190 0.019兾0.019 5.68 t(12) ⫽ 5.602 0.000
Total 7兾7 42兾42 3,669兾3,722
C2兾U2 210 8 7 ⫻ 30 6 7兾8 42兾48 2,676兾3,664 0.049兾0.093 0.022兾0.047 4.39 t(26) ⫽ 3.177 0.004
C3兾U3 210 8 7 ⫻ 30 6 7兾6 42兾36 2,747兾2,559
Total 14兾14 84兾84 5,429兾6,223
C4兾U4 60 12 2 ⫻ 30 12 6兾6 36兾36 3,918兾4,084 0.050兾0.113 0.023兾0.067 6.38 t(59) ⫽ 5.072 0.000
C5兾U5 60 12 2 ⫻ 30 12 14兾11 84兾66 6,021兾5,174
C6兾U6 60 12 2 ⫻ 30 12 12兾12 72兾72 11,620兾15,203
Total 32兾29 192兾174 21,559兾24,461
C7兾U7 30 12 2 ⫻ 15 12 11兾14 66兾84 9,284兾12,547 0.059兾0.089 0.031兾0.047 3.05 t(68) ⫽ 3.183 0.002
C8兾U8 30 12 2 ⫻ 15 12 14兾10 84兾60 11,531兾7,562
C9兾U9 30 12 2 ⫻ 15 12 10兾11 60兾66 8,962兾10,312
Total 35兾35 210兾210 29,777兾30,421
C10兾U10 15 12 1 ⫻ 15 N/A 12兾12 72兾72 8,239兾8,113 0.047兾0.052 0.021兾0.021 0.47 t(70) ⫽ 0.984 0.346
C11兾U11 15 12 1 ⫻ 15 N/A 11兾14 66兾84 9,696兾11,702
C12兾U12 15 12 1 ⫻ 15 N/A 10兾13 60兾78 9,597兾12,927
Total 33兾39 198兾234 27,532兾32,742
C13兾U13 5 12 1⫻5 N/A 10兾13 60兾78 8,273兾9,084
C14兾U14 5 12 1⫻5 N/A 10兾9 60兾54 8,523兾7,271 0.028兾0.031 0.014兾0.016 0.34 t(40) ⫽ 0.742 0.463
Total 20兾22 120兾132 16,796兾16,355
NC1 0 N/A N/A N/A 7 42 3,013 0.061 0.022 N兾A N兾A N兾A
NC2 0 N/A N/A N/A 8 47 4,724
NC3 0 N/A N/A N/A 15 89 9,645
Total 30 178 17,382
14兾14
(grand total) 141兾146 846兾876 104,752兾113,924 0.052兾0.080 0.031兾0.056 2.82% t(285) ⫽ 5.219 0.000
Shown under the exposure schedule during the E16 –E18 period (‘‘Schedule’’) is the period between BrdU injection and first exposure (‘‘Period’’), total
exposure schedule shown as the number of exposures times the number of minutes per exposure (‘‘N ⫻ min’’), and the number of hours between exposures (‘‘Hr
betw.’’). Across all durations, the mean number of stained cells was somewhat larger in the ultrasound condition (mean ⫽ 780.30, SD ⫽ 245.38, N ⫽ 146) than
in the control condition (mean ⫽ 742.92, SD ⫽ 220.65, N ⫽ 141). However, that difference was not statistically significant [t(285) ⫽ 1.355, P ⫽ 0.176]. The power
to detect a medium effect (d ⫽ 0.5) with this sample size is 0.99; the power to detect a small effect (d ⫽ 0.2) is 0.39. Dispersion is defined as the percentage of
cells in bins 6 –10. Dispersion difference is defined as the mean dispersion for controls minus the mean dispersion for USW-exposed animals. The means and
standard errors of dispersion by duration and condition also are shown in Fig. 5A. Values for t test are from a two-tailed test with independent samples. The
grand total does not include values for 0 duration (normal control) or the additional experiment using the different ultrasound system. Note that three sections
were taken from each pup, and two columns were taken from each section. NA, not applicable; NC, normal control.
migratory pathways are the longest and, thus, may be most not labeled with NeuN or glial cells. In selected specimens, the
vulnerable. BrdU cells were double-immunolabeled with markers for super-
ficial-layer (Brn1) or deep-layer (FoxP2) neurons. To assess the
Results pattern of migration and positioning of E16-born cortical neu-
Qualitative Analysis. Pregnant mice were injected on embryonic rons, the number of BrdU-labeled cells within a grid made up of
day (E)16 with the DNA-replication marker BrdU to label 10 equally sized bins (Fig. 2 E and H) was imaged and counted
dividing cells in the proliferative zone destined for superficial by investigators blind to the experimental conditions, followed by
cortical layers 2 and 3 (37). Then, within the next 3 days, while statistical analysis.
these cells were migrating across the cerebral wall, the animals Examination of the routine histological preparations did not
were exposed to multiple sessions of USW in a specially designed reveal a difference in brain size and cytoarchitectonic organi-
experimental system (Fig. 1). The total exposure to USW ranged zation between the control and USW-exposed animals (Fig. 2
from 5 to 420 min, delivered in multiple individual sessions A–C and F). In the counterstained sections from the controls, the
(Table 1). The controls were subjected to identical procedures, majority of BrdU⫹ cells accumulated, as expected, in bins 2兾3,
except for exposure to USW. The pregnancies were brought to which roughly correspond to superficial cortical layers 2兾3,
term (E19), and the pups were nursed by their mothers and then whereas a small number of BrdU⫹ cells were scattered in the
euthanized on postnatal day (P)10. The brains were fixed, lower bins (Fig. 2 D and E). In contrast, in many mice exposed
sectioned in the coronal plane, and stained with propidium to USW, BrdU⫹ cells were more dispersed, as illustrated in the
iodide to show cortical lamination, followed by immunocyto- cortex of a P10 mouse exposed in utero to USW for a total of 60
chemical staining of the BrdU to expose the final positions of min (Fig. 2 G and H). More specifically, layers 2兾3 contained
cells generated at E16 (Fig. 2 C–H). Double-labeling with usually a smaller number of BrdU⫹ cells, whereas the deeper
neuron-specific marker NeuN (BrdU兾NeuN) showed that the layers and the underlying white matter contained more of such
majority of cells (USW, 89.5 ⫾ 0.6%; control, 88.4 ⫾ 3.8%) cells (Fig. 2 G and H). In some cases, ectopic BrdU⫹ cells formed
Downloaded by guest on September 18, 2021
generated at E16 in controls and USW-exposed animals are a distinct band near the lateral cerebral ventricle (Fig. 2H, white
neurons, irrespective of their position (Fig. 3 A–C). The remain- arrowheads) that resemble periventricular ectopias. When these
ing 10–12% of BrdU-labeled cells are either neurons that were ectopic BrdU⫹ cells occurred, it was easy to distinguish the
12904 兩 www.pnas.org兾cgi兾doi兾10.1073兾pnas.0605294103 Ang et al.
SEE COMMENTARY
Fig. 2. Histological and immunohistochemical staining of sham and USW
cortical slices. (A and B) Coronal sections across the cerebral wall in P10 control
mouse (A) and mouse exposed to USW for 60 min between E17 and E18 (B).
Quantification of BrdU-labeled cells was then performed (white boxes). (C–E)
Control section from P10 controls animals. (F–H) Sections from P10 animals
exposed as embryos to 60 min of USW. Neurons labeled with BrdU are stained
green, and the slice was counterstained with propidium iodide, which is
stained red. (E and H) The sections were divided into 10 equally spaced bins,
with bin 1 starting at the pia and bin 10 ending near the ependymal surface.
Notice the lower number of BrdU-labeled cells in the upper layers compared
with the larger number in the deeper layers and subjacent white matter (white
arrowheads). (Scale bars: B, 1.8 mm; G, 130 m.)
exposed brains from the control brains, even upon visual in-
spection of the immunostained sections (Fig. 2, compare E with
H). However, detailed quantitative analysis was needed to
discern the change in pattern of cell dispersion in most cases and
to expose the systematic difference between the two groups of Fig. 3. Double-labeling of cortical slices exposed to USW for a cumulative
animals. dose of 30 min. (A–C) Staining for NeuN and BrdU and the merge of the two,
NEUROSCIENCE
respectively. The majority of BrdU⫹ cells are NeuN⫹, including those in layer 6
Quantitative Analysis. The pattern of distribution for BrdU- and subjacent white matter (white arrowheads in C). (D–F) No double-labeling
labeled cells was highly variable; therefore, to quantify the for FoxP2, a marker for lower cortical layers, is present. Shown are BrdU⫹ cells
degree of their deviation from the norm according to exposure in layer 6 and subjacent white matter. (G–I) Some BrdU⫹ cells in the subjacent
time, BrdU-counterstained cells were plotted for controls and white matter also label with Brn1, a marker of upper cortical layers (white
arrowheads in I). (F and I) White arrows show the level of the ependyma in
the mice were exposed to USW for various durations (Fig. 4 and
these images. (Scale bars: C, 72 m; F and I, 65 m.)
Table 1). Examination of the brains of mice exposed multiple
times for a total of 420 min (12 exposures, 35 min each exposure),
210 min (7 exposures, 30 min each exposure), 60 min (2 destined to superficial layers that were arrested along their
exposures, 30 min each exposure), and 30 min (2 exposures, 15 migratory pathway and not located in their proper position.
min each exposure) of USW, respectively, showed a consistent Detailed examination of the effect of USW exposure at each
overall pattern of a smaller number of BrdU⫹ cells situated in the duration and across all durations showed that the best individual-
upper cortical layers and a greater number in the lower layers level measure of cell dispersion was the proportion of BrdU⫹
and throughout the subcortical white matter, compared with cells found in the lower half of each brain section within bins
control brains (Fig. 4 A–D). This difference in cell pattern was
6–10 (Fig. 5 A and B). Multiple linear regression analyses of over
statistically significant (t test; see Table 1). In animals exposed
218,000 BrdU⫹ cells obtained from 1,722 scans of 287 brains (146
to USW for 15 and 5 min, the effect was not statistically
significant (Fig. 4 E and F). However, when the data were pooled exposed and 141 control) indicate that USW have an effect on
together, across all durations, mice exposed prenatally to USW final neuronal positioning in the mouse cerebral cortex (P ⬍
as a group contained a smaller percentage of BrdU⫹ cells in the 0.0001) (Fig. 5 A and B). For example, under the experimental
upper cortical layers (e.g., bin 2) and a larger percentage in the conditions used, doubling exposure time from 15 min to 30 min
deeper layers as well as in the subcortical white matter (bins increased the number of cells in the lower layers from 5% to 9%.
4–10), compared with the controls (Fig. 4G). In addition, the Increasing exposure to 60 min increased dispersion to 11%,
majority of ectopic BrdU⫹ cells located in layer VI and the which was a statistically significant level (P ⬎ 0.0001). At 210
subjacent white matter were double-labeled with NeuN (Fig. 3 min, the mean increase of 9% did not fit the expected response
A–C) and did not stain with lower cortical layer markers such as curve but was in the expected direction. However, at a total of
Downloaded by guest on September 18, 2021
FoxP2 (Fig. 3 D–F). Furthermore, some of these ectopic BrdU⫹ 420 min exposure, we observed the largest dispersion of 19%.
cells still retained upper-cortical-layer markers, such as Brn1 Although the results at shorter durations are relatively small, we
(Fig. 3 G–I), which suggests that these cells were neurons do not know whether a 4% increase in dispersion of cells, as seen
Ang et al. PNAS 兩 August 22, 2006 兩 vol. 103 兩 no. 34 兩 12905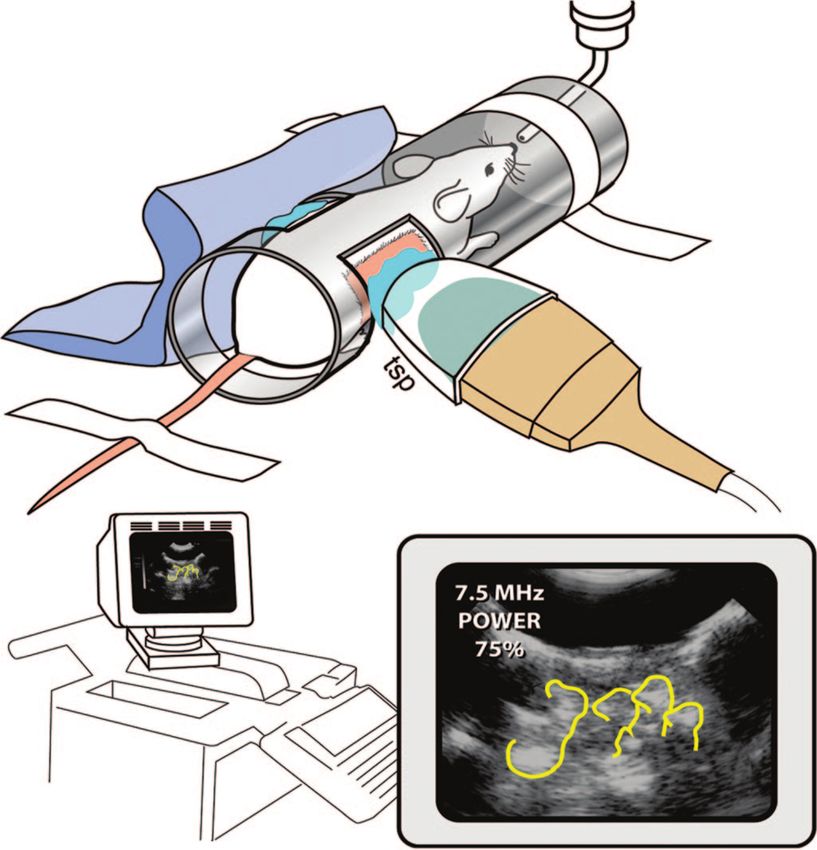
Fig. 5. Dispersion of BrdU⫹ cells for USW and controls by duration of
                                                                                                                                  exposure. Dispersion is defined as the percentage of cells in bins 6 –10. (A) The
                                                                                                                                  mean dispersion by condition and duration, with error bars showing the
                                                                                                                                  standard errors. (B) The mean dispersion for control and experimental animals
                                                                                                                                  across all durations with the Y-bars showing the standard errors. (C) A scatter
                                                                                                                                  plot by condition and duration for USW (red) and sham control (blue) condi-
                                                                                                                                  tions. Dispersion increases systematically with the length of exposure to USW.
                                                                                                                                  Dispersion also increases with sham exposure, although not as quickly as with
                                                                                                                                  ultrasound. (D) A scatter plot by condition with 0 min of duration for normal
                                                                                                                                  controls. The mean dispersion for the normal control condition was not
                                                                                                                                  significantly different from the 5-, 15-, 30-, 60-, and 210-min exposures. NC,
                                                                                                                                  normal control.

                                                                                                                                  mental groups indicates that longer ultrasound exposure causes
                                                                                                                                  a larger effect (Fig. 5C), with a trend toward a smaller percent-
                                                                                                                                  age of cells being in the upper cortical layers and a larger
                                            Fig. 4. Percentage of cells in each bin averaged across all animals in each
                                            exposure duration, shown by condition. (A Left–F Left) Line graphs showing the
                                                                                                                                  percentage in the lower layers and the white matter. Interest-
                                            percent of cells in each bin for experimental and control animals for exposure        ingly, there also is an increase in dispersion in the 420-min sham
                                            durations of 420, 210, 60, 30, 15, and 5 min, respectively. For durations ⬎15 min,    condition over normal controls (Fig. 5 C and D). This increase
                                            the proportion of cells in the lower five bins was significantly higher for exposed   in cell dispersion may be due to the indirect effect of stress
                                            than for control animals. (A Right–F Right) Line graphs showing the ratio of the      experienced by pregnant animals during prolonged exposure to
                                            percentage of cells in ultrasound-exposed versus control animals (U兾C) for each       the experimental procedure. Although the sample size at 420
                                            bin. For durations ⬎15 min, the small differences in the absolute magnitudes in
                                                                                                                                  min is small (two litters, seven sham pups and seven USW-
                                            the lower bins represent large proportional increases. (G) (Left) The average
                                            percentage of cells in each bin for all 146 experimental animals and 141 sham
                                                                                                                                  exposed pups) (Table 1), the possibility of the role of stress in
                                            controls across all durations. Note the excess of cells in the lower bins for the     causing cell dispersion at long exposures during cortical devel-
                                            exposed animal. (Right) Line graph showing the ratio of the percentage of cells       opment is worthy of a more detailed examination.
                                            in ultrasound versus control animals for each bin. The small difference in the           To further test the possibility that stress alone increases
                                            absolute magnitudes in the lower bins represents large proportional increases.        dispersion, we compared statistically all sham control conditions
                                                                                                                                  versus the normal control condition (Fig. 5 C and D). The
                                                                                                                                  normal control condition had a mean dispersion of 6.1% with an
                                            from the difference between 5- and 15-min exposures, is suffi-                        SD of 2.2% and an SE of 0.6% (n ⫽ 30) (Fig. 5D and Table 1).
Downloaded by guest on September 18, 2021

                                            cient to compromise the normal cerebral cortical functions                            A post hoc comparison of all of the means using the Student–
                                            (Fig. 5A).                                                                            Newman–Keuls test indicated that the normal controls were not
                                               The cumulative dose–response curve using all seven experi-                         statistically different from the sham controls with 5, 15, 30, 60,

                                            12906 兩 www.pnas.org兾cgi兾doi兾10.1073兾pnas.0605294103                                                                                                         Ang et al.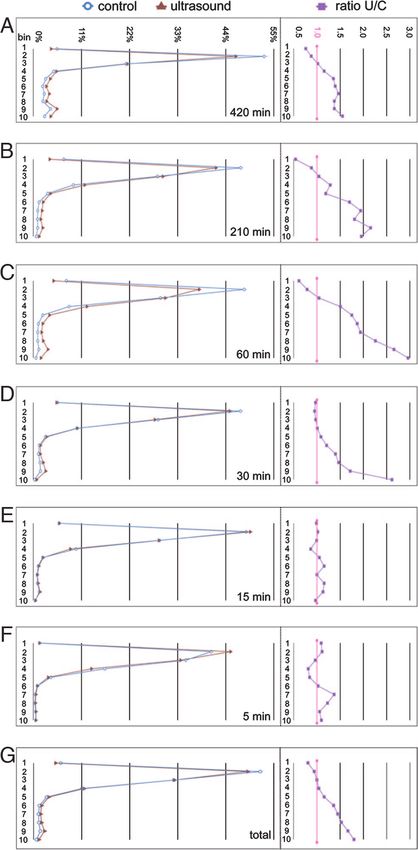
SEE COMMENTARY
displayed a seemingly abnormal distribution of BrdU⫹ cells. The
variability encountered within the exposed group of animals
indicates that there may be large individual differences in
susceptibility. However, the linear arrangement of the embryos
in the U-shaped mouse uterus precludes their equal exposure to
USW and may contribute to the variability of the effects
observed. Thus, USW has a predicable effect only when the large
population of exposed animals is compared with unexposed
controls by using multiple regression analysis and only at total
exposure durations of 30 min or longer.
The cellular and molecular mechanisms of the effect of USW
on migrating neurons observed in this study are unknown. At the
frequencies and intensities we have used (see Material and
Methods; see also Supporting Text, Tables 2–5, and Figs. 8–14
which are published as supporting information on the PNAS web
site), it is unlilely that cavitation or temperature changes play a
role in the effects noted (36). The dosimetry data and output
parameters suggest that the mechanism may be a nonthermal,
noncavitational, mechanically mediated effect, perhaps involv-
ing radiation force or microstreaming, or shear effects on cellular
walls (38, 39). These mechanical effects could interfere with the
delicate adhesion between the migratory neurons and the sur-
face of migratory substrates, such as radial glial shafts, which
serve as guides (5, 6, 14). The USW may also disturb exocytosis,
essential for the extension of the leading tip of migrating neurons
or disrupt cytoskeletal rearrangement essential for the translo-
Fig. 6. Schematic representation of the progression of neuronal migration
cation of the nucleus within its leading process (18, 20, 21, 37).
to the superficial cortical layers in the normal mouse. (A–D) Most cells labeled
with BrdU at E16 arrive in the cortex by E18, and, by P1, those cells become
Based on the present results, the effect on other forms of cell
surpassed by subsequently generated neurons. Eventually, these cells will motility, such as tangential neuronal migration (13, 15, 17) or
settle predominantly in layers 2 and 3 of the cerebrum. (E–H) Model of the spinning of the mitotic spindle (40), cannot be excluded. Finally,
USW effect. When cells generated at E16 are exposed to USW, they slow down although we cannot fully estimate the contribution of the indi-
on E17, and some remain in the white matter or are stacked in the deeper rect, humorally mediated effect of stress caused by the exposure
cortical layers. of pregnant mothers to the experimental procedure, it appears
to play a role only in extended exposures (420 min) based on
comparisons between normal control durations and all sham
and 210 min of exposure but were different statistically from the control durations.
420-min exposure. This finding indicates that the stress due to One plausible model of the observed effect of USW on cellular
the experimental procedure at durations of 210 min or below did events in the fetal cerebral wall is illustrated in Fig. 6. Normally,
not play a significant role in causing the cell dispersion seen in cells generated in the proliferative ventricular zone at E16
NEUROSCIENCE
the sham conditions. At durations of 420 min, it is possible that migrate radially during the next two days (E17 and E18) and
the stress of this long exposure leads to increased cell dispersion settle to the prospective layer 2兾3 to be bypassed by the
above the normal control condition. However, it is difficult to subsequently generated, unlabeled neurons that settle mostly
completely assess durations of 420 min and above because some above them in the upper tiers of layer 2 (Fig. 6). We hypothesize
pups from USW-exposed mothers were either resorbed or that, if cells generated at E16 that were en route to the cortex
cannibalized at birth (Table 1). In fact, no pups survived to P10 were slowed by exposure to USW, some of them would not arrive
in pregnant mice exposed to 600 min of USW, although the sham on time at the most superficial position between the developing
control mouse gave birth to a full liter that survived until P10 cortical plate and the marginal zone (Fig. 6G). As a result, these
(data not shown). cells become intermixed with the earlier-generated neurons
To confirm our results, we performed one more independent within the lower cortical layers or remain in the subjacent white
experiment with a more advanced and current ultrasound system matter (Fig. 6H). The ectopic cells would then develop abnormal
(see Material and Methods) and a different operator. Four of nine synaptic connectivity resulting in behavioral deficits, as has been
pups from a litter exposed to USW for 60 min exhibited ectopic observed in the mutant mice with malposition of neurons (7).
BrdU⫹ cells forming near the lateral cerebral ventricle (Fig. 7F, These ectopic cells can also cause abnormal electrical discharge
which is published as supporting information on the PNAS web associated with epilepsy (10).
site), similar to that seen with the original ultrasound system Perhaps the most obvious question raised by these results is
(Fig. 2H). No pups were affected like this in any of the nine pups their possible relevance for cortical development in humans. The
of the sham control litter (Fig. 7C). These types of periventricu- principal ultrasound beam characteristics (beam width, time-
lar ectopias also were not seen in normal control animals. averaged intensity, and mechanical and thermal indices) used in
this study were well within clinical norms for fetal exams.
Discussion Although the frequency used in the present study was slightly
This study shows that exposure of the embryonic mouse to USW above standard obstetrical clinical practice (6.7 MHz versus
can affect neuronal migration in the cerebral cortex and thereby 3.5–5.0 MHz), the latest ultrasound equipment with three-
prevent some neurons from attaining their final proper position. dimensional reconstruction and tissue harmonic imaging often
Because this effect is relatively small, it is not possible to predict employs even higher frequencies. The pulse average intensity
the magnitude of dispersion in any single case. In fact, the was slightly above Food and Drug Administration guidelines, but
Downloaded by guest on September 18, 2021
control brains also contained a variable number of neurons the exposimetry measurements were set up as worst-case (full
scattered within the white matter, and we have even encountered water path) scenarios, and the levels measured at the location of
exceptions in which individual brains from the control groups the fetuses are not considered excessive. In addition, in our
Ang et al. PNAS 兩 August 22, 2006 兩 vol. 103 兩 no. 34 兩 12907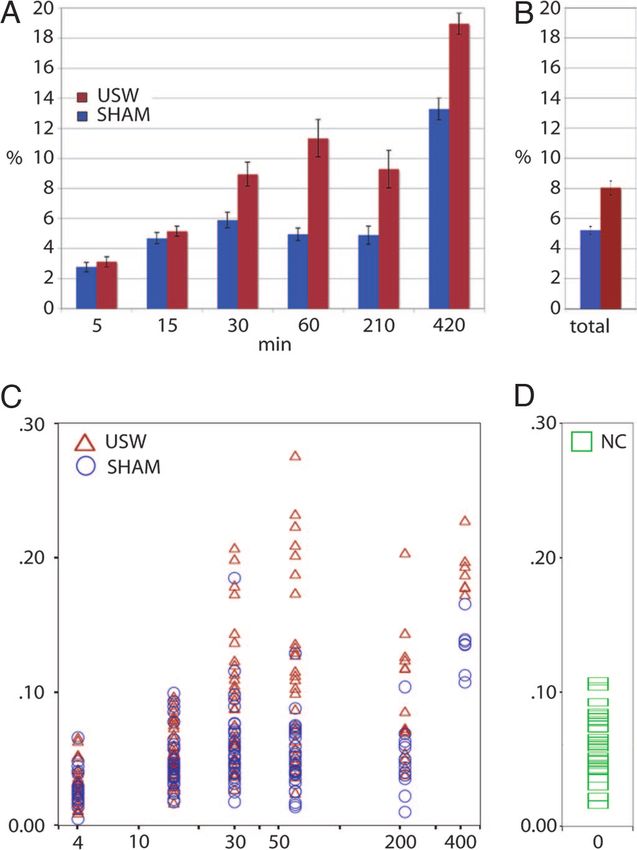
exposures, the ultrasound parameters and total exposure time          Materials and Methods
                                            are comparable with or below those used by commercial med-            Exposure Procedure. An unanesthetized pregnant mouse was held
                                            ically nonindicated prenatal ultrasound videos.                       in position within an exposure chamber made from a cardboard
                                               There are, however, huge differences in the number of neu-         tube; the lateral surfaces of the tube had been cut to allow
                                            rons and the size of the cerebral cortex between mouse and            exposure of the mouse’s abdominal wall to the ultrasound
                                            human (41). Thus, in spite of the use of tissue stand-off pad, the    transducer (Fig. 1). The posterior half of the mouse body was
                                            distance between the exposed cells and transducer in our              embedded in acoustic gel. A water bag was acoustically coupled
                                            experiments is shorter than in human. Furthermore, the duration       to the side of the mouse opposite the transducer to minimize the
                                            of neuronal production and the migratory phase of cortical            possibility of standing waves or reflections that might affect the
                                            neurons in the human fetus lasts ⬇18 times longer than in mice        exposure. The mouse’s abdomen was shaved to ensure proper
                                            (between 6 and 24 weeks of gestation, with the peak occurring         acoustical coupling between the ultrasound transducer and the
                                            between 11 and 15 weeks), compared with the duration of only          skin.
                                            ⬇1 week (between E11 and E18) in the mouse (2, 4, 16). Thus,             For ultrasound exposure, we used an Ultramark 4 Plus (ATL,
                                            an exposure of 30 min represents a much smaller proportion of         Bothell, WA) ultrasound system and an Access 10 transducer
                                            the time dedicated to development of the cerebral cortex in           (frequencies 5M, 7.5S, and 10S). We selected an ultrasound
                                            human than in mouse and, thus, could have a lesser overall effect,    system that has been routinely used in human medical clinics
                                            making human corticogenesis less vulnerable to USW.                   (36), and we used a 2-cm-thick tissue stand-off pad over the
                                               There are also some reasons to think that the USW may have         abdomen of unanesthetized pregnant mice. Unanesthetized
                                            a similar or even greater impact on neuronal migration in the         pregnant mice were exposed to B-mode, 6.7-MHz, pulsed USW
                                            human fetal brain. First, migrating neurons in the human              with a pulse duration of 0.2 ms and a scanning rate of 11 frames
                                            forebrain are only slightly larger than in the mouse, and, with the   per second for 5–35 min in different schedules, total duration,
                                            acoustic absorption provided by the tissue stand-off pad, the         and pregnancy time points (Table 1). A 2-cm-thick stand-off pad
                                            amount of energy absorbed within a comparable small volume of         was placed between the transducer face and the abdomen of the
                                            tissue during the USW exposure was in the same general range          mouse. The stand-off pad positioned the fetuses in the nearer
                                            (Supporting Text, Tables 2–5, and Figs. 8–14). Second, the            uterine horn at the probe’s focal point (2.1 cm, with a focal range
                                            migratory pathway in the convoluted human cerebrum is cur-            from 1.3 to 4.0 cm). Dosimetry testing of the ultrasound system
                                            vilinear and at least an order of magnitude longer (4). Thus, the     showed spatial peak pulse average intensities (Isppa) of 330
                                            number of neurons migrating along the same radial glial fascicle,     W兾cm2, and spatial peak time average intensity (Ispta) of 1.5
                                            particularly at the later stages of corticoneurogenesis, is much      mW兾cm2 when measured in water. The estimated Isppa at the
                                            larger and their routes are more complex (42), increasing the         fetal locations was on the order of 1 W兾cm2 (see Quantification
                                            chance of a cell going astray from its proper migratory course.       of Ultrasound Exposure and Supporting Text, Table 2, and Figs.
                                            Third, the inside-to-outside settling pattern of isochronously        9–14 for ultrasound output parameters for the system). For the
                                            generated neurons in primates is more precise than in rodents (3,     single confirmatory experiment done by using a different ultra-
                                            6) and thus, the tolerance for malpositioning may be smaller. In      sound system, a M2540A ultrasound system (model M2540-
                                            addition, different functional areas in the primate cortex are        67000; Phillips, Bothell, WA) was used with a 15-6L transducer.
                                            generated by different schedules (43) so that exposure to USW            In an independent group of anesthetized exposed and sham
                                            may potentially affect selective cortical areas and different         control animals, pulse and oxygenation were monitored during
                                            layers, depending on the time of exposure, potentially causing a      the procedures by using a Novametrix pulse oxymeter (model
                                            variety of symptoms.                                                  513; Medical Systems, Wallingford, CT). The thermistor data
                                               In conclusion, it is not known whether or to what extent USW       logger LogR (Barnant Company, Barrington, IL) was used to
                                            affects migrating neurons in developing humans. Identifying the       assess rectal兾core temperature in treated animals and sham
                                            position of isochronously generated neurons requires the tech-        controls. Our data showed that there was not a statistically
                                            nique of labeling DNA replication, a procedure that cannot be         significant change in either pulse rate or core temperature in
                                            used in humans; therefore, the misplaced solitary cells in the        animals exposed to ultrasound.
                                            cortex due to migratory disturbance could be missed upon
                                            neuropathological examination. The problem of detection is            Quantification of Ultrasound Exposure. The ultrasonic output pa-
                                            exacerbated by the small number of ectopic cells and the need         rameters of the ATL UltraMark 4 Plus system were measured
                                            for quantitative analysis to detect them. However, it is important    according to published international standards (46, 47) and the
                                            to emphasize that even a small number of ectopic cells might, as      current measurement guidelines of the U.S. Food and Drug
                                            a result of specific position and inappropriate connectivity, be a    Administration (48) and by using the appropriate calibrated
                                            source of epileptic discharge or abnormal behavior. Although we       measurement equipment (Acoustic Measurement System mea-
                                            have not as yet generated behavioral data, previous studies in        surement tank and software and Bilaminar Membrane Hydro-
                                            rodents and primates indicate that prenatal exposure to USW           phone model S5 with preamplifier; Sonora Medical Systems,
                                            may affect higher brain function of the offspring (26, 27).           Longmont, CO) (49). Measurements were conducted without
                                            Furthermore, there are numerous human neuropsychiatric dis-           the ultrasonic stand-off pad, which resulted in a worst-case
                                            orders that are thought to be the result of misplacement of cells     exposure condition. Table 2, which is published as supporting
                                            as a consequence of abnormal neuronal migration (e.g., 8, 10, 12,     information on the PNAS web site, summarizes the relevant
                                            22–24). Therefore, our results in pregnant mice support the           output parameters at 2.5 cm from the transducer face, which
                                            recommendations by the Food and Drug Administration that              would correspond to the depth of the fetuses when using a
                                            warn against the use of medically nonindicated or commercial          stand-off pad. The results are shown for the values directly
                                            prenatal ultrasound videos (44). Our results also call for careful    measured in a water tank (‘‘In water’’) and estimates of tissue
                                            testing of the nonthermal effects of USW at the potentially           exposure parameters (‘‘Attenuated’’) according to the method-
                                            vulnerable intense period of cortical neurogenesis in the human       ology of the Food and Drug Administration (44). For compar-
                                            fetus (45). Furthermore, it is essential to examine the possible      ison, also listed in Table 2 are the current regulatory limits for
Downloaded by guest on September 18, 2021

                                            effects of USW on cortical development in non-human primates,         medical diagnostic ultrasound equipment intended for fetal
                                            where the duration of embryogenesis and the size and complex-         applications (‘‘FDA limit’’).
                                            ity of migratory pathways are more similar to those in humans.           In addition to the standard output reporting methodology,

                                            12908 兩 www.pnas.org兾cgi兾doi兾10.1073兾pnas.0605294103                                                                            Ang et al.
SEE COMMENTARY
measurements were taken to determine the effect, if any, of for 20 min at room temperature, washed three times for 10 min with
reflections from the contralateral side of the mouse during PBS, and incubated in anti-BrdU at 1:100 (Becton Dickinson,
scanning. A euthanized 16-week pregnant mouse was shaved on Franklin Lakes, NJ) for 48 h at 4°C and species-specific fluoro-
both ventral sides and interposed between the ultrasound trans- phore-labeled secondary antibodies at room temperature. The
ducer and the measurement hydrophone in the same orientation slices were then counterstained with propidium iodide and
and distance as was done in the exposure experiment. The results mounted in Vectashield (Vector Laboratories, Burlingame, CA).
indicated that there was little possibility of a reflection adding Images from a single optical section were taken with a confocal
substantially to the exposure at the fetuses. The final experiment LSM 510 NLO system (Zeiss, Thornwood, NY) with a 25 ⫻ 0.8
was conducted to measure the actual ultrasound exposure at the numerical aperture Plan-NEOFLUAR lens. Images were collected
fetuses, by inserting a needle hydrophone (Pinducer transducer; from the medial somatosensory cortex of all animals (Fig. 2).
Valpey–Fisher, Hopkinton, MA) through an incision on the Images were merged into one montage spanning from the pia to the
contralateral side of another anesthetized 16-week pregnant ependymal surface, and BrdU⫹ cells were counted in PhotoShop
mouse. Multiple measurements were made and averaged; the 6.0 (Adobe Systems, San Jose, CA). Six montages from each brain
results can be found in Table 3, which is published as supporting were counted. A 10-tiered grid was overlaid on top of the montage,
information on the PNAS web site. and positively labeled cells were assigned to each tier depending on
their placement (Fig. 2). The bottom line of tier 1 started at the top
Exposure Schedule. At 8 a.m., pregnant mice carrying E16 fetuses of cortical layer II, and tier 10 ended in the white matter. Each tier
received an i.p. injection of BrdU (50 mg兾kg) and were then was equal in width and height. All imaging and counting were done
exposed to diagnostic ultrasound in multiple sessions for a total blind to experimental conditions.
of 5, 15, 30, 60, 210, and 420 min, cumulatively, during the For double-labeling studies, slices were incubated with anti-
E16–E18 period (Table 1). In the 5- and 15-min experiments, the BrdU at 1:100 (Accurate, Westbury, NY) and anti-NeuN at
animals received a single exposure of USW for 5 and 15 min, 1:200 (Chemicon, Billerica, MA), FoxP2 at 1:1,000 (Abcam,
respectively. This range was meant to approximate that of Cambridge, MA), or Brn1 at 1:1,300 (Santa Cruz Biotechnology,
exposures used in humans. The first ultrasound exposures com- Santa Cruz, CA) for 48 h at 4°C followed by species-specific,
menced 12 h after the BrdU injection. In the 30-min experi- fluorophore-labeled secondary antibodies at room temperature.
ments, two 15-min exposures were given at 12 and 24 h after the The slices were then counterstained with ToPro-3 (Molecular
BrdU injection. In the 60-min experiment, two 30-min exposures Probes, Eugene, OR) and mounted in Vectashield (Vector
were given at 12 and 24 h after the BrdU injection. In the 210-min Laboratories). A stack of five optical slices separated by 2 m
experiment, eight exposures lasting 30 min each were adminis- each was taken at images near the ependyma. Counts for the
tered. In this case, the first exposure began 8 h after the BrdU double-labeling of NeuN and BrdU were taken from three
injection. In the 420-min experiment, 12 exposures lasting 35 min montages spanning from pia to ependyma from one control
were given every 4 h. The first exposure also started 8 h after the brain and one USW brain exposed for 30 min.
BrdU injection. In multiple exposure experiments, we changed
the side of the exposure with every subsequent treatment. Statistical Analysis. The data were organized for analysis by
In addition to the ultrasound-exposed and sham control summing the cell counts for each of the 10 bins across all six slides
animals, three additional pregnant dams were injected at E16 for each animal (Table 1). The dependent measure, dispersion,
with BrdU and placed immediately in the animal care facility was calculated for each animal by computing the percentage of
without handling until each came to term (three litters with 30 cells found in the lower five bins (bins 6–10). A multiple linear
pups total). The P10 offspring were analyzed by using the same regression model was used to estimate the independent contri-
NEUROSCIENCE
methodology as the other two conditions, and these data served butions of ultrasound and of treatment duration to dispersion.
as the normal control condition. (Treatment duration may have an independent effect because
prolonged handling is stressful for a pregnant animal.) The
Immunohistochemistry and Analysis. The pregnant mice each re- model predicted dispersion from condition (ultrasound or sham
ceived a single i.p. injection of 5 mg兾ml BrdU dissolved in 0.9% control), duration of treatment, and their interaction. DIS-
NaCl with 0.007 M NaOH, at a dosage of 50 mg per kilogram of PERS ⫽ a ⫹ b1䡠COND ⫹ b2䡠DUR ⫹ b3䡠COND䡠DUR ⫹ error
body weight, ⬇12 h before beginning the exposures. All pups were (Table 1).
euthanized at P10 and perfused with 4% paraformaldehyde. Any
We are grateful to C.-Y. Kuan, S. Landis, D. Purves, B. Shaywitz, S.
experiment in which the control and ultrasound pups were born Shaywitz, and G. M. Shepherd for advice and comments on the paper.
more than 24 h apart was not included in the analysis. The brains Statistical analysis was performed by Leonid Rozenblit (Prometheus
were removed and drop-fixed for 48 h. Three coronal slices from Research, New Haven, CT). This work was supported by the National
each brain were used for quantification. Sections 100 m thick were Institute of Neurological Disorders and Stroke, National Institutes of
cut on a standard vibratome. The slices were treated with 2 M HCL Health.
1. Mountcastle, V. B. (1997) Brain 120, 701–722. 17. Ang, E. S. B. C., Jr., Haydar, T. F., Gluncic, V. & Rakic, P. (2003) J. Neurosci.
2. Angevine, J. B., Jr., & Sidman, R. L. (1961) Nature 192, 766–768. 23, 5805–5815.
3. Rakic, P. (l974) Science l83, 425–427. 18. Rakic, P., Cameron, R. S. & Komuro, H. (1994) Curr. Opin. Neurobiol. 4,
4. Sidman, R. L. & Rakic, P. (1973) Brain Res. 62, 1–35. 63– 69.
5. Rakic, P. (1972) J. Comp. Neurol. 145, 61–84. 19. Hatten, M. E. & Mason, C. A. (1990) Experientia 46, 907–916.
6. Rakic, P. (1988) Science 241, 170–176. 20. Rivas, R. J. & Hatten, M. B. (1995) J. Neurosci. 15, 981–989.
7. Caviness, V. S., Jr., & Rakic, P. (1978) Annu. Rev. Neurosci. l, 297–326. 21. Rakic, P., Knyihar-Csillik, E. & Csillik, B. (1996) Proc. Natl. Acad. Sci. USA 93,
8. Barth, P. G. (1987) J. Neurol. Sci. 14, 1–16. 9218–9222.
9. Miller, M. W. (1986) Science 233, 1308–1311. 22. Lidow, M. S. (1995) Synapse 21, 332–341.
10. Rakic, P. (1988) Prog. Brain Res. 73, 15–37. 23. Kemper, T. L., Lecours, A., Gates, M. J. & Yakovlev, P. I. (1973) Early Dev.
11. Gleeson, J. G. & Walsh, C. A. (2000) Trends Neurosci. 23, 352–359. 51, 23–62.
12. Buxhoeveden, D. P. & Casanova, M. F. (2002) Brain 125, 935–951. 24. Schull, W. J., Dobbing, J., Kameyama, Y., O’Rahilly, R., Rakic, P. & Silini, G.
13. Rakic, P. (1990) Experientia 46, 882–891. (1986) Ann. ICRP 16, 1–43.
Downloaded by guest on September 18, 2021
14. Kriegstein, A. R. & Noctor, S. C. (2004) Trends Neurosci. 27, 392–399. 25. Algan, O. & Rakic, P. (1997) J. Comp. Neurol. 381, 335–352.
15. Marin, O. & Rubenstein, J. L. (2001) Nat. Rev. Neurosci. 2, 780–790. 26. Devi, P. U., Suresh, R. & Hande, M. P. (1995) Radiat. Res. 141, 314–317.
16. Letinic, K., Zoncu, R. & Rakic, P. (2002) Nature 417, 645–649. 27. Tarantal, A. F. & Hendrickx, A. G. (1989) Teratology 39, 149–162.
Ang et al. PNAS 兩 August 22, 2006 兩 vol. 103 兩 no. 34 兩 1290928. Stark, C. R., Orleans, M., Haverkamp, A. D. & Murphy, J. (1984) Obstet. 41. Blinkov, M. S. & Gleser, I. I. (1968) The Human Brain in Figures and Tables
Gynecol. 63, 194–200. (Plenum, New York).
29. Newnham, J. P., Evans, S. F., Michael, C. A., Stanley, F. J. & Landau, L. I. 42. Rakic, P. (2003) Glia 43, 19–32.
(1993) Lancet 342, 887–891. 43. Rakic, P. (2002) Clin. Neurosci. Res. 2, 29–39.
30. Kieler, H., Cnattingius, S., Haglund, B., Palmgren, J. & Axelsson, O. (2001) 44. Rados, C. (2004) FDA Consum. Mag. 38(1), available at www.fda.gov兾fdac兾
Epidemiology 12, 618–623. features兾2004兾104㛭images.html.
31. Campbell, J. D., Elford, R. W. & Brant, R. F. (1993) Can. Med. Assoc. J. 149, 45. Sidman, R. L. & Rakic, P. (1982) in Histology and Histopathology of the Nervous
1435–1440. System, eds. Haymaker, W. & Adams, R. D. (Thomas, Springfield, IL), pp.
32. Siegel, E., Goddard, J., James, A. E., Jr., & Siegel, E. P. (1979) Radiology 133, 3–145.
175–179. 46. National Electrical Manufacturers Association (2003) Acoustic Output Mea-
33. Liebeskind, D., Bases, R., Koenigsberg, M., Koss, L. & Raventos, C. (1981) surement Standard for Diagnostic Ultrasound Equipment, Standards Publication
Radiology 138, 419–423. UD 2-2003 (Natl. Electric. Manuf. Assoc., Rosslyn, VA), Revision 1.
34. Ellisman, M. H., Palmenr, D. E. & Andre, M. P. (1987) Exp. Neurol. 98, 78–91. 47. National Electrical Manufacturers Association (2003) Standard for Real-Time
35. Stanton, M. T., Ettarh, R., Arango, D., Tonra, M. & Brennan, P. C. (2001) Life Display of Thermal and Mechanical Acoustic Output Indices on Diagnostic
Sci. 68, 1471–1475. Ultrasound Equipment, Standards Publication UD 3-2003. (Natl. Electric.
36. Fowlkes, J. B. & Holland, C. K. (2000) J. Ultrasound Med. 19, 69–72. Manuf. Assoc., Rosslyn, VA), Revision 2.
37. Rakic, P. (l971) J. Comp. Neurol. l4l, 283–3l2. 48. Center for Devices and Radiological Health (1997) Information for Manufac-
38. Lewin, P. A. (2004) Ultrasonics 42(1), 367–372. turers Seeking Marketing Clearance of Diagnostic Ultrasound Systems and
39. Lewin, P. A. & Bjorno, L. (1982) J. Acoust. Soc. Am. 71, 728–734. Transducers (Food and Drug Admin., Rockville, MD).
40. Haydar, T. F., Ang, E., Jr., & Rakic, P. (2003) Proc. Natl. Acad. Sci. USA 100, 49. Schafer, M. E. & Lewin, P. A. (1988) in IEEE Trans. Ultrason. Ferroelectrics
2890–2895. Freq. Control 35(2), 102–109.
Downloaded by guest on September 18, 2021
12910 兩 www.pnas.org兾cgi兾doi兾10.1073兾pnas.0605294103 Ang et al.You can also read