Porous Nanostructure, Lipid Composition, and Degree of Drug Supersaturation Modulate In Vitro Fenofibrate Solubilization in Silica-Lipid Hybrids
←
→
Page content transcription
If your browser does not render page correctly, please read the page content below

pharmaceutics

Article
Porous Nanostructure, Lipid Composition, and
Degree of Drug Supersaturation Modulate In Vitro
Fenofibrate Solubilization in Silica-Lipid Hybrids
Ruba Almasri 1,2 , Paul Joyce 1,2 , Hayley B. Schultz 1,2 , Nicky Thomas 1,2 ,
Kristen E. Bremmell 1,2 and Clive A. Prestidge 1,2, *
 1   UniSA Clinical and Health Sciences, University of South Australia, Adelaide 5000, Australia;
     Ruba.Almasri@mymail.unisa.edu.au (R.A.); Paul.Joyce@unisa.edu.au (P.J.);
     Hayley.Schultz@unisa.edu.au (H.B.S.); Nicky.Thomas@unisa.edu.au (N.T.);
     Kristen.Bremmell@unisa.edu.au (K.E.B.)
 2   ARC Centre of Excellence in Convergent Bio-Nano Science and Technology, University of South Australia,
     Adelaide 5000, Australia
 *   Correspondence: Clive.Prestidge@unisa.edu.au; Tel.: +61-8830-22438

 Received: 3 July 2020; Accepted: 20 July 2020; Published: 21 July 2020

 Abstract: The unique nanostructured matrix obtained by silica-lipid hybrids (SLHs) is well known
 to improve the dissolution, absorption, and bioavailability of poorly water-soluble drugs (PWSDs).
 The aim of this study was to investigate the impact of: (i) drug load: 3–22.7% w/w, (ii) lipid
 type: medium-chain triglyceride (Captex 300) and mono and diester of caprylic acid (Capmul
 PG8), and (iii) silica nanostructure: spray dried fumed silica (FS) and mesoporous silica (MPS),
 on the in vitro dissolution, solubilization, and solid-state stability of the model drug fenofibrate
 (FEN). Greater FEN crystallinity was detected at higher drug loads and within the MPS formulations.
 Furthermore, an increased rate and extent of dissolution was achieved by FS formulations when
 compared to crystalline FEN (5–10-fold), a commercial product; APO-fenofibrate (2.4–4-fold) and
 corresponding MPS formulations (2–4-fold). Precipitation of FEN during in vitro lipolysis restricted
 data interpretation, however a synergistic effect between MPS and Captex 300 in enhancing FEN
 aqueous solubilization was attained. It was concluded that a balance between in vitro performance
 and drug loading is key, and the optimum drug load was determined to be between 7–16% w/w,
 which corresponds to (200–400% equilibrium solubility in lipid Seq ). This study provides valuable
 insight into the impact of key characteristics of SLHs, in constructing optimized solid-state lipid-based
 formulations for the oral delivery of PWSDs.

 Keywords: supersaturation; silica-lipid hybrid; spray drying; lipolysis; lipid-based formulation;
 fenofibrate; mesoporous silica; oral drug delivery

1. Introduction
     Due to the staggering number of new drug entities with poor physicochemical properties under
development, formulation scientists are challenged to design innovative formulations that successfully
overcome these molecules’ inherent slow dissolution and poor oral absorption [1]. Amongst novel drug
delivery systems, lipid-based formulations (LBFs) present opportunities for successfully delivering
poorly water-soluble drugs (PWSDs), owing to their ability to mimic the postprandial effect [2]. Upon
ingestion, the lipid content within these formulations triggers the release of digestive pancreatic and
gallbladder enzymes and a sequence of digestive processes that result in the dynamic formation of
a range of colloidal systems (e.g., micelles) [3,4]. This naturally occurring phenomenon maintains
the drug in the solubilized state and creates a concentration gradient that acts as a driving force for

Pharmaceutics 2020, 12, 687; doi:10.3390/pharmaceutics12070687            www.mdpi.com/journal/pharmaceutics
Pharmaceutics 2020, 12, 687                                                                        2 of 22

absorption, thus reducing the food effect for lipophilic drugs. Furthermore, such formulations deliver
the drug to the gastrointestinal tract (GIT) in a pre-solubilized form, eliminating the requirement
for dissolution as a rate limiting step for absorption [5]. As such, LBFs present promising benefits
for poorly water-soluble, highly permeable, BCS (Biopharmaceutics Classification System) class II
drugs [6,7].
      Numerous studies have shown that, by manipulating the lipids and excipients used, enhancements
in permeability, intestinal solubilization and absorption through the lymphatic system can be achieved,
along with benefits in bypassing first-pass metabolism, inhibition of efflux transporters, and prevention
of pre-systemic metabolism [4,8,9]. Although considerable research has been devoted to examining and
refining formulation approaches to enhance the biopharmaceutical performance of LBFs, the number
of successful products on the market are limited [5]. This is mainly due to their low stability, tendency
to recrystallize and precipitate in vivo and costly manufacturing processes. In addition, several studies
have reported poor correlation between in vitro and in vivo results [10,11].
      Solidification represents an effective solution to overcome challenges associated with liquid LBFs,
while optimizing the advantages related to lipids [6,12,13]. Solid-state LBFs are fabricated by adsorbing
the liquid-state LBFs onto a solid carrier material. This can be achieved using various solid carriers
(silica and silicate materials, polysaccharide, polymeric, and protein) and/or by adapting different
techniques, including spray drying, lyophilization, rotary evaporation, melt extrusion, and melt
granulation [14–16]. Silica-based adsorbents are commonly used as solid carriers for LBFs due to their
biocompatibility, inert nature and highly porous structure [17,18], which provides increased surface
area for adsorption of liquid lipids [19,20]. Furthermore, the high degree of versatility afforded by
silica materials introduces the ability to manipulate the biopharmaceutical performance of silica lipid
hybrids (SLHs) through changes in particle size, nanostructure and porosity [17,21,22]. For example,
several studies have verified the ability to control both the rate and extent of lipid digestion, and
the subsequent rate of drug release and absorption in SLHs through changes in nanostructure and
surface chemistry [23–26]. Therefore, careful examination of the physiochemical properties of the silica
carrier and composition should be considered during the fabrication of solid-state LBFs in order to
seize their full therapeutic potential.
      For most LBFs, typical drug loads are ≤5% w/w [24,27]. The drug loads are further reduced when
LBFs are solidified by adsorption onto a solid carrier [16,19], such as for SLH, which in turn limits
their potential commercial application to low dose, highly potent drugs. Thus, despite their success in
stabilizing precursor liquid LBFs and significantly enhancing dissolution and solubilization of model
drugs, low drug loading levels limit the commercial translation of SLHs. In addition to understanding
the structure-activity relationships between porous silica properties and drug solubilization, recent
attention has been afforded to improving the drug loading within SLHs through a supersaturation
approach, which has led to the creation of supersaturated SLHs (super-SLH) [28–31].
      Super-SLH, defined as drug dissolved in lipid above its equilibrium solubility (Seq ) at room
temperature, were fabricated by dissolving quantities of drug in a lipid using heat, followed by
solidification employing preformed mesoporous silica microparticles, which upon cooling, generated
supersaturated powders [30]. The lipid-drug solution was imbibed into the nanopores of the silica
and/or stabilized on the surface of the silica particles to maintain the drug in a molecular state [31].
The method has demonstrated high drug loading, increased stability of the supersaturated drug,
enhanced dissolution, and improved oral bioavailability of the PWSDs ibuprofen (IBU) [29,30] and
abiraterone acetate (AbA) [28,31]. However, there is a fine balance between increasing the drug
loading/supersaturation level and achieving enhanced biopharmaceutical performance, as the drug
can recrystallize in the solid state, resulting in reduced dissolution. For IBU super-SLH, the ideal
supersaturation level was 227% Seq , which achieved a 2.2-fold enhancement in oral bioavailability in
Sprague-Dawley rats when compared to the commercial product, Nurofen [30]. In contrast, for AbA
super-SLH, despite the supersaturated formulations significantly enhancing in vitro solubilization,
only the unsaturated SLH (at 90% Seq ) achieved an oral bioavailability that exceeded the commercial
Pharmaceutics 2020, 12, 687                                                                          3 of 22

product Zytiga (1.4-fold) in Sprague-Dawley rats [28]. Furthermore, when AbA super-SLH contained
different lipids (Capmul PG8 or Capmul MCM), there were significant differences between their
loading and in vitro and in vivo performances.
      The published literature on super-SLH highlights that their performance is highly drug- and
lipid-dependent, with only two drugs and two lipids being investigated thus far. Furthermore, only
one type of silica has been applied to super-SLH. Therefore, there is significant opportunity for further
investigation into the influence of these excipients to develop improved super-SLH formulations
and exploit their full potential. On this basis, the focus of this study was to investigate the impact
of (i) porous silica nanostructure, (ii) lipid type, and (iii) drug loading on the in vitro solubilization,
dissolution, and solid-state stability of super-SLH [26]. To investigate silica nanostructure, preformed
mesoporous silica microparticles were compared to a bottom-up approach to prepare porous silica
microparticles that could be loaded with liquid lipid through spray drying fumed silica (FS). The lipids
Capmul PG8 (monoester of caprylic acid) and Captex 300 (medium chain triglyceride) were investigated,
with drug loads corresponding to 80, 200, 400, and 600% Seq . Fenofibrate (FEN), an antilipemic agent
and BCS class II compound, was selected as the model drug to be applied to super-SLH for this study. It
was chosen due to its poor water solubility ( 0.999.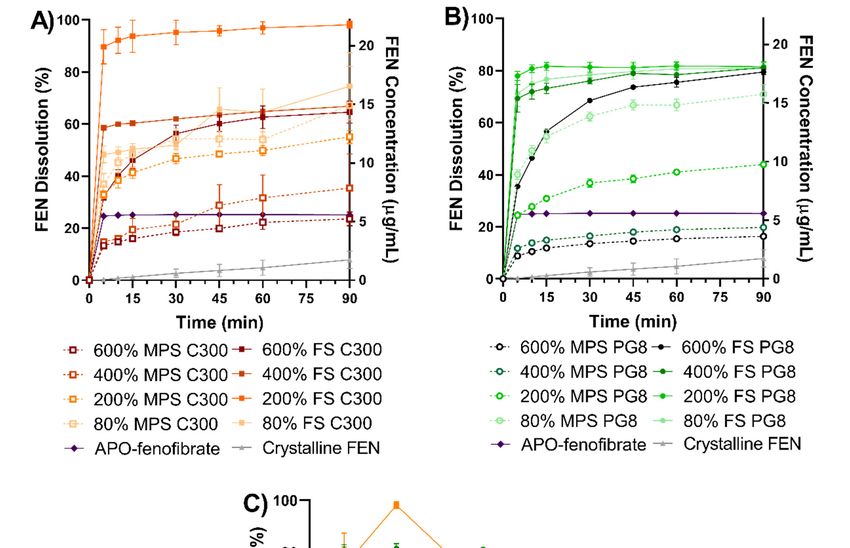
Pharmaceutics 2020, 12, 687                                                                        4 of 22

2.3. Lipid Solubility Studies
     The equilibrium solubility (Seq ) of FEN in Capmul PG8, Captex 300, and Capmul MCM was
determined in triplicate at 25, 40, and 60 ◦ C. An excess of FEN was added to centrifuge tubes containing
approximately 0.5 g lipid. The tubes were vortex mixed for 10–20 s to aid drug dissolution and placed
on a rotator in an oven at the required temperature. After 24 h, samples were centrifuged at 44,800 rcf
for 30 min at the required temperature to precipitate any undissolved drug. Methanol was used to
extract the dissolved drug from the supernatant and was appropriately diluted with mobile phase
prior to HPLC analysis. Samples were vortexed and returned to the rotator in the oven and analyzed
every 24 h until equilibrium solubility was reached. This was indicated by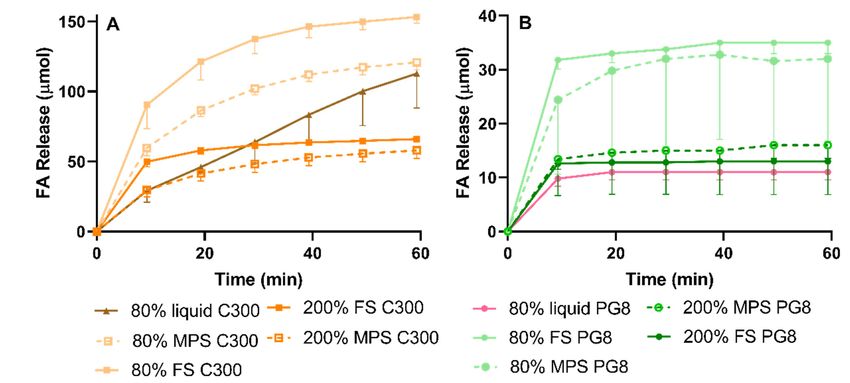
Pharmaceutics 2020, 12, 687                                                                         5 of 22

2.5.3. Confocal Laser Scanning Microscopy
     A Zeiss Elyra PS-1 microscope (Jena, Germany) was used to perform confocal laser scanning
microscopy on blank SLH. Silica microparticles were labeled with rhodamine B and lipids were labeled
with coumarin 6. Confocal images were captured at the emission wavelength of 488 nm for coumarin 6
(excitation wavelength 497 nm) and 625 nm for rhodamine B (excitation wavelength 540 nm).

2.5.4. Drug Load Determination
    FEN content was determined by solvent extraction. Approximately 10 mg of formulation was
weighed into a glass vial, followed by the addition of 10 mL of methanol. Vials were sonicated for
45 min to extract FEN. Aliquots were centrifuged (44,800 rcf for 20 min) to sediment undissolved solids.
Then, the supernatants were appropriately diluted and analyzed using HPLC.

2.6. Aqeous Media Solubility Studies
     The equilibrium solubility of FEN in 0.0125 M SLS, FaSSGF, and FaSSIF was determined by
the addition of excess FEN to 1 mL of media in 1.5 mL centrifuge tubes. The tubes were vortexed for
10–20 s to aid drug dissolution and placed on a rotator in the oven at 37 ◦ C. After 48 h, samples were
centrifuged at 44,800 rcf for 30 min at 37 ◦ C to precipitate any undissolved drug. Methanol was used
to extract dissolved drug from the supernatant, prior to dilution with mobile phase and quantification
of FEN content by HPLC.

2.7. In Vitro Dissolution Studies
     FEN dissolution studies were performed to compare the dissolution kinetics of various SLH
formulations, crystalline FEN and APO-fenofibrate. The studies were performed in 0.0125 M SLS
solution, as FEN is a neutral drug and practically insoluble in aqueous media [32]. However, using SLS
significantly enhances its solubility, and its use as a dissolution media has been evaluated for multiple
FEN-containing formulations in order to achieve sink conditions [33–36]. Dissolution was performed
using a Vankel USP II apparatus (Agilent Technologies, Santa Clara, CA, USA), 450 mL of media was
maintained at 37 ◦ C and rotating at 50 rpm. An equivalent of 10 mg of FEN of formulation was added
to the dissolution vessel. Three-milliliter aliquots were removed at 1, 5, 10, 15, 30, 45, 60, and 90 min,
replaced by fresh media, and filtered using 0.45 µm syringe filter prior to appropriate dilution with
mobile phase and analysis with HPLC.

2.8. In Vitro Gastrointestinal Lipolysis Studies
    For the present study, a combined gastrointestinal (GI) in vitro lipolysis model adapted from [37]
was employed to test solubilization of FEN under digesting conditions. FaSSIF/FeSSIF/FaSSGF powder
was used to prepare gastric (FaSSGF) and intestinal (FaSSIF) media, according to manufacturer’s
protocol (biorelevant.com, London, UK). Media were freshly prepared before each experiment and
used within 48 h, according to manufacturer’s recommendations.

2.8.1. Preparation of Simulated Gastric Lipolysis Media
     FaSSGF buffer (pH 1.6 ± 0.01) was prepared by dissolving 2.00 g NaCl in 1 L Milli Q water
and adjusting the pH with 0.2 M HCl, prior to the addition of 0.06 g biorelevant powder to prepare
biorelevant FaSSGF.

2.8.2. Preparation of Simulated Intestinal Lipolysis Media
     FaSSIF was prepared by dissolving 2.240 g FaSSIF/FeSSIF/FaSSGF powder in 1L pH 6.5 ± 0.01
buffer (0.42 g NaOH, 3.4 g NaH2 PO4 , 6.2 g NaCl, 1L MilliQ). NaOH (1 M) and HCl (1 M) were used to
adjust the pH of the intestinal buffer. Following preparation and before use, intestinal lipolysis media
was left standing for 2 h to allow equilibrium of buffer excipients and micelles formation. On the day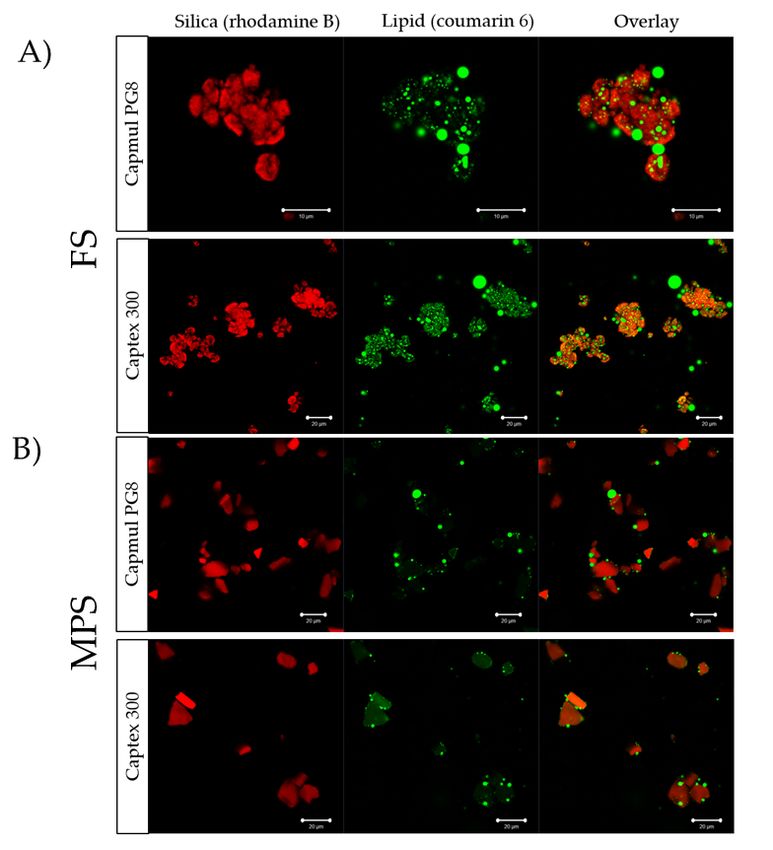
Pharmaceutics 2020, 12, 687                                                                          6 of 22

of the experimental procedure, pancreatin extracts were prepared by stirring 2 g of pancreatin powder
in 10 mL of intestinal lipolysis buffer (pH 6.5) for 15 min, followed by centrifugation (2268 rcf, 20 min,
4 ◦ C). The supernatant was collected in a glass vial and kept refrigerated.

2.8.3. Gastrointestinal Digestion Experimental Procedure
      Lipid digestion kinetics were monitored for a total of 90 min (30 min gastric step followed by
60 min intestinal step). A Metrohm 902 Titrando pH-stat titration apparatus equipped with a Dosino
800 dosing apparatus (Herisau, Switzerland) was used for the studies. The experimental procedure
was initiated with the addition of an amount of formulation corresponding to 3 mg of FEN into
a temperature-controlled reaction vessel containing 10 mL of freshly prepared FaSSGF (37 ◦ C, pH
1.6). Gastric lipolysis was carried out for 30 min and was initiated by the addition of 100 µL Candida
lipase (600 tributyrin units lipase activity). Following gastric lipolysis, 18 mL of FaSSIF media was
added (pH 6.5) to the reaction vessel, and the pH was automatically adjusted by the pH-stat apparatus
to maintain pH at 6.5 ± 0.01. Following a pH-equilibration time of 3–5 min, intestinal lipolysis was
initiated by the addition of 2 mL freshly prepared pancreatin extract, bringing the total volume to
30 mL. Fatty acids (FA) produced as a result of digestion were instantly titrated with 0.6 M NaOH to
maintain a constant pH of 6.50 ± 0.01. The cumulative volume of NaOH was converted to the number
of moles of NaOH consumed, which in turn corresponded to the number of moles of FA released.
Data obtained from NaOH titration were used to compare the rate and extent of lipid digestion for
the different formulations. It is important to note that NaOH titration during the gastric step does not
reflect extent of lipolysis since the FA produced are protonated at pH 1.6 and could therefore not be
recorded during gastric lipolysis [37].

2.8.4. Drug Phase Partitioning During In Vitro Lipolysis
     The solubilization of FEN in the aqueous phase during in vitro gastrointestinal lipolysis was
measured. Aliquots (1 mL) were withdrawn at 1, 15, and 30 min (gastric phase) and 1, 5, 10, 15, 30,
45, and 60 min (intestinal phase) and transferred into 1.5 mL centrifuge tubes prefilled with 10 µL of
4-BBA (0.5 M in methanol) as a lipase inhibitor. Samples were centrifuged (32,760 rcf, 10 min, 25 ◦ C) to
separate the aqueous phase, containing solubilized FEN, and precipitated pellet. The supernatant was
appropriately diluted prior to analysis by HPLC. The supernatant was discarded to leave the pellet and
was re-dispersed through addition of 1 mL methanol, vortex mixed for 30 s, followed by sonication for
45 min. The tube was centrifuged (32,760 rcf, 10 min, 25 ◦ C), and the supernatant was diluted and
analyzed by HPLC.

2.9. Statistical Analysis
     All statistical analyses of experimental data were performed using GraphPad Prism Version 8.0.
Statistically significant differences were determined by one-way ANOVA followed by Tukey’s post-test
for multiple comparisons. Values are reported as the mean ± standard deviation (SD), and the data
were considered statistically significant when p < 0.05.

3. Results

3.1. Influence of Temperature on FEN Solubility in Lipids
     In order to select the optimum lipids for supersaturating FEN, solubility studies were performed
at 25, 40, and 60 ◦ C in Capmul PG8 (PG8), Captex 300 (C300) and Capmul MCM (MCM). It was
evident that FEN solubility in all lipids increased considerably with temperature, achieving 4.4- to
7.7-fold greater FEN solubility at 60 ◦ C compared to 25 ◦ C (Figure 1). Regardless of temperature, FEN
displayed greatest solubility in PG8, achieving a solubility of 98 ± 3.5 mg/g at 25 ◦ C and 516 ± 29.5 mg/g
at 60 ◦ C. PG8 and C300 were chosen for the fabrication of FEN-loaded SLH due to both lipids exerting
the highest drug loading at 60 ◦ C. MCM was excluded due to its inferior drug loading capacity.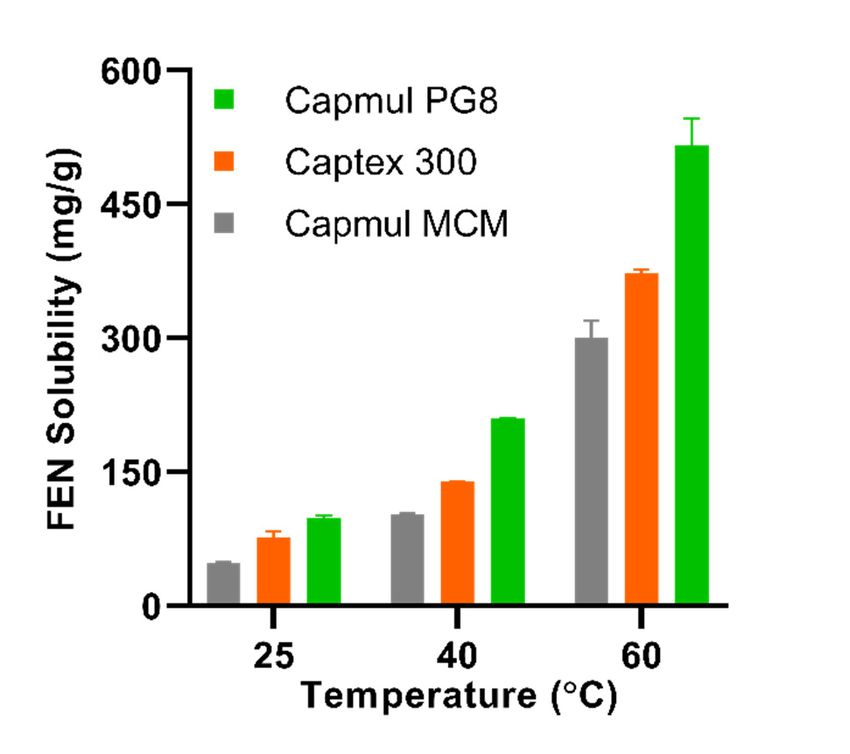
Pharmaceutics 2020,
Pharmaceutics 12, 12,
2020, 687x FOR PEER REVIEW 7 of7 22
of 22
Figure 1. The temperature-dependent solubility of fenofibrate (FEN) in Capmul MCM (grey bars),
Figure 1. The temperature-dependent solubility of fenofibrate (FEN) in Capmul MCM (grey bars),
Captex 300 (orange bars), and Capmul PG8 (green bars). Values represent mean ± SD, n = 3.
Captex 300 (orange bars), and Capmul PG8 (green bars). Values represent mean ± SD, n = 3.
3.2. Super-SLH Preparation and Characterization
3.2. Super-SLH Preparation and Characterization
FEN-loaded SLH were fabricated with varying (i) lipid types, (ii) silica types, and (iii) drug
FEN-loaded
loads. The SLH were
compositions and fabricated
drug loadswith of thevarying (i) lipid
fabricated types, (ii) silica
formulations are types, and (iii)indrug
summarized loads.
Table 1.
Subsequently, fabricated SLH formulations were identified and categorized according to type of lipid 1.
The compositions and drug loads of the fabricated formulations are summarized in Table
Subsequently,
used to dissolve fabricated
FEN (PG8SLH formulations
or C300), were identified
type of silica and categorized
microparticles according
used to stabilize to typeliquid
precursor of lipid
lipid (FS or MPS), and drug load based on % Seq ranging from 80% Seq (unsaturated) to 600%liquid
used to dissolve FEN (PG8 or C300), type of silica microparticles used to stabilize precursor Seq
lipid (FS
(highly or MPS), and Furthermore,
supersaturated). drug load based liquidonlipid
% Seqformulations
ranging fromwere 80%prepared
Seq (unsaturated)
at 80% Seq toin600%
bothSeq
(highly
lipids, supersaturated).
in order to compare Furthermore,
the influence of liquid lipid formulations
solidification were prepared
on drug release at 80% Seq Drug
and solubilization. in both
loads ranging from 3.8 to 22.7% w/w were attained for PG8-containing formulations and 3 to 18.8Drug
lipids, in order to compare the influence of solidification on drug release and solubilization. %
w/w for C300-containing formulations. Furthermore, three formulations were randomly selected to %
loads ranging from 3.8 to 22.7% w/w were attained for PG8-containing formulations and 3 to 18.8
w/w forthe
evaluate C300-containing
homogeneity offormulations.
FEN throughout Furthermore, threeand
the formulation formulations
to assess thewere
drugrandomly selected to
loading efficiency
(Table S1). All tested formulations displayed high drug loading efficiency of at least 94 ± 2.8%loading
evaluate the homogeneity of FEN throughout the formulation and to assess the drug w/w
efficiency (Table S1). All
with small standard deviation. tested formulations displayed high drug loading efficiency of at least 94 ±
2.8% w/w with small standard deviation.
Table 1. The calculated composition of the fabricated FEN-loaded liquid and silica-lipid hybrid
Table
(SLH) 1. The calculated composition of the fabricated FEN-loaded liquid and silica-lipid hybrid (SLH)
formulations.
formulations.
Saturation Drug Lipid Silica
Silica
Lipid Type Formulation Name Level
Saturation Load
Drug LoadLipid LoadSilica
Type
Silica
Lipid Type Formulation Name (% S eq
Level) (% w/w)
Load (% w/w)
Load (% w/w)Load
Type
- 80% Liquid PG8 * 80 Seq)
(% 7.3 w/w)
(% 92.7
(% w/w) - (% w/w)
- 80%80%Liquid
FS PG8PG8 * 8080 3.87.3 48.1 92.7 48.1 -
80% FS
200% FS PG8
PG8 20080 8.93.8 45.5 48.1 45.5 48.1
FS 200% FS
400% FS PG8
PG8 200
400 16.4
8.9 41.8
45.5 41.8
45.5
FS
Capmul PG8 400% FS PG8 400 16.4 41.8 41.8
600% FS PG8 600 22.7 38.6 38.6
Capmul PG8 600% FS PG8 600 22.7 38.6 38.6
80% MPS PG8 80 3.8 48.1 48.1
80% MPS PG8 80 3.8 48.1 48.1
200% MPS
200% MPSPG8PG8 200
200 8.98.9 45.5 45.5 45.5 45.5
MPS
MPS
400% MPS
400% MPSPG8PG8 400
400 16.4
16.4 41.8 41.8 41.8 41.8
600% MPSPG8
600% MPS PG8 600
600 22.7
22.7 38.6 38.6 38.6 38.6
- 80% Liquid C300 * 80 5.8 94.2 -
80% FS C300 80 3 48.5 48.5
Captex 300 200% FS C300 200 7.1 46.4 46.4
FS
400% FS C300 400 13.4 43.3 43.3
600% FS C300 600 18.8 40.6 40.6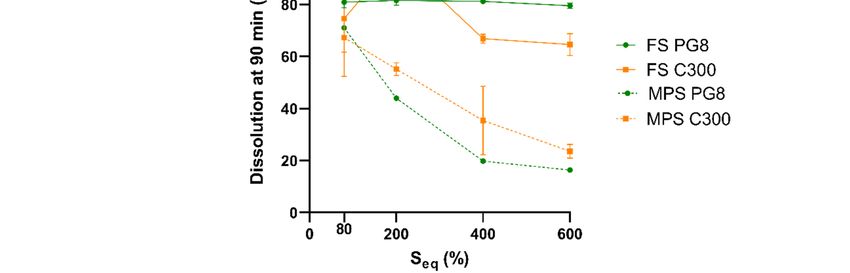
Pharmaceutics 2020, 12, 687                                                                                              8 of 22

                                                            Table 1. Cont.

                                                                        Saturation         Drug         Lipid     Silica
                              Silica
       Lipid Type                          Formulation Name               Level            Load         Load      Load
                              Type
                                                                         (% Seq )         (% w/w)      (% w/w)   (% w/w)
                                -           80% Liquid C300 *                80              5.8        94.2        -
                                               80% FS C300                   80               3         48.5      48.5
                                              200% FS C300                   200             7.1        46.4      46.4
                               FS             400% FS C300                   400            13.4        43.3      43.3
       Captex 300                             600% FS C300                   600            18.8        40.6      40.6
                                              80% MPS C300                   80               3         48.5      48.5
                                             200% MPS C300                   200             7.2        46.4      46.4
                              MPS
                                             400% MPS C300                   400            13.4        43.3      43.3
                                             600% MPS C300                   600            18.8        40.6      40.6
                                    * Liquid formulations do not contain any silica (solid carrier).

3.2.1. Drug Crystallinity
     DSC and XRPD were utilized for the qualitative, solid-state characterization of FEN in the SLH
formulations. The DSC thermograms of a physical mixture (5% w/w crystalline FEN with FS),
crystalline FEN, FS, and MPS formulations are displayed in Figure 2. Crystalline FEN exhibited
a sharp endothermic peak at 80 ◦ C, corresponding to its melting point [38], whereas the FS physical
mixture exhibited a small endothermic peak (Figure 2A). Furthermore, this thermogram suggests
that crystalline FEN could be detected at concentrations ~5% w/w when present within silica particles.
Regardless of the silica type or lipid used, endothermic peaks were absent for all 80% and 200% SLH
formulations, suggesting that the drug was in a non-crystalline state. However, all other formulations
of higher drug loads demonstrated shifted endothermic peaks varying in size and stretching between
45–60 ◦ C. The shifted endothermic peaks for all 400% formulations were smaller than for the 600%
formulations, which suggests the presence of higher concentrations of crystalline FEN at higher
saturation levels (Figure 2B,C). No apparent difference in DSC thermograms was observed between
PG8 or C300 SLH formulations, whether loaded in FS or MPS. Therefore, XRPD patterns were only
obtained for SLH formulations containing PG8, since higher drug loads were achieved in comparison
to the SLH C300 formulations.
     Crystalline FEN demonstrated characteristic XRPD patterns as previously reported (Figure 2D) [39].
For the 5% w/w physical mixture, characteristic crystalline FEN patterns can be observed but differ
in intensity between FS and MPS (Figure 2E,F). XRP diffractograms indicate that the method can
detect as low as 5% w/w crystalline FEN. In SLH formulations fabricated with FS PG8, no crystalline
FEN was detected at drug loads of 80% and 200%. However, at 400% and 600% FS PG8, intense
peaks were observed, suggesting the presence of crystalline FEN. These findings correspond with
data obtained with DSC analysis. However, all supersaturated MPS PG8 formulations (200, 400, and
600% Seq ) displayed characteristic peaks of varying intensities, suggesting the presence of crystalline
FEN (Figure 2F), and no crystalline drug was detected with unsaturated 80% P PG8 formulation. It is
important to note that some characteristic peaks where absent from XRPD pattern obtained from 200%
P PG8, suggesting the presence of a FEN polymorph [38]. For both FS and MPS systems, XRPD patterns
obtained from 600% Seq formulations displayed peaks with higher intensities than corresponding 400%
Seq formulations, displaying an ~2-fold increased intensity, suggesting the presence of higher amounts
of crystalline FEN in SLH prepared at 600% Seq . Furthermore, MPS formulations exhibited peaks with
higher relative intensities compared to corresponding FS formulations that were ~1.6-fold higher at
Pharmaceutics 2020, 12, 687 9 of 22
400% and 600% Seq . This was evident when the peak intensities obtained at 22.3◦ (2θ) were plotted
against % S2020,
Pharmaceutics eq , as
12,displayed
x FOR PEERin Figure S1.
REVIEW 9 of 22
Figure 2. Differential scanning calorimetry (DSC) thermograms of (A) crystalline FEN and fumed silica
Figure 2. Differential scanning calorimetry (DSC) thermograms of (A) crystalline FEN and fumed
(FS) physical mix 5% w/w, (B) FEN-loaded FS formulations and (C) FEN-loaded mesoporous silica
silica (FS) physical mix 5% w/w, (B) FEN-loaded FS formulations and (C) FEN-loaded mesoporous
(MPS) formulations. The X-ray powder diffraction (XRPD) diffractograms of (D) crystalline FEN, (E)
silica (MPS) formulations. The X-ray powder diffraction (XRPD) diffractograms of (D) crystalline
FS PG8 formulations and (F) MPS PG8 formulations.
FEN, (E) FS PG8 formulations and (F) MPS PG8 formulations.
3.2.2. Surface Morphology and Lipid Distribution
3.2.2. Surface Morphology and Lipid Distribution
Surface morphology, internal structure, and lipid distribution within fabricated SLH formulations
wereSurface
examined morphology,
using SEM and internal
confocalstructure, and micriscopy
laser scanning lipid distribution
(Figures 3 within fabricated
and 4). Blank SLH
FS particles
formulations were examined using SEM and confocal laser scanning micriscopy (Figures
formed semi-spherical shapes of varying particle sizes with distinct concave-like structures (Figure 3A). 3 and 4).
Blank FS particles
No difference formed semi-spherical
in appearance was observedshapes
between of varying
blank FSparticle
and 80% sizes with(Figure
FS PG8 distinct3B).
concave-like
However,
structures (Figure 3A).
at 200% saturation No regardless
level, difference inofappearance was observed
the lipid used, between
FS particles blanktoFS
appeared and clusters
form 80% FS PG8
and
(Figure 3B). However, at 200% saturation level, regardless of the lipid used, FS particles
large aggregates (Figure 3C). In contrast, MPS appeared as angular structures and formed aggregates appeared to
form clustersofand
irrespective thelarge
lipid aggregates
used or FEN (Figure 3C). In
saturation contrast,
level (FigureMPS appeared
3E,F). as angular
No difference structures and
in appearance was
formed aggregates irrespective of the lipid used or FEN saturation level (Figure 3E,F).
observed between SLH prepared with either lipid types; therefore, only SEM images of SLH prepared No difference
in
withappearance was observed between SLH prepared with either lipid types; therefore, only SEM
PG8 are shown.
images of SLH prepared with PG8 are shown.Pharmaceutics 2020, 12, 687 10 of 22
Pharmaceutics 2020, 12, x FOR PEER REVIEW 10 of 22
Figure
Figure 3.
3. SEM
SEMimages
imagesof
of(A)
(A)blank
blankFS,
FS,(B)
(B)80%
80%FS
FSPG8,
PG8,(C)
(C)200%
200%FS
FSPG8,
PG8, (D)
(D)blank
blank MPS,
MPS, (E)
(E) 80%
80% MPS
MPS
PG8, and (F) 200% MPS PG8.
PG8, and (F) 200% MPS PG8.
Confocal imagingrevealed
Confocal imaging revealedthatthat the lipid
the lipid distribution
distribution within within
the silicathe silica microparticles
microparticles was
was dependent
dependent
on the typeonofthe typeand
silica of silica
lipid and
used.lipid used.
More More
lipid waslipid was observed
observed within within the internal
the internal structure
structure of FS
of FS particles
particles than than
MPS,MPS, evidenced
evidenced by intensity
by the the intensity of the
of the fluorescently
fluorescently labeled
labeled lipid
lipid within
within thethe pores
pores of
of the silica microparticles (Figure 4). However, it was evident that
the silica microparticles (Figure 4). However, it was evident that PG8 was lessPG8 was less prone to imbibe into
into
the
the porous
porous matrix
matrix compared
compared to to C300,
C300, with
with lipid
lipid droplets
droplets tending
tending toto reside between
between inter-particle
inter-particle
cavities,
cavities, irrespective
irrespectiveofofthe
thesilica
silicatype.
type.In In
contrast,
contrast,C300 homogeneously
C300 homogeneously distributed throughout
distributed throughoutthe
internal structure,
the internal withwith
structure, the presence
the presenceof additional lipidlipid
of additional droplets between
droplets between the the
particles.
particles.Pharmaceutics 2020, 12, 687 11 of 22
Pharmaceutics 2020, 12, x FOR PEER REVIEW 11 of 22
Figure
Figure4. 4.Confocal
Confocalimages
images of:of:(A)
(A)SLH
SLHprepared
preparedwith
withFSFSand
and(B)
(B)SLH
SLHprepared
prepared with
withMPS.
MPS.Rhodamine
Rhodamine
BB(red) was
(red) wasused to to
used label silica,
label and
silica, coumarin
and 6 (green)
coumarin was
6 (green) used
was used to to
label lipid.
label lipid.
3.3. In Vitro Dissolution
3.3. In Vitro Dissolution
The dissolution performance of various SLH prepared with FS and MPS, APO-fenofibrate, and
The dissolution performance of various SLH prepared with FS and MPS, APO-fenofibrate, and
crystalline FEN is reported in Figure 5. The equilibrium solubility of FEN in 0.0125 M SLS (0.36%)
crystalline FEN is reported in Figure 5. The equilibrium solubility of FEN in 0.0125 M SLS (0.36%)
was 128 ± 0.01 µg/mL; thus, the study was performed under sink conditions. Crystalline FEN and
was 128 ± 0.01 µg/mL; thus, the study was performed under sink conditions. Crystalline FEN and
APO-fenofibrate displayed 7.8% and 25.1% solubilization after 90 min, respectively. At 80% saturation
APO-fenofibrate displayed 7.8% and 25.1% solubilization after 90 min, respectively. At 80%
level, all SLH formulations, irrespective of type of silica or lipid, exhibited significantly enhanced FEN
saturation level, all SLH formulations, irrespective of type of silica or lipid, exhibited significantly
dissolution, with FS formulations achieving 70.9–98.1% after 90 min and displaying slightly improved
enhanced FEN dissolution, with FS formulations achieving 70.9–98.1% after 90 min and displaying
performance compared to MPS formulations (p > 0.05). FEN dissolution from FS formulations at 80%
slightly improved performance compared to MPS formulations (p > 0.05). FEN dissolution from FS
Seq corresponded to 8- to 10-fold and 2.6- to 3.2-fold increase in dissolution compared to crystalline
formulations at 80% Seq corresponded to 8- to 10-fold and 2.6- to 3.2-fold increase in dissolution
FEN and APO-fenofibrate, respectively (p < 0.05). However, FEN dissolution from supersaturated SLH
compared to crystalline FEN and APO-fenofibrate, respectively (p < 0.05). However, FEN dissolution
formulations was dependent on type of lipid and silica utilized. FS PG8 formulations at all saturation
from supersaturated SLH formulations was dependent on type of lipid and silica utilized. FS PG8
levels (80%, 200%, 400%, 600% Seq ) achieved a comparable extent of FEN dissolution of ~80% after
formulations at all saturation levels (80%, 200%, 400%, 600% Seq) achieved a comparable extent of
FEN dissolution of ~ 80% after 90 min, despite 600% FS PG8 displaying slower release kinetics (p >
0.05) (Figure 5B). In contrast, FEN dissolution was significantly hindered in supersaturated MPS PG8Pharmaceutics 2020, 12, 687 12 of 22
Pharmaceutics 2020, 12, x FOR PEER REVIEW 12 of 22
90 min, despite 600% FS PG8 displaying slower release kinetics (p > 0.05) (Figure 5B). In contrast, FEN
dissolution was significantly hindered in supersaturated MPS PG8 formulations, with 200% MPS PG8
formulations, with 200% MPS PG8 achieving 43.9% FEN dissolution after 90 min, and was further
achieving 43.9% FEN dissolution after 90 min, and was further reduced for 400% and 600% Seq with no
reduced for 400% and 600% Seq with no significant difference compared to crystalline FEN and APO-
significant difference compared to crystalline FEN and APO-fenofibrate (p > 0.05).
fenofibrate (p > 0.05).
Figure5.5. The
Figure The in
invitro
vitrodissolution
dissolutionprofiles
profilesof ofcrystalline
crystallineFEN,
FEN,APO-fenofibrate
APO-fenofibrateand
andFEN-loaded
FEN-loadedSLH SLH
formulations(at
formulations (atdifferent
differentsaturation
saturation levels)
levels) in in 0.0125
0.0125 M SLS,
M SLS, dosed
dosed atmg
at 10 10 of
mgFEN
of FEN
overover 90 at
90 min min at
sink
sink conditions.
conditions. (mean(mean = 3).n(A)
± SD, ±n SD, = 3).SLH
(A)C300
SLH formulations,
C300 formulations, (B)PG8
(B) SLH SLH PG8 formulations,
formulations, and (C) and
FEN(C)%
FEN % dissolution
dissolution at 90 minatvs90%min
Seqvs
. % Seq.
The
The200%
200%FS FS
C300 formulation
C300 achieved
formulation the highest
achieved FEN dissolution
the highest of 98.1%, which
FEN dissolution corresponds
of 98.1%, which
to approximately
corresponds 4- and 14-fold4-increased
to approximately and 14-folddissolution
increasedcompared
dissolutiontocompared
APO-fenofibrate and crystalline
to APO-fenofibrate and
FEN, respectively
crystalline (p < 0.05). However,
FEN, respectively this was not
(p < 0.05). However, thisstatistically significant
was not statistically when compared
significant to 200%
when compared
FS PG8 (p
to 200% FS>PG8
0.05).
(p >Only
0.05).66.8%
Only and
66.8%64.6% FEN dissolution
and 64.6% was observed
FEN dissolution fromfrom
was observed 400%400%
and and
600%600%Seq
for
Seq FS
for C300 formulations,
FS C300 formulations, respectively.
respectively. When
When MPS
MPSwas wasutilized
utilizedtotosolidify
solidifysupersaturated
supersaturated C300C300
LBFs,
LBFs, aa similar
similar pattern
pattern was
was observed
observed to tosupersaturated
supersaturated MPS MPS PG8
PG8 formulations
formulations (Figure
(Figure 5C),
5C), where
where
the
the dissolution
dissolution was
wassignificantly
significantlyreduced
reducedwithwithincreased
increasedsupersaturation.
supersaturation. 200%200% MPS
MPS C300
C300 achieved
achieved
55.2%
55.2%FENFENdissolution,
dissolution,whereas
whereas FEN
FEN dissolution
dissolutionof only
of only35.4% andand
35.4% 23.5% waswas
23.5% attained fromfrom
attained 400%400%and
600% MPS C300
and 600% MPSformulations, respectively,
C300 formulations, with no significant
respectively, with nodifference compared
significant to crystalline
difference compared FENto
and APO-fenofibrate
crystalline (p > 0.05). The influence
FEN and APO-fenofibrate of The
(p > 0.05). silicainfluence
type andof saturation
silica typelevel
andon FEN dissolution
saturation level on
FEN dissolution was evident when FEN dissolution at 90 min was plotted against saturation level
(Seq). As displayed in Figure 5C, SLH prepared with FS, irrespective of type of lipid or % Seq, achieved
similar extent of dissolution (p > 0.05). In contrast, MPS stabilized SLH formulations displayedPharmaceutics 2020, 12, 687 13 of 22
was evident when FEN dissolution at 90 min was plotted against saturation level (Seq ). As displayed
in Figure 5C, SLH prepared with FS, irrespective of type of lipid or % Seq , achieved similar extent
of dissolution (p > 0.05). In contrast, MPS stabilized SLH formulations displayed significant linear
reduction in FEN dissolution with an increase in % Seq . The decrease in performance was more
profound for MPS PG8 formulations (R2 = 0.86) than MPS C300 formulations (R2 = 0.80); however, it
was not statistically significant (p > 0.05).
3.4. In Vitro Lipolysis and Aqueous Solubilization
3.4.1. Aqueous Solubilization
The partitioning of FEN between the aqueous phase and the pellet was measured over 90 min
during two-phase gastrointestinal lipolysis. The total percentage of FEN recovered ranged between 70
to 98% for all formulations (Figures S2 and S3). Difficulty in isolating the pellet and possible pellet loss
during the separation of the aqueous phase and pellet have contributed to having less than 100% total
recovered FEN. This issue has been previously reported and was attributed to either drug loss during
the separation process or inability to analyze drug retained in the undigested oil phase [28].
The aqueous concentration-time profiles of solubilized FEN during in vitro gastrointestinal
lipolysis are displayed in Figure 6A,B. Crystalline FEN displayed negligible solubilization during
the gastric phase, while achieving only 3.5% solubilization after complete intestinal lipolysis. For
APO-fenofibrate, once re-dispersed in simulated intestinal digesting media, 5% of total FEN was
immediately solubilized with no further changes in solubilization over the entirety of the lipolysis
period. The characteristic precipitation of FEN from LBFs caused difficulties in data interpretation and
distinguishing enabling formulations. However, the extent and occurrence of FEN precipitation was
influenced by the silica nanostructure, type of lipid and drug load evident in patterns observed from
the aqueous solubilization-time profiles and area under the intestinal solubilization-time curve (AUC)
reported in Figure 6. It is important to note that SLH formulations prepared at 400% and 600% Seq did
not improve FEN dissolution (Figure 5); therefore, these formulations were not pursued further in
aqueous solubilization studies.
When comparing solidified formulations to 80% liquid lipid, enhanced performance was observed
with 80% liquid PG8 during the gastric step, achieving the highest FEN solubilization of 25%, after
30 min (p < 0.05). Despite FEN precipitation during the intestinal phase between 1–5 min, FEN
solubilization gradually increased to reach 18%, after 90 min, which was significantly higher than all
SLH PG8 formulations (p < 0.05). However, 80% liquid C300 formulation displayed an enhanced FEN
aqueous solubilization profile during the intestinal phase compared to corresponding solidified 80%
FS C300 but lower performance than corresponding 80% MPS C300 (p < 0.05) (Figure 6A,C).
For FEN solubilization from SLH formulations prepared at 80% Seq , FEN precipitation was
triggered by the transition into the intestinal phase at time points ranging between 1–5 min and was
followed by a period of slightly enhanced solubilization prior to another decrease in solubilization
after 15 min. During the gastric step, 80% FS PG8, 80% MPS PG8, 80% FS C300, and 80% MPS C300
formulations displayed enhanced FEN solubilization of 15%, 16%, 19%, and 12.4%, after 30 min,
respectively (p > 0.05). This corresponds to 3.5- to 5-fold and 3- to 3.7-fold significantly enhanced
solubilization compared to crystalline FEN and APO-fenofibrate, respectively (p < 0.05) (Figure 6A,B).
Transition into the intestinal phase triggered FEN precipitation where the percentage FEN solubilized
decreased to 13% and 6.7% from 80% MPS PG8 and 80% MPS C300, respectively. However, a more
dramatic drop in FEN solubilization to 9% and 5.9% was observed from 80% FS PG8 and 80% FS C300
formulations, respectively, at 1 min of the intestinal phase. Furthermore, 80% MPS C300 was able to
gradually enhance FEN solubilization and prevent its precipitation, achieving 16% FEN solubilization,
after 90 min which was significantly greater than FEN solubilization achieved by corresponding 80%
FS C300 formulation (p < 0.05).Pharmaceutics2020,
Pharmaceutics 12, x687
2020, 12, FOR PEER REVIEW 14of
14 of22
22
Figure
Figure6.6.FENFEN aqueous
aqueousconcentration-time
concentration-time profiles fromfrom
profiles crystalline FEN, FEN,
crystalline APO-fenofibrate, and FEN-
APO-fenofibrate, and
loaded SLH formulations, in fasted state simulated gastric fluid (FaSSGF) (30 min)
FEN-loaded SLH formulations, in fasted state simulated gastric fluid (FaSSGF) (30 min) and fed stateand fed state
simulated
simulatedintestinal
intestinalfluid
fluid(FaSSIF)
(FaSSIF)(60
(60min)
min)under
underdigesting
digestingconditions,
conditions,dosed
dosedatat33mg
mgof ofFEN
FEN(mean
(mean
SD,nn==3).3).(A)(A)
±±SD, SLH
SLH C300
C300formulations
formulationsandand(B)(B)
SLH SLHPG8 formulations.
PG8 Dotted
formulations. line line
Dotted represents the
represents
the FEN
FEN Seqbiorelevant
Seq in in biorelevant media.
media. TheThe
areaarea under
under thethe curve
curve (AUC)
(AUC) ofofFEN
FENaqueous
aqueoussolubilization-time
solubilization-time
profile measured
profile measured during
duringthe
theintestinal
intestinalphase
phasefrom
from(C)(C)
crystalline FEN,
crystalline APO-fenofibrate,
FEN, and SLH
APO-fenofibrate, C300
and SLH
formulations
C300 and (D)
formulations andcrystalline FEN, FEN,
(D) crystalline APO-fenofibrate,
APO-fenofibrate,and SLH
and PG8
SLHformulations.
PG8 formulations.
In contrast,
In contrast, FEN
FEN solubilization
solubilization behavior
behavior from
from super-SLH
super-SLH (200%
(200% SSeq eq))was
wasdependent
dependenton onthe
thetype
type
of lipid
of lipid utilized,
utilized, where
where aa decrease
decreaseininFEN
FENsolubilization
solubilizationwas
wasattained
attainedininthe gastric
the phase
gastric phase forfor
200%
200%FS
PG8 and 200% MPS PG8 followed by enhanced solubilization in the intestinal
FS PG8 and 200% MPS PG8 followed by enhanced solubilization in the intestinal phase achieving phase achieving 15%
and 10%
15% and 10%solubilization, respectively
solubilization, (Figure
respectively 6C). FEN
(Figure 6C).solubilization was maintained
FEN solubilization at 4–5%atduring
was maintained 4–5%
the gastric
during phase by
the gastric 200%
phase by FS
200% C300
FS and
C300200% MPS C300
and 200% formulations
MPS C300 followed
formulations by enhanced
followed by enhancedFEN
solubilization in the intestinal phase, achieving 15.3% and 10.4%, after 5 min, respectively,
FEN solubilization in the intestinal phase, achieving 15.3% and 10.4%, after 5 min, respectively, prior prior to
FEN
to FEN precipitation
precipitationbybyonly 200%
only 200%FSFS
C300, at at
C300, 1515min, dropping
min, droppingFENFENsolubilization
solubilization to to
less than
less 10%.
than 10%.In
contrast, FEN solubilization from 200% MPS C300 gradually increased during the
In contrast, FEN solubilization from 200% MPS C300 gradually increased during the intestinal phase intestinal phase
achieving 12.7%, after 90 min. This corresponds to 3.6- and 2-fold enhanced solubilization compared
to crystalline FEN and APO-fenofibrate, respectively.Pharmaceutics 2020, 12, 687 15 of 22
Pharmaceutics 2020, 12, x FOR PEER REVIEW 15 of 22
achieving 12.7%, after 90 min. This corresponds to 3.6- and 2-fold enhanced solubilization compared
to crystalline FEN and APO-fenofibrate, respectively.
All SLH formulations achieved FEN solubilization above FEN equilibrium solubility in FaSSGF
All SLH formulations achieved FEN solubilization above FEN equilibrium solubility in FaSSGF
(1.1 ± 0.4 µg/mL) during the gastric phase and below its equilibrium solubility in FaSSIF during the
(1.1 ± 0.4 µg/mL) during the gastric phase and below its equilibrium solubility in FaSSIF during
intestinal phase (18.1 ± 0.8 µg/mL). Regardless of lipid type, a pattern of enhanced FEN solubilization
the intestinal phase (18.1 ± 0.8 µg/mL). Regardless of lipid type, a pattern of enhanced FEN solubilization
with increased drug load in FS formulations was clearly evident in data obtained from AUC of FEN
with increased drug load in FS formulations was clearly evident in data obtained from AUC of FEN
solubilization-time profile during the intestinal phase (Figure 6C,D), whereas a decrease in
solubilization-time profile during the intestinal phase (Figure 6C,D), whereas a decrease in performance
performance with supersaturation was observed for MPS formulations. It was evident that 80% MPS
with supersaturation was observed for MPS formulations. It was evident that 80% MPS C300 improved
C300 improved the aqueous solubilization of FEN when compared to the 80% liquid C300. In
the aqueous solubilization of FEN when compared to the 80% liquid C300. In contrast, for PG8
contrast, for PG8 formulations, the presence of both silica types reduced FEN aqueous solubilization
formulations, the presence of both silica types reduced FEN aqueous solubilization when compared to
when compared to 80% liquid PG8.
80% liquid PG8.
3.4.2.
3.4.2.Lipid
LipidDigestion
Digestion
The lipid digestion profiles during the intestinal phase of the gastrointestinal lipolysis of all
The lipid
investigated LBFdigestion profiles
are displayed during
in Figure 7. the intestinal
Crystalline FENphase
and of the gastrointestinal
APO-fenofibrate did notlipolysis
display ofanyall
investigated
lipid digestionLBF are displayed
as they in Figure
did not contain lipid7. Crystalline FEN and
(data not shown). APO-fenofibrate
The did not display
fabricated formulations any
differed
in their lipid content per dose, as dosing was based on the amount of formulation equivalent to 3 mgin
lipid digestion as they did not contain lipid (data not shown). The fabricated formulations differed
oftheir
FEN. lipid
Thecontent
amount perofdose,
lipidasdosed
dosingranged
was based from on19.5–48.7
the amount mgof(Table
formulation
S2). Theequivalent
80% liquidto 3 mg
PG8of
FEN. The amount of lipid dosed ranged from 19.5–48.7 mg (Table S2). The
formulation exhibited the lowest extent of digestion compared to its corresponding solidified SLH80% liquid PG8 formulation
exhibited the
formulation (FSlowest
or MPS).extent of digestion
In contrast, 80% compared
liquid C300todisplayed
its corresponding solidified
a slow gradual SLH in
increase formulation
lipolysis
(FS or MPS). In contrast, 80% liquid C300 displayed a slow gradual increase
over 60 min, but the final extent of lipolysis was lower than corresponding SLH formulations. in lipolysis over 60The
min,
amount of digestion decreased as a function of increasing drug load, since all 80% SLH formulationsof
but the final extent of lipolysis was lower than corresponding SLH formulations. The amount
digestion significantly
displayed decreased as higher
a function of increasing
extent of digestion drugwhen
load, compared
since all 80%to SLH
theirformulations
corresponding displayed
200%
significantly higher extent of digestion when compared to their corresponding
formulations, regardless of the type of lipid (p < 0.05). FA released from C300 SLH formulations were 200% formulations,
regardless
5-fold greaterofthan
the corresponding
type of lipid (p < 0.05).
SLH FA releasedregardless
PG8 formulations, from C300ofSLH formulations
the type of silica or were 5-fold
drug load.
Atgreater
the samethansaturation
corresponding SLHlipid
level and PG8type,
formulations, regardless
FS facilitated greater of the type
extent of silicawhen
of lipolysis or drug load. At
compared
to corresponding MPS formulations; however, the difference was not statistically significant (p >to
the same saturation level and lipid type, FS facilitated greater extent of lipolysis when compared
corresponding MPS formulations; however, the difference was not statistically significant (p > 0.05).
0.05).
Figure
Figure7.7.Fatty
Fattyacid
acid(FA)
(FA)release-time
release-timeprofile
profilefrom:
from:(A)
(A)C300
C300formulations
formulationsand
and(B) PG8
(B) PG8formulations,
formulations,
during the intestinal phase of in vitro gastrointestinal (GI) lipolysis in FaSSIF for 60 min,
during the intestinal phase of in vitro gastrointestinal (GI) lipolysis in FaSSIF for 60 min, dosed dosed
at at 3
3 mg
mg
of of
FENFEN (mean
(mean − SD,
− SD, n=n =3).3).
4.4.Discussion
Discussion
Numerousstudies
Numerous studieshave
haveshown
shownthat
thatsmall
smallchanges
changesininthe
thenanostructure,
nanostructure,surface
surfacechemistry
chemistryandand
composition of SLH particles can significantly impact lipid digestion dynamics, which in
composition of SLH particles can significantly impact lipid digestion dynamics, which in turn turn influences
drug solubilization
influences and releaseand
drug solubilization kinetics [23,40].
release Therefore,
kinetics [23,40].the aim here the
Therefore, wasaim
to examine
here wasthetoinfluence
examineof
the influence of (i) silica nanostructure, (ii) type of lipid, and (iii) drug load on the in vitro
solubilization and solid-state stability of the model drug FEN when incorporated into an SLH
formulation.Pharmaceutics 2020, 12, 687 16 of 22
(i) silica nanostructure, (ii) type of lipid, and (iii) drug load on the in vitro solubilization and solid-state
stability of the model drug FEN when incorporated into an SLH formulation.
It is well known that spray drying is amongst the techniques commonly employed to solidify
liquid-state LBFs and is recognized to generate highly porous three-dimensional nanostructured
matrices with superior physicochemical properties [14]. Here, spray drying was employed to generate
porous silica microparticles (FS) from precursor fumed silica nanoparticles suspensions, prior to
drug/lipid encapsulation via adapting the simple mixing technique [29]. Supersaturation was achieved
by adding drug above its equilibrium saturation level in either of two lipids (PG8 or C300) using heat
(≤60 ◦ C) [29]. The generated, thermodynamically unstable, supersaturated liquid lipids were adsorbed
into the nanopores or onto the surface of FS or MPS to allow for direct comparison.
4.1. Impact of Drug Loading
All synthesized formulations were found to be homogeneous and achieved high FEN loading
efficiency regardless of the type of silica or lipid. Thus, this validates the efficiency of the simple mixing
technique in minimizing drug/lipid loss during the fabrication process. The small amount of drug loss
(Pharmaceutics 2020, 12, 687 17 of 22
super-SLH containing IBU and AbA displayed an increased amount of crystalline drug with increase
in drug loading and optimum drug loading, which was 227% for IBU and 150% for AbA [28,31].
During in vitro dissolution studies (Figure 5), unsaturated (at 80% Seq ) MPS and FS formulations
had a comparable performance, regardless type of lipid used. In contrast, both the rate and extent of
dissolution from super-SLH (200%, 400%, and 600% Seq ) were significantly enhanced when using FS
compared to corresponding MPS formulations. At higher saturation levels (400% and 600% Seq), it was
evident that FS was able to maintain excellent FEN dissolution despite the presence of “crystalline” FEN
and less amount of lipid in the formulations. However, the relatively larger amount of crystalline FEN
present at 600% FS PG8 and 600% FS C300 resulted in slower release kinetics. In contrast, a reduction
in dissolution performance was observed by MPS formulations with an increase in drug load. These
findings were consistent with data obtained from FEN aqueous solubilization during in vitro lipolysis,
despite the complexity of the data generated due to FEN precipitation.
FEN is a commonly used model PWSD in LBFs, and its tendency to precipitate from LBFs has been
previously reported in multiple studies [11,41–43]. In these studies, authors proposed that, as digestion
proceeds, formulations lose their solubilization capacity along with dilution of formulation triggered
by the transition into intestinal digestion, where FEN precipitates with increasing FA concentration [41].
However, in these studies, FEN precipitation during in vitro lipolysis did not correlate with poor in vivo
performance. Thomas et al. observed more extensive in vitro FEN precipitation from supersaturated
self-nanoemulsifying drug delivery systems (super-SNNEDS) than from unsaturated SNEDDS [11].
Nevertheless, all SNEDDS formulations displayed enhanced in vivo bioavailability. FEN was shown
to precipitate in a crystalline form in vitro but the extent of FEN precipitation in vitro was not known.
These studies indicate that in vitro lipolysis models are not predictive of in vitro performance of FEN
in a LBFs and should be used carefully to interpret such data [42].
In a previous study, in order to understand the underlying mechanism of FEN absorption
and possible precipitation in vivo, orlistat as a lipase inhibitor was co-administered with SNEDDS
containing FEN [43]. The study showed that lipase inhibition did not influence FEN bioavailability
from SNEDDS, therefore digestion does not impact FEN absorption but can be beneficial when FEN
is present in crystalline form in the formulation. However, it was still not known whether FEN
precipitation occurs in vivo and to what extent. Recently, Tanaka et al. [44] found that FEN precipitated
in the stomach of rats in an amorphous form with 20% microemulsion (ME) and crystalline form with
90% ME. In both cases, rapid redissolution was attained in the duodenum and 90% ME achieved
significantly enhanced bioavailability. It is important to note that precipitation was more pronounced in
the closed in vitro lipolysis system, which implies the importance of adding an absorption mimicking
step [45]. The authors concluded that precipitation from the supersaturated state in the gastrointestinal
environment was suppressed by the rapid absorption process for a highly permeable drug, like FEN,
creating an absorption sink that acts as a driving force for absorption. In addition, the authors suggested
the possibility of enhanced solubilization capacity of GI fluid caused by the formation of colloidal
species upon digestion of the lipid. Therefore, formulations that cause higher supersaturation in the GI
fluid [46] and the inclusion of medium chain triglycerides might result in enhanced bioavailability,
despite their tendency to precipitate in vitro. However, such conclusions cannot be made for this study
as further in vitro studies are required to validate the full potential of the fabricated SLH formulations.
In the present study, a higher extent of lipid digestion, as reflected in FA release, correlated with
more pronounced FEN precipitation. This was evidenced by the 80% liquid PG8 formulation exerting
the greatest FEN solubilization but reduced FA release. Liquid lipid formulations investigated in
this study formed large emulsion droplets during in vitro lipolysis, providing less surface area for
lipase action. However, when lipid was internalized within a porous silica matrix, a high surface
area for lipase-mediated digestion was provided [40], which led to a more pronounced FA release
and subsequent FEN precipitation. In the case of SLH prepared by FS, supersaturation resulted in
enhanced FEN solubilization. In contrast, SLH prepared with MPS achieved the best performance when
unsaturated. This was in agreement with solubilization data and previous studies where AbA-loadedPharmaceutics 2020, 12, 687 18 of 22
super-SLH (prepared with MPS) compromised its solubilization performance during lipolysis when
compared to unsaturated SLH [25]. However, this was not the case for IBU (dissolution studies),
which implies
Pharmaceutics 2020, that
12, xthe
FORbenefits of super-SLH are drug dependent and require further investigation
PEER REVIEW 18 of 22
and optimization.
Thedifference
The differencein inperformance
performance achieved
achieved by FS and MPS formulations
formulations can canbe
beattributed
attributedtototheir
their
uniquestructure
unique structureand andresulting
resulting dynamic
dynamic microenvironment
microenvironment when when re-dispersed
re-dispersed in
inbiorelevant
biorelevantmediamedia
(Figure8).
(Figure 8).ItItisishypothesized
hypothesizedthat thatSLH
SLHmicroparticles
microparticlesprepared
preparedwithwithFSFSde-aggregate
de-aggregateandanddissociate
dissociateto
to their
their precursor
precursor silica
silica nanoparticles
nanoparticles upon
upon dispersion
dispersion in aqueous
in aqueous media,
media, providing
providing high
high surface
surface area
area for
for lipase
lipase mediated
mediated digestion,
digestion, dynamic
dynamic mixedmixed micelle
micelle formation,
formation, and subsequent
and subsequent drugdrug release.
release. For
For FEN,
FEN,
this this results
results in a more in a more profound
profound precipitation
precipitation inclosed
in the the closed in vitro
in vitro digestion
digestion model,
model, which
which lacks
lacks an
an absorption step. In contrast, FEN-loaded lipid droplets need to diffuse out
absorption step. In contrast, FEN-loaded lipid droplets need to diffuse out of the 6 nm [29] structured of the 6 nm [29]
structuredofnanopores
nanopores of the MPS
the MPS particles. Thisparticles.
slows theThis slows
kinetics ofthe kineticsrelease,
lipid/drug of lipid/drug release,
hindering hindering
lipolysis, which
inlipolysis,
turn leadswhichto lessin pronounced
turn leads toFEN
less precipitation.
pronounced FEN precipitation.
In addition, In addition, MPS
MPS formulations were formulations
aggregated at
were
all FENaggregated
saturation levels,at all FEN saturation
suggesting poorlevels, suggesting poor
lipid encapsulation lipid
which encapsulation
further reduced thewhich further
surface area
reduced for
available the lipase
surfaceaction.
area available for lipase action.
Figure8.8.AAschematic
Figure schematic representation
representation of
of the
the proposed mechanism of
proposed mechanism of FEN
FEN release
release and
and precipitation
precipitation
from SLH made with FS and MPS, during in vitro lipolysis. Created with BioRender.com.
from SLH made with FS and MPS, during in vitro lipolysis. Created with BioRender.com.
4.3. Impact of Lipid Type
4.3. Impact of Lipid Type
FEN precipitation from SLH formulations occurred either during the gastric phase or during
FEN precipitation from SLH formulations occurred either during the gastric phase or during the
the intestinal phase depending on drug load and type of lipid used. Unlike dissolution, this made
intestinal phase depending on drug load and type of lipid used. Unlike dissolution, this made
discrimination between formulations challenging. However, data generated display the benefits
discrimination between formulations challenging. However, data generated display the benefits
provided by super-SLH evident in the enhanced performance of all SLH formulations when compared
provided by super-SLH evident in the enhanced performance of all SLH formulations when
to crystalline drug and APO-fenofibrate.
compared to crystalline drug and APO-fenofibrate.
Lipids utilized in this study differ in their chemical composition and the physical interaction
Lipids utilized in this study differ in their chemical composition and the physical interaction
when imbibed into the silica nanopores. PG8 consists of propylene glycol (PG) mono (>90%)-
when imbibed into the silica nanopores. PG8 consists of propylene glycol (PG) mono (> 90%)- and di
and di (You can also read