HAWKE'S BAY 3rd edition P.R. Chappell - Hawke's Bay Regional Council
←
→
Page content transcription
If your browser does not render page correctly, please read the page content below
THE CLIMATE AND WEATHER OF

HAWKE’S BAY
3rd edition        P.R. Chappell
© All rights reserved. The copyright for this report, and for the data, maps, figures and other information
(hereafter collectively referred to as “data”) contained in it, is held by NIWA. This copyright extends to all forms
of copying and any storage of material in any kind of information retrieval system.

While NIWA uses all reasonable endeavours to ensure the accuracy of the data, NIWA does not guarantee or
make any representation or warranty (express or implied) regarding the accuracy or completeness of the data,
the use to which the data may be put or the results to be obtained from the use of the data. Accordingly, NIWA
expressly disclaims all legal liability whatsoever arising from, or connected to, the use of, reference to, reliance
on or possession of the data or the existence of errors therein. NIWA recommends that users exercise their own
skill and care with respect to their use of the data and that they obtain independent professional advice relevant
to their particular circumstances.

NIWA SCIENCE AND TECHNOLOGY SERIES
NUMBER 58

ISSN 1173-0382

Note to Third Edition
This publication replaces the second edition of the New Zealand Meteorological Service Miscellaneous
Publication 115 (5), written in 1987 by C.S. Thompson. It was considered necessary to update the second edition,
incorporating more recent data and updated methods of climatological variable calculation.
THE CLIMATE AND WEATHER OF
HAWKE’S BAY
3rd edition          P.R. Chappell
CONTENTS
SUMMARY                                       6

INTRODUCTION                                   7

TYPICAL WEATHER SITUATIONS IN HAWKE’S BAY     9

CLIMATIC ELEMENTS                             15
   Wind                                       15
   Rainfall                                   18
     Rainfall distribution                    18
     Rainfall frequency and intensity         21
     Recent extreme events in Hawke’s Bay     22
     Periods of low rainfall                  23
   Temperature                                24
     Sea surface temperature                  24
     Air temperature                          24
     Earth Temperatures                       27
     Frosts                                   28
   Sunshine and Solar Radiation               29
     Sunshine                                 29
     Solar radiation                          30
     UV (Ultra-violet radiation)              30
   Fog                                        31
   Severe convective storms                   31
     Thunderstorms                            31
     Hail                                     31
     Tornadoes                                31
     Snow                                     32
   Sea swell and waves                        32

DERIVED CLIMATOLOGICAL PARAMETERS             35
  Vapour pressure and relative humidity       35
  Evapotranspiration and soil water balance   36
  Drought in Hawke’s Bay                      38
  Degree-day totals                           39

ACKNOWLEDGEMENTS                              42

REFERENCES                                    42

                                                   4
SUMMARY
    The climate of Hawke’s Bay is influenced largely by the
    orography and the airstreams crossing New Zealand.
    It is a region of highly variable and sporadic rainfall,
    and large and occasionally sudden temperature
    variations. Hawke’s Bay is a sunny region with most
    areas having over 2000 hours per year.

    Hawke’s Bay is less windy than many other coastal
    areas of New Zealand, experiencing a high frequency
    of very light winds. Consequently, a large number of
    frosts occur during the cooler months of the year.
    Much of the rain in Hawke’s Bay occurs when the wind
    directions are predominantly easterly or southerly.
    Rainfall is extremely variable in spring and summer
    when westerly winds prevail over the country. In most
    years insufficient rainfall (dry spells) results in a total
    depletion of soil moisture to the extent that plant
    growth ceases. The high country areas of Hawke’s Bay
    are exposed and gales occur frequently. Showers of
    snow are frequent during the winter months in cold
    southerly conditions.

5
INTRODUCTION
Hawke’s Bay is situated on the eastern
side of the North Island of New Zealand
and derives its name from the large
semi-circular Hawke Bay. Hawke’s Bay
extends from Cape Turnagain in the south
to Mahia Peninsula in the northeast. In
this publication Hawke’s Bay is defined
as the area shown in Figure 1, which is
the region administered by Hawke’s Bay
Regional Council. Apart from the relatively
flat Heretaunga Plains in which lie the
principal urban areas of Napier and
Hastings, and an inland plain (Takapau)
to its southwest, most of Hawke’s Bay is
rolling hill country bounded on the west
by the Huiarau, Kaweka, and Ruahine
Ranges. The region also includes part of
Waikaremoana National Park, in the north
of the region.

Agriculture is the predominant economic
activity of the region. This is mostly
intensive sheep and beef farming along
with viticulture, market gardening,
orcharding, and the processing of
horticultural cash crops.

All numbers given in the following tables
are calculated from the 1981-2010
normal period (a normal is an average or
                                              Figure 1. Map of Hawke’s Bay region, with locations of places mentioned in
estimated average over a standard 30-year     the text, tables, and figures.
period), unless otherwise stated.

                                                                                                                           7
8
TYPICAL WEATHER
SITUATIONS IN
HAWKE’S BAY
A feature of the atmospheric circulation
in the New Zealand region is the absence
of semi-permanent anticyclones. Daily
weather maps show a sequence of
eastward-moving anticyclones, separated
by troughs of low pressure or depressions.
These large-scale synoptic features
determine the broad climatic features in
Hawke’s Bay. The weather experienced in
this region is influenced to a large extent           Figure 2. Mean sea level pressure analysis for 0000 hours on 29 April 1986.
by the mountain ranges in the west. When
westerly winds blow across the region, the
high country shelters the rest of Hawke’s
Bay and can result in high temperatures
with dry conditions. In southerly and
easterly situations the high country
enhances precipitation as air masses
are forced to ascend over the ranges. In
extreme conditions heavy rain can lead to
major flooding on the plains.

West to northwest airstreams
It is quite common in strong west or
northwest airstreams for showers to fall
on the western ranges while the rest of
                                                      Figure 3. Mean sea level pressure analysis for 0000 hours on 3 October 1986.

                                                                                 Hawke’s Bay experiences dry mild windy
                                                                                 conditions. However, in situations where
                                                                                 eastward-moving cold fronts are present
                                                                                 between two anticyclones (Figure 2), brief
                                                                                 periods of rain occur as the front crosses
                                                                                 the region. The duration can vary from less
                                                                                 than one hour to over six hours depending
                                                                                 on the speed of the front. The amount of
                                                                                 rainfall may also vary, from under 5 mm
                                                                                 to over 20 mm depending on the intensity
                                                                                 of the front. On most occasions, a rapid
                                                                                 clearance follows and the wind will blow

Figure 4. Mean sea level pressure analysis for 0000 hours on 9 June 1982.

                                                                                                                                     9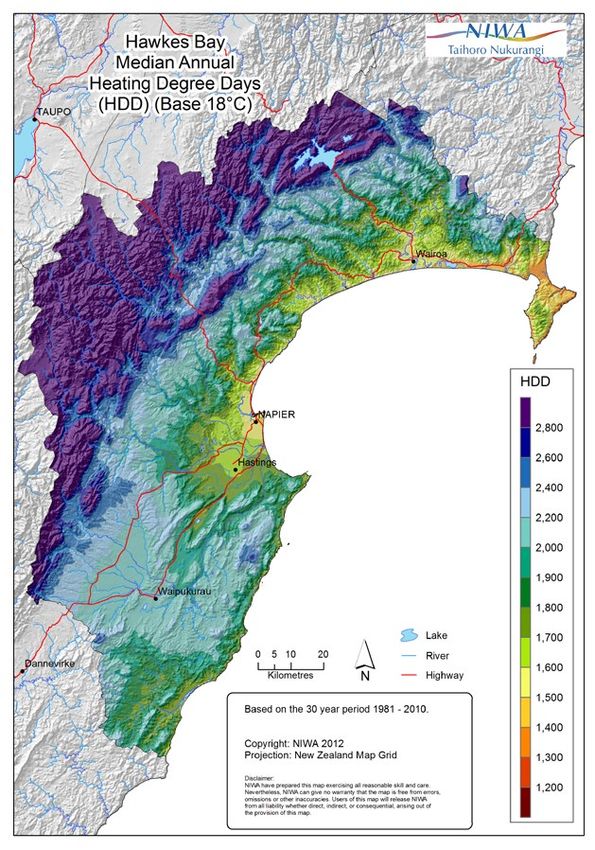
from the westerly quarter. If the wind
     continues to blow southerly due to rising
     pressures over the east coast of the South
     Island, skies will become cloudy again
     accompanied by further rain and a large
     drop in temperature.

     Figure 2 illustrates a situation where
     a strong northwest airstream lies over
     the North Island ahead of a weak cold
     front. The front crossed Hawke’s Bay
     mid-morning on 29 April 1986, and was
     accompanied by scattered falls of rain
     which lasted no more than five hours.
     Many areas of the region recorded less
                                                    Figure 5. Mean sea level pressure analysis at 1200 hours on 2 July 1986.
     than 5 mm, except further southwest
     outside the region where up to 10 mm fell.
     A southerly wind change accompanied the
     front but had died out by the middle of the
     afternoon as sea level pressures began to
     fall over the South Island ahead of the next
     cold front approaching Southland.

     Westerly airstreams (Figure 3) may
     persist for several days, with orographic
     showers to the west of the main divide
     and continuing dry mild conditions in the
     east. Cloud above the Hawke’s Bay and
     Wairarapa regions during these airstreams
     is generated by the forced ascent of the
     strong westerlies by the ranges.

                                                    Figure 6. Mean sea level pressure analysis at 0000 hours on 22 July 1985.
     South to southwest airstreams
     When anticyclones or ridges of high
     pressure cover much of the Tasman Sea
     and pressures are low to the east of New
     Zealand, a southwest airstream tends to
     cover the country. This type of situation,
     although found all year round, is most
     common during winter and spring. Such
     occurrences usually last from one to three
     days, rarely longer. When an anticyclone
     is centred over southern New Zealand,
     a cold southerly airstream will flow over
     the North Island with showers from
     Cook Strait to East Cape. Southwesterly
     airstreams are associated with frequent
     showers, but if the surface wind flow
                                                    Figure 7. Mean sea level pressure analysis at 0000 hours on 21 June 1986.

10
is roughly parallel to the axis of New
Zealand, Hawke’s Bay will experience
fine cool weather. Such a situation is
illustrated in Figure 4. In these situations,
it is common that the Tasman Sea
and the oceans east of New Zealand
are extensively covered by open celled
cumulus cloud, but most of the North
Island is cloud free being in the shadow of
the South Island.
East to southeast airstreams
In Hawke’s Bay, east to southeast
airstreams are associated with a Figure 8a. Tropical cyclones which made landfall in New Zealand during
December, 1970-2010. Source: Southwest Pacific Enhanced Archive of
depression over or to the east of the Tropical Cyclones (SPEArTC; Diamond et al., 2012).
North Island and an area of high
pressure to the south of the country.
Frequently the depressions form either
in the Tasman Sea or in the tropics and
then move southeast towards the North
Island. Strong east or southeast winds
blow across Hawke’s Bay, and if any
accompanying frontal zones become slow-
moving heavy rain is likely. Two examples
of this type of situation with strong winds
and heavy rain are given in Figures 5 and
6. In both situations, many lowland areas
measured over 25 mm of rain, and up to
75-90 mm in the mountainous regions.
Gale force winds were also observed at Figure 8b. Tropical cyclones which made landfall in New Zealand during
January, 1970-2010. Source: SPEArTC (Diamond et al., 2012).
Napier on 2 July 1986.
North to northeast airstreams
North to northeast airstreams are
characterised by relatively mild and
humid air masses which flow between
a large anticyclone to the east of New
Zealand and a low pressure area to the
west. These situations may be slow
moving when the anticyclone blocks the
movement of the low pressure trough.
For depressions moving southwards in
the Tasman Sea, little rain falls on the
eastern side of the main ranges. However,
if the front is particularly active, rain falls
Figure 8c. Tropical cyclones which made landfall in New Zealand during
both in the flow ahead of the front and
February, 1970-2010. Source: SPEArTC (Diamond et al., 2012).
also with the front.
11On 21 June 1986 (Figure 7) fresh to strong
northeasterly winds and widespread light
rain were observed in Hawke’s Bay. An
active frontal zone to the west of New
Zealand crossed the North Island late
in the day. It was followed by light west-
north-west winds and a rapid clearance of
cloud. An extensive area of low stratiform
cloud was present over the seas to the
east of the North Island. This phenomenon
is a feature of such situations when mild
humid air masses of subtropical origin
are cooled by a cold sea, thus allowing the
formation of stratiform cloud.
Figure 8d. Tropical cyclones which made landfall in New Zealand during
March, 1970-2010. Source: SPEArTC (Diamond et al., 2012).
Cyclones of tropical origin
The tropical cyclone season in the
southern hemisphere lasts from
November to April. Originating in low
latitudes within the cloud masses of
the South Pacific Convergence Zone,
tropical cyclones reaching northern New
Zealand and still retaining true cyclonic
characteristics, such as a warm core, are
extremely rare. They are nevertheless
accompanied by heavy rain and strong
winds. Tracks of tropical cyclones which
have made landfall in New Zealand
between 1970 and 2010 are shown in
Figure 8a-e. The passage of ex-tropical Figure 8e. Tropical cyclones which made landfall in New Zealand during April,
cyclone Giselle directly over Napier 1970-2010. Source: SPEArTC (Diamond et al., 2012).
during the early hours of 10 April 1968
caused considerable damage to trees and
buildings in Napier and Hastings. It was
during this storm that the inter-island
ferry Wahine sank in the entrance to
Wellington harbour.
1213
CLIMATIC ELEMENTS
                                                             Takapau Plains AWS                          Waipawa EWS
Wind

The prevailing winds over New Zealand in
the zone directly above the earth’s surface
are westerly, and they influence the general
precipitation and temperature regimes of
Hawke’s Bay. Local winds in Hawke’s Bay
are largely influenced by the orography, and
the region is less windy than many other
coastal areas of New Zealand. Sheltering
effects by the western ranges results in a
                                                                   Napier Aero                           Mahia AWS
high frequency of calm or very light winds.
This effect is most pronounced at night-
time and in winter under clear weather
conditions. Havelock North, with its many
orchards surrounded by tall shelter belts,
has calm conditions most of the time.
Throughout the region there is a tendency
for the wind to be channelled along river
valleys. Over central and southern Hawke’s
Bay the predominant directions are from
the west or southwest along the Heretaunga                         Whakatu EWS
and Takapau Plains. In the north the wind
tends to blow most frequently from the north
or northwest. Figure 9 shows mean annual
wind frequencies of surface wind based on
hourly observations from selected stations.
Exposed sites such as Mahia have a higher
percentage of strong winds than more
sheltered sites, such as Whakatu.

Mean wind speed data (average wind
speeds are taken over the 10 minute period
                                                      Figure 9. Mean annual wind frequencies (%) of surface wind directions from
preceding each hour) are available for
                                                      hourly observations at selected Hawke’s Bay stations. The plots show the
several sites in Hawke’s Bay, and these               directions from which the wind blows, e.g. the dominant wind direction on
illustrate the several different wind regimes         the Takapau Plains is from the southwest.
of the region (Table 1). Mahia, which is
located on an exposed peninsula, is much
windier throughout the year compared with
Napier, which is located in the Hawke Bay
embayment.

   Table 1. Mean monthly/annual wind speeds (km/hr) for Hawke’s Bay sites, from all available data.
    Location                   Jan    Feb    Mar     Apr    May      Jun    Jul    Aug    Sep     Oct    Nov    Dec    Ann
    Mahia AWS                 16.7    16.7   16.9    16.5   16.7     18.5   18.2   18.3   17.5    19.1   19.0   17.8   17.6
    Napier Aero AWS           14.2    13.7   13.4    11.6   12.2     13.0   13.1   13.6   13.5    15.9   16.0   15.2   13.8
    Whakatu EWS               10.8    11.7   10.7    9.2     9.8     11.1   10.8   11.7   11.6    13.0   12.5   11.9   11.2

                                                                                                                                   15
In contrast, lighter winds are experienced Table 2. Seasonal percentages of strong or light winds (%) for Hawke’s Bay
at Whakatu, which is located slightly sites, from all available data.
further inland, south of Napier. Note that Location Summer Autumn Winter Spring
other sites in the region do not have the Strong 19 22 28 30
Mahia AWS
minimum data requirements of 10 years of Light 26 25 24 24
monthly data, to be able to be included in Napier Aero Strong 23 17 26 34
this table, hence data for only three sites AWS Light 23 25 27 25
are presented. Strong 21 14 21 44
Whakatu EWS
Light 26 24 24 25
Spring is generally the windiest season
throughout the region. Because of the
relatively high frequency of light winds
in lowland regions there is only a small
seasonal variation, although winter and
spring tend to be windier than other times
of the year. Table 2 gives the seasonal
proportion of strong and light winds as
a percentage of the annual total. For
example, of all strong winds recorded at
Napier, 23% occurred in summer, 17% in
autumn, 26% in winter and 34% in spring.
In compiling this table a strong wind was
defined as having a mean wind speed of at
least 31 km/hr.
When pressure gradients are weak, well
developed onshore sea breezes blow
during the daytime in all seasons except Figure 10. Mean sea level pressure analysis at 1200 on 31 January 1986.
winter. Sea breezes develop as a result of
large temperature gradients between the
land and sea. At times, especially during
summer, the sea breeze at Hawke’s Bay
can penetrate inland for considerable
distances up the Heretaunga and Takapau
Plains. A sea breeze situation in Hawke’s
Bay is given in Figure 10 for noon on 31
January 1986. A sea breeze of 11 km/hr
from the east had started at Napier Airport
by 10 am. With clear skies and warm
afternoon temperatures inland, the sea
breeze blew all day reaching 37 km/hr from
the north-east at 4 pm before moderating
and dying out just before 11 pm.
16Diurnal variation in wind speed is well- Table 3. Average wind speed (km/hr) for selected hours.
marked, with greatest wind speeds Location 00 03 06 09 12 15 18 21
occurring in the early part of the Mahia AWS 16 16 16 18 20 20 18 17
afternoon. This is because at that time of Napier Aero AWS 11 11 11 13 18 19 15 12
day heating of the land surface is most Whakatu EWS 9 8 8 11 15 17 13 9
intense and stronger winds aloft are
brought down to ground level by turbulent
mixing. Cooling at night generally restores
a lighter wind regime. Table 3 gives
average wind speeds at three-hourly
intervals for selected stations. Table 4. Average number of days per year with gusts exceeding 63 km/hr
and 96 km/hr for selected stations.
High winds over 55 km/hr are relatively Gusts Gusts
rare in many lowland areas, but are Location
>63 km/hr >96 km/hr
much more frequent in the mountain Mahia AWS 73 3
ranges and about exposed coasts such Napier Aero AWS 48 1
as Cape Kidnappers and the Mahia Whakatu EWS 26 0.3
Peninsula. Such winds are recorded
mostly from directions between northwest
and southwest. Gusts of at least 63 km/
hr are recorded at Napier on about 48
days each year, mostly from the west or
northwest, and gusts over 96 km/hr occur Table 5. Highest ever recorded gusts at selected Hawke’s Bay stations, from
on average one day each year (Table 4). all available data.
In comparison, the more exposed site at Location Gust (km/hr) Direction (°) Date
Mahia experiences higher numbers of gust Mahia AWS 147 W 15/07/1998
days, and Whakatu records fewer gust Napier Aero AWS 105 W 22/10/1998
days than Napier. Whakatu EWS 101 WNW 13/12/2002
In the mountain ranges of Hawke’s Bay,
high winds may occur for about 15% of
the time. In strong pressure gradients,
gales (i.e. mean speeds in excess of 63
km/hr) may blow for several days on end.
During the periods when strong west or
northwest airstreams flow across the
North Island ranges, the strong turbulent
winds descend to low levels and produce
warm gusty and dry foehn winds.
Although gale force winds can occur in any
month, they are most frequent in winter.
The highest gust recorded in the region
was 147 km/hr at Mahia on 15 July 1998.
Maximum gusts recorded at different
stations in the region are listed in Table 5.
17Rainfall
Rainfall distribution
Rainfall patterns in the region are closely
related to elevation, and exposure to
the predominant air flows (westerly,
southwesterly, and northeasterly). The
distribution of the Hawke’s Bay region’s
median annual rainfall is shown in Figure
11. Areas with high annual rainfall over
2000 mm (Ruahine, Kaweka, and Huiarau
Ranges) provide a stark contrast to areas
which receive around less than 800 mm of
rain per year, that is the area just north of
Napier to south of Waipukurau, including
the Heretaunga and Takapau Plains.
Meteorological systems bringing rain to
Hawke’s Bay are irregular, causing high
rainfall variability both in time and space.
Nearly all the rain is associated with cold
fronts, and falls as showers of relatively
short duration. Over 60% of the rainfall at
Napier occurs when the wind is from the
south or southeast, although some of the
most intense falls are usually associated
with northeast or easterly airstreams. In
a study on rainfall and wind direction in
Hawke’s Bay, Coulter (1962) found that at
all locations rainfall on the lowland areas Figure 11. Hawke’s Bay median annual total rainfall, 1981-2010.
was reduced in westerly-quarter winds
because of sheltering by the ranges.
Table 6. Monthly/annual rainfall normals (a; mm) and percentage of annual total for each month (b; %).
Location Jan Feb Mar Apr May Jun Jul Aug Sep Oct Nov Dec Ann
62 79 83 88 96 115 121 99 77 80 63 51 1015
Aramoana
6 8 8 9 9 11 12 10 8 8 6 5
79 114 120 107 96 102 141 101 110 104 115 86 1274
Ashley Clinton
6 9 9 8 8 8 11 8 9 8 9 7
68 94 112 94 78 82 121 81 100 77 98 71 1074
Blackburn
6 9 10 9 7 8 11 8 9 7 9 7
73 81 85 85 74 94 130 76 76 79 70 75 998
Gwavas
7 8 8 9 7 9 13 8 8 8 7 8
97 114 125 103 94 88 147 91 102 91 113 115 1279
Kaweka Forest
8 9 10 8 7 7 11 7 8 7 9 9
98 109 107 111 107 120 157 112 120 113 107 111 1370
Makaretu North
7 8 8 8 8 9 11 8 9 8 8 8
71 71 194 100 133 123 148 126 157 103 68 71 1365
Mohaka Forest
5 5 14 7 10 9 11 9 11 8 5 5
18Location Jan Feb Mar Apr May Jun Jul Aug Sep Oct Nov Dec Ann
67 61 50 79 76 90 112 54 49 71 56 59 823
Napier Aero AWS
8 7 6 10 9 11 14 7 6 9 7 7
47 54 67 68 75 82 109 61 58 60 52 54 786
Napier Nelson Pk
6 7 8 9 10 10 14 8 7 8 7 7
46 55 59 59 57 72 96 54 50 52 48 59 707
Ngatarawa
6 8 8 8 8 10 14 8 7 7 7 8
67 70 73 75 69 83 108 68 67 70 63 67 879
Ongaonga
8 8 8 8 8 9 12 8 8 8 7 8
81 122 179 115 105 111 185 108 105 114 113 83 1421
Rukumoana 2
6 9 13 8 7 8 13 8 7 8 8 6
62 77 176 137 83 92 148 103 103 97 59 76 1213
Tangoio
5 6 14 11 7 8 12 9 9 8 5 6
53 106 157 159 156 142 134 106 129 83 121 55 1402
Tuhara Valley
4 8 11 11 11 10 10 8 9 6 9 4
96 84 165 117 99 103 171 113 118 71 96 72 1304
Tutira
7 6 13 9 8 8 13 9 9 5 7 6
80 94 114 128 122 123 134 99 89 89 76 69 1216
Wairoa, North Clyde EWS
7 8 9 11 10 10 11 8 7 7 6 6
91 97 101 89 86 99 139 85 82 85 79 94 1124
Waiwhare
8 9 9 8 8 9 12 8 7 8 7 8
Mahia AWS Napier Nelson Park
300
300
Rainfall (mm)
Rainfall (mm)
200
200
100
100
0
0
J F M A M J J A S O N D J F M A M J J A S O N D
W
Ongaonga Wairoa, Waiputaputa Station
0 200 400 600 800
300
Rainfall (mm)
Rainfall (mm)
200
100
0
J F M A M J J A S O N D J F M A M J J A S O N D
Figure 12. Monthly variation in rainfall for selected Hawke’s Bay stations.
Highest Monthly Total
Seasonal influences on rainfall distribution are also
90 Percentile Value
quite well defined. Table 6 lists monthly rainfall normals
and percentage of annual total for selected stations.
This table shows a clearly defined winter rainfall
maximum. The proportion of annual rainfall that is Mean
recorded in the winter months from June to August is
fairly consistent across the Hawke’s Bay region at 29%,
but the proportion of rainfall recorded in the summer 10 Percentile Value
months from December to February ranges from 15% Lowest Monthly Total
19at Tuhara Valley to 26% at Kaweka Forest. Throughout values show the accumulated rainfalls that will
Hawke’s Bay there is a seasonal variation with a winter normally be exceeded in nine out of ten years, while the
maximum and a spring or early summer minimum. In 90th percentile values indicate the accumulated falls
spring and summer westerlies tend to predominate, and that will normally be exceeded in only one year in ten.
consequently the winds are warm and dry. The table includes periods from one month to twelve
months; each period over one month begins with the
The distribution of monthly rainfall is shown in Figure
month stated. For example, using the table for Napier,
12. The 10th percentile, 90th percentile, and mean
for three months it can be seen that in the three month
rainfall values for each month are shown along with
period beginning in April, 92 mm or more of rainfall can
maximum and minimum recorded values for several
be expected in nine years in ten, while a total of 342 mm
stations.
or more should occur in only one year in ten.
Rainfall variability over longer periods is indicated by
rainfall deciles, as given in Table 7. The 10th percentile
Table 7. Rainfall deciles for consecutive months.
Jan Feb Mar Apr May Jun Jul Aug Sep Oct Nov Dec
Napier Nelson Park
1 month
10th 12 8 9 24 24 25 42 18 18 9 16 6
90th 117 109 148 147 174 157 211 121 133 151 103 112
3 months
10th 75 60 77 92 117 132 126 73 85 87 64 50
90th 290 289 344 342 394 388 329 272 283 263 266 266
6 months
10th 213 286 286 299 282 297 265 172 208 171 180 218
90th 570 596 633 602 651 585 506 510 509 448 469 518
12 months
10th 548 576 559 523 554 611 555 570 533 512 528 507
90th 997 986 949 973 992 1034 1001 955 992 988 1012 973
Ongaonga
1 month
10th 19 12 11 18 28 39 35 15 22 23 24 14
90th 159 151 158 193 108 146 196 129 162 142 127 116
3 months
10th 82 85 104 137 141 172 137 87 120 130 98 98
90th 340 383 377 339 363 366 338 329 317 306 319 325
6 months
10th 281 345 341 345 293 353 320 265 265 243 248 269
90th 586 620 609 591 639 577 545 594 648 601 583 563
12 months
10th 666 704 650 685 701 665 639 674 680 664 691 682
90th 1030 1032 1122 1083 1076 1051 1053 1077 1052 1068 1037 1016
Wairoa, North Clyde EWS
1 month
10th 32 23 18 47 32 54 73 24 23 14 20 14
90th 254 204 242 250 225 214 197 209 170 264 176 162
3 months
10th 118 151 103 207 252 215 161 149 118 148 82 76
90th 516 527 514 526 540 610 543 535 492 439 368 409
6 months
10th 446 506 494 461 471 442 366 252 312 287 153 148
90th 960 970 1006 957 1059 1020 867 828 891 865 898 893
12 months
10th 944 893 917 907 992 991 1041 938 - 785 1051 1004
90th 1779 1691 1681 1724 1714 1591 1560 1605 - 1769 1853 1855
20Rainfall frequency and intensity
North). The 0.1 mm rain days and 1 mm wet days show
Rain day frequency increases towards the high country, similar geographic variability. Table 8 lists the average
with over 160 days in the foothills of the ranges. number of days per month with 0.1 mm and 1 mm of
The frequency of rain days is greatest during winter rain for selected stations.
months (about 30% of total) and least in summer (20%
Heavy rainfalls can occur in Hawke’s Bay with
of total). Rain is frequently heavier and more intense
southerly and easterly flows, as well as when ex-
in the high country than elsewhere. Napier receives
tropical depressions pass near the region. Intense
heavy rains (over 25 mm) on about seven days per year,
rainfalls also occur with thunderstorms. In Table
whereas Kaweka Forest records 13 days per year with
9, maximum short period rainfalls for periods of 10
rainfall totals over 25mm.
minutes to 72 hours with calculated return periods
The average number of days each year on which 0.1 are given for several stations. Also listed in this table
mm or more of rain is recorded varies from around are the maximum rainfalls expected in 2, 5, 10, 20,
125 days around Napier and the Heretaunga Plains, to and 50 years. Depth-duration frequency tables for
over 160 days in the south of the region (Ashley Clinton Hawke’s Bay locations are available from NIWA’s High
and Blackburn). The Heretaunga Plains also generally Intensity Rainfall Design System (HIRDS). HIRDS uses
exhibit the lowest number of wet days in the region, the index-frequency method to calculate rainfall return
with less than 90 wet days recorded there on average, periods. For more information on methods and to use
compared with 137 in Ashley Clinton and Makaretu the tool, see www.hirds.niwa.co.nz.
Table 8. Average monthly rain days and wet days for Hawke’s Bay region; a: 0.1 mm rain day, b: 1 mm wet day.
Location Jan Feb Mar Apr May Jun Jul Aug Sep Oct Nov Dec Ann
a 8 7 9 10 11 12 13 12 10 10 9 7 119
Aramoana
b 6 6 8 8 10 11 11 11 9 9 7 6 102
a 12 11 13 13 15 16 17 18 16 16 15 13 176
Ashley Clinton
b 9 9 10 10 11 13 13 14 13 13 12 10 137
a 12 11 13 13 14 15 16 16 17 15 13 13 167
Blackburn
b 9 8 10 10 10 10 12 12 12 10 10 9 123
a 9 9 10 10 11 12 13 12 11 11 10 9 126
Gwavas
b 7 7 8 8 9 10 11 10 9 9 8 8 104
a 11 11 12 12 13 12 14 14 13 13 13 11 150
Kaweka Forest
b 9 9 9 10 10 10 11 11 10 10 10 9 119
a 12 11 13 13 13 12 15 15 15 14 13 13 159
Makaretu North
b 10 9 11 10 11 11 13 13 13 12 12 11 137
a 9 9 10 10 11 12 13 11 11 11 9 10 125
Napier Aero AWS
b 7 6 7 7 7 8 9 7 7 8 6 7 87
a 8 8 10 10 11 12 13 12 11 11 9 9 124
Napier Nelson Pk
b 6 6 7 7 8 9 9 8 7 8 6 7 88
a 8 8 9 9 11 13 13 13 11 10 9 10 127
Ngatarawa
b 6 6 7 7 8 9 9 8 8 7 7 7 89
a 9 9 10 10 12 13 14 13 13 12 11 10 134
Ongaonga
b 7 7 8 8 9 10 11 10 9 9 8 8 103
a 9 9 10 10 10 13 12 12 11 11 10 9 127
Rukumoana 2
b 8 9 9 9 9 11 10 11 10 10 9 8 113
Wairoa, North Clyde a 12 11 12 14 14 15 17 15 13 13 12 12 159
EWS b 8 8 9 10 10 11 13 10 9 8 9 8 112
a 9 9 9 9 10 11 10 11 11 11 10 10 120
Waiwhare
b 8 8 8 8 8 10 9 9 9 9 8 8 102
21Table 9. Maximum recorded short period rainfalls and calculated return periods from HIRDS.
Location 10min 20min 30min 1hr 2hrs 6hrs 12hrs 24hrs 48hrs 72hrs
Napier Nelson Park a 21 41 52 65 68 69 69 103 118 142
b 100+ 100+ 100+ 100+ 100+ 17 5 7 4 5
c 5 8 10 15 21 37 52 74 93 106
d 7 10 13 21 29 50 70 99 123 140
e 9 13 17 26 36 61 85 119 149 169
f 11 16 21 32 44 74 103 143 178 203
g 14 21 27 42 57 95 131 180 225 256
Waipukurau Aero a 16 21 23 25 39 48 64 110 142 153
b 29 20 29 5 11 5 7 27 25 18
c 8 11 13 18 24 37 49 65 84 97
d 10 14 17 24 31 47 62 80 103 119
e 12 17 21 30 38 56 72 92 118 137
f 15 21 25 36 45 65 83 104 135 156
g 19 27 32 46 57 80 99 124 159 185
Wairoa, North Clyde a 11.6 17.4 23.3 39.1 70.6 126.8 175.7 213.5 235.5 241.7
EWS b 13 14 17 29 82 100+ 96 52
c 7 10 13 19 27 47 66 93 115 130
d 9 14 17 25 35 61 86 121 149 169
e 11 16 20 30 42 73 102 144 178 201
f 13 19 24 36 50 86 121 170 210 238
g 16 24 30 45 63 107 151 211 261 295
a: highest fall recorded (mm)
b: calculated return period of a (years)
c: max fall calculated with ARI 2 years (mm)
d: max fall calculated with ARI 5 years (mm)
e: max fall calculated with ARI 10 years (mm)
f: max fall calculated with ARI 20 years (mm)
Recent extreme events in Hawke’s Bay g: max fall calculated with ARI 50 years (mm)
Hawke’s Bay has experienced numerous extreme
weather events, with significant damage and
disruption caused by flooding and high winds. The
events listed below are some of the most severe
events to have affected the Hawke’s Bay region
between 1980 and 2013.
6-10 March 1988: Ex-tropical cyclone Bola affected
most regions in the North Island, including Hawke’s
Bay, bringing widespread damage with combinations
of heavy rain, flooding, high winds, and heavy seas. In
the Hawke’s Bay region, two people drowned during
the storm. A Civil Defence Emergency (CDE) was in
place in different parts of the region from the 8th to the
17th. Significant portions of farmland were affected
by flooding, river erosion, and landslides/gullies.
State Highway (SH) 2 between Wairoa and Napier was
blocked and damaged by flooding and slips. Wairoa’s
main bridge collapsed, splitting the town in two and
destroying the town’s water supply. Many roads and
22bridges in the area were impassable, and hundreds of
24-31 May 2010: A front caused heavy rain and high
people were evacuated due to flooding.
seas in the Hawke’s Bay region. The shoreline at Te
1-3 June 1997: A deep low pressure system moved Awanga was undermined and the motor camp had
down the North Island and stalled near Mahia to relocate some cabins further inland. Streets were
Peninsula. A very strong southeast flow developed due flooded in suburban areas on the Heretaunga Plains,
to a ridge of high pressure over southern New Zealand, and some roads were closed. In central Napier, slips
which caused gales and heavy swells in the Hawke’s caused some homes to be evacuated.
Bay. Heavy rain caused flooding and slips in the region,
closing SH 2 between Wairoa and Napier. There were
numerous power outages in the region, and a CDE was
declared for Northern Hawke’s Bay on the 2nd and 3rd.
All schools in that part of the region were closed. High
winds felled trees, downing power lines, and roofs were
lifted. 166 people were evacuated in Nuhaka where
flash flooding occurred. Periods of low rainfall
Periods of fifteen days or longer with less than 1 mm
7-10 December 2001: Thunderstorms brought heavy
of rain on any day are referred to as ‘dry spells’. Dry
rain and flooding to the Hawke’s Bay region on the
spells are common in Hawke’s Bay during late spring,
9th. It was estimated to be a 100-year rainfall event
summer, and early autumn. There is an average of 3.5
in Napier and Hastings city centres. The rain caused
such periods each year in Napier, 2.6 in Ongaonga,
damage to apricot crops, roofs, and some shop stock.
and 1.7 in Wairoa. The average duration of a dry spell
Urban stormwater drains were overwhelmed by the
is about 19 days. The longest recent dry spell between
rain and there was widespread surface flooding in
three key sites in Hawke’s Bay (Napier Nelson Park,
central Napier, Hastings, and Havelock North. A roof
Wairoa Waiputaputa Station, and Ongaonga) was 40
of a department store partly collapsed, damaging
days recorded in Napier, from 4 April to 13 May 1986.
hundreds of thousands of dollars’ worth of stock.
During this dry spell, 20 consecutive days were without
17-24 June 2006: A depression lay to the northeast of any rain. The longest recent dry spell in in Ongaonga
the North Island, causing a very strong, cold southeast was also 40 days, during both 2 May 2007 and 10
flow over the Hawke’s Bay region. On the 18th, heavy June 2007 and 7 February 2013 to 18 March 2013 (28
snow fell to 500 m, causing hundreds of motorists to be and 26 consecutive dry days during these periods,
stranded. Numerous state highways in the region were respectively). In Wairoa, the longest recent dry spell
closed, with SH 5 from Taupo to Eskdale covered with was 27 days from 3 to 29 November 1994, of which all
snow 50 cm deep. There were numerous power cuts to days were without any rain.
homes and farms in the high country. Heavy rain also
Some long dry spells are interspersed with only a few
caused slips which closed some roads.
days where more than 1 mm of rain fell on each day.
29 July-1 August 2008: This storm affected the country For example, from 4 February 1989 there was a 33-day
only a few days after another intense storm. In the dry spell, followed by one day with 2.7 mm of rain,
Hawke’s Bay region, surface flooding and slips forced followed by another 33-day dry spell, followed by one
the closure of some roads and railway lines. Residents day with 1.5 mm of rain, which was followed by a 17-
in central Hawke’s Bay were told to boil their drinking day dry spell. The rain on the intervening days was very
water for a week due to contamination fears caused minimal, and this 83-day period recorded only
by the flooding. High winds closed the Napier-Taihape 9.4 mm of rain.
Road, and caused tree fall and building damage.
Some schools were also closed due to the flooding.
Numerous beachfront houses at Haumoana were
damaged by high seas.
23Temperature
Sea surface temperature
25 SST Napier air temperature
Monthly mean sea surface temperature off
the coast of Hawke’s Bay is compared with 20
mean air temperature for Napier in Figure
Temperature (°C)
13. There is about a four week lag between 15
the minima of land and sea temperatures,
10
with air temperatures being cooler than
sea surface temperatures from March to 5
October. Figure 14 shows the mean sea
surface temperatures for the New Zealand 0
Jan Feb Mar Apr May Jun Jul Aug Sep Oct Nov Dec
region for February and August, which
are the warmest and coolest months with
respect to sea surface temperatures. Figure 13. Mean monthly land (Napier Nelson Park) and sea surface
temperatures (off the coast of Hawke’s Bay).
MEAN FEBRUARY SST (°C) MEAN AUGUST SST (°C)
Figure 14. Monthly mean sea surface temperatures (°C) for: a) February; b) August, based on the years 1993–2002. Source: NIWA
SST Archive, Uddstrom and Oien (1999).
Air temperature
In general, the Heretaunga and Takapau Plains areas around the coast and Heretaunga Plains have
experience warm afternoon temperatures of at least a median annual temperature of around 13.5°C,
23°C in summer (Figure 15a), and cold winter night whereas the inland ranges experience median annual
temperatures of 3-5°C (Figure 15b). Along the coast, temperatures of about 8°C. Air temperatures decrease
maximum temperatures are higher than in the hill with height above sea level by about 0.6°C for each
country. Minimum temperatures are also warmer 100 m increase in elevation. In elevated areas, the
than further inland due to the modifying influences cooler conditions mean that temperatures will often
of Hawke Bay and the Pacific Ocean. Figure 16 shows fall below freezing, especially during the winter.
that median annual average temperature in the Further, the daily variation in temperature decreases
Hawke’s Bay region varies with elevation. Low-lying as the altitude increases. Figure 17 gives the monthly
24temperature regime (highest recorded, mean monthly
maximum, mean daily maximum, mean, mean daily
minimum, mean monthly minimum, and lowest
recorded) for selected sites in Hawke’s Bay.
A B
Figure 15. a) Left: Hawke’s Bay median summer average
daily maximum temperature; b) Right: Hawke’s Bay
median winter average daily minimum temperature.
Hawke’s Bay, like other regions east of the main
ranges, can experience sudden and large temperature
changes (Figure 18). Daily temperature ranges are
larger than are found in western areas of New Zealand
(Table 10). The daily range of temperature, i.e. the
difference between the maximum and the minimum,
is smaller at the coast (e.g. Napier and Wairoa) than
in sheltered inland areas (e.g. Waipukurau). However,
in the ranges the daily variation is also influenced by
cloudiness and elevation; the higher the elevation and
cloudier the conditions, the smaller the temperature
range (e.g. Waikaremoana).
The diurnal temperature range for Napier is
moderate. Table 11 and Figure 19 show mean hourly
temperatures for Napier for January and July.
Figure 16. Hawke’s Bay median annual average
temperature, 1981-2010.
25Napier Nelson Park Waikaremoana Onepoto
0 10 20 30
0 10 20 30
Temperature (0C)
Temperature (0C)
−10
−10
J F M A M J J A S O N D J F M A M J J A S O N D
Waipukurau Aero Wairoa, North Clyde EWS
0 10 20 30
0 10 20 30
Temperature (0C)
Temperature (0C)
−10
−10
J F M A M J J A S O N D J F M A M J J A S O N D
Figure 17. Monthly variation in air temperatures for selected Hawke’s Bay stations. Highest Recorded
Mean Monthly Maximum
The highest maximum temperature measured in the Mean Daily Maximum
region to date is 38.0°C, recorded at Wairoa on 11 Mean
January 1979. The extreme minimum temperature of Mean Daily Minimum
-11.6°C was recorded at Kuripapango in the Kaweka
Range in June 1958. These extreme temperatures Mean Monthly Minimum
compare to national extremes of 42.4°C and -25.6°C. Lowest Recorded
Table 10. Average daily temperature range (Tmax - Tmin, °C) for Hawke’s Bay sites.
Location Jan Feb Mar Apr May Jun Jul Aug Sep Oct Nov Dec Ann
Napier Nelson Pk 9.9 9.6 10 10 10 9.9 9.5 9.8 10 9.8 9.7 9.5 9.8
Waikaremoana Onepoto 10.2 9.7 9.2 7.6 6.7 6.4 6.1 7.1 8.1 9 9.5 9.2 8.2
Waipukurau Aero 12.6 11.8 11.2 11.3 10.4 9.9 9.4 9.5 10 10.8 11.1 11.4 10.8
Wairoa, North Clyde EWS 10.6 10.2 10.2 9.8 10 9.8 9.2 9.6 10 9.8 10.4 10.2 10
With the prevailing wind direction over
New Zealand being westerly, high
temperatures resulting from the dry
foehn winds in the lowland areas are
not uncommon, and summertime
temperatures frequently rise above
25°C. Wairoa has an average of 50
days each year when the maximum
temperature exceeds 25°C. At Mahia,
Figure 18. Thermogram trace 19-21 January 1982 at Havelock North Naiper, Waipukurau, and Whakatu, the
showing large and sudden temperature changes. respective values are 13, 44, 40, and 34
days per year.
Table 11. Mean hourly temperatures at Napier Nelson Park for January and July.
hrs 00 01 02 03 04 05 06 07 08 09 10 11
January 16.5 16.1 15.6 15.3 15.1 14.7 15.6 17.4 19.0 20.1 20.8 21.3
July 8.1 8.1 7.9 7.5 7.5 7.5 7.1 7.3 7.5 8.6 10.5 11.7
hrs 12 13 14 15 16 17 18 19 20 21 22 23
January 21.6 21.8 21.9 21.7 21.5 21.1 20.5 19.7 18.7 18.1 17.5 16.9
July 12.3 12.7 12.9 12.7 12.3 11.2 10.0 9.6 9.2 8.8 8.7 8.4
26Earth Temperatures
25.0 January July
Earth (soil) temperatures are measured
once daily at 9 am at several Hawke’s 20.0
Temperature (°C)
Bay locations. Earth temperatures are
15.0
measured at varying depths and are
important, amongst other things, for 10.0
determining the growth and development
5.0
of plants. Different plants have different
rooting depths and as such, earth 0.0
temperatures are routinely monitored at 00 01 02 03 04 05 06 07 08 09 10 11 12 13 14 15 16 17 18 19 20 21 22 23
10, 20, 30, 50, and 100 cm depths. Table 12 Time (hours)
lists mean monthly earth temperatures for Figure 19. Mean hourly temperatures at Napier Nelson Park for
January and July.
a number of standard depths.
In the Hawke’s Bay region, earth
5 cm 10 cm 20 cm 30 cm 100 cm Air temp
temperatures, like air temperatures, vary 25.0
spatially. The sites at higher elevations,
20.0
such as Waipukurau, exhibit cooler 9 am
Temperature (°C)
earth temperatures than sites at lower 15.0
elevations, such as Napier. Figure 20
shows how earth temperatures change 10.0
throughout the year at Napier, compared
5.0
with air temperature. The temperature
cycle for 100 cm depth is more dampened 0.0
Jan Feb Mar Apr May Jun Jul Aug Sep Oct Nov Dec
and lagged than at shallower depths.
Figure 20. Average monthly 9 am earth temperatures for different
depths and mean 9 am air temperature at Napier Nelson Park.
Table 12. Mean 9 am earth temperatures at different Hawke’s Bay locations, with station elevations.
Location Jan Feb Mar Apr May Jun Jul Aug Sep Oct Nov Dec Ann
Havelock Nth D.S.I.R. 5 cm 20.1 18.8 16.2 11.7 7.9 5.2 4.6 6.0 9.2 13.3 16.9 19.3 12.4
1 (9m) 10 cm 19.4 18.7 16.3 12.3 8.7 6.1 5.4 6.7 9.0 12.4 15.7 18.1 12.4
20 cm 20.7 20.4 18.2 14.4 10.7 7.8 6.9 8.2 10.5 13.5 16.8 19.2 13.9
30 cm 21.1 20.8 18.8 15.2 11.6 8.8 7.7 8.9 11.1 14.1 17.2 19.5 14.6
100 cm 18.5 19.1 18.6 16.9 14.4 12.0 10.4 10.3 11.4 13.2 15.3 17.1 14.8
Napier Nelson Pk 5 cm 19.7 19.3 16.6 13.6 10.3 7.4 7.0 7.6 10.0 12.7 15.6 18.5 13.2
(2m) 10 cm 20.4 20.1 17.4 14.0 10.9 8.1 7.7 8.0 10.3 13.2 16.0 18.9 13.8
20 cm 21.6 21.3 18.7 15.3 12.1 9.2 8.5 9.0 11.2 14.2 17.2 19.9 14.9
30 cm 21.8 21.6 19.7 16.6 13.1 10.1 9.1 9.9 12.1 15.0 17.9 20.2 15.6
100 cm 20.2 20.8 20.2 18.4 15.8 13.2 11.5 11.3 12.4 14.3 16.5 18.5 16.1
Waipukurau Aero 10cm 18.6 18.1 15.7 12.3 9.0 6.5 5.6 6.6 8.8 11.9 15.0 17.3 12.1
(137m) 20cm 19.3 19.2 17.0 13.7 10.5 7.9 6.9 7.7 9.7 12.3 15.2 17.6 13.1
30cm 19.6 19.6 17.7 14.7 11.5 8.9 7.7 8.5 10.3 12.8 15.6 18.0 13.7
Whakatu (6m) 5 cm 19.4 18.1 16.1 13.0 8.7 6.0 5.5 7.0 10.5 13.5 16.1 18.9 12.7
10 cm 19.0 18.5 16.2 12.9 9.2 6.6 6.0 7.0 9.7 12.7 15.3 18.0 12.6
20 cm 20.3 20.2 18.1 14.9 11.2 8.6 7.7 8.6 10.8 13.8 16.5 19.0 14.1
30 cm 20.6 20.5 18.5 15.5 12.1 9.5 8.6 9.3 11.4 14.2 16.9 19.3 14.7
100 cm 18.4 19.0 18.6 17.0 14.8 12.5 11.0 10.8 11.7 13.4 15.3 17.0 14.9
27Frosts
Frost is a local phenomenon and its frequency of Ground frosts are recorded when the air temperature
occurrence can vary widely over very small areas. 2.5 cm above a clipped grass surface falls to -1.0°C or
Areas most likely to be subjected to frost are flat areas, lower. Both types of frost are common in the Hawke’s
where air is not able to drain away on calm nights, Bay region in the cooler months. Table 13 lists for
and valleys, where cold air is likely to drift from higher selected sites the mean daily grass minimum and
areas. extreme grass minimum temperatures and the average
number of days each month with ground and air frosts.
There are two types of frost recorded. Air frosts occur
Data on air temperatures (mean daily, monthly minima,
when air temperature measured in a screen by a
and extreme minima) can be obtained from Figure 17.
thermometer 1.3 m above the ground falls below 0°C.
Table 13. Occurrences of frosts and grass minimum temperatures in Hawke’s Bay.
Location Jan Feb Mar Apr May Jun Jul Aug Sep Oct Nov Dec Ann
Kaweka Forest a 9.4 9.3 7.5 4.9 2.7 1.7 0.5 1.1 1.7 4.0 6.0 7.9 4.7
b -1.2 -0.9 -2.0 -3.0 -4.0 -9.0 -8.7 -6.0 -7.6 -2.7 -2.6 -1.5
c 0 0 0 1 2 6 8 7 3 1 0 0 30
d 0 0 0 0 0 1 1 1 0 0 0 0 3
Napier Nelson Pk a 12.5 12.7 10.7 7.9 5.2 2.8 2.4 2.8 4.7 6.9 8.9 11.6 7.4
b 2.3 0.2 -1.2 -2.5 -3.6 -7.2 -6.4 -6.4 -6.1 -3.5 -4.2 1.0
c 0 0 0 0 2 6 7 6 2 1 0 0 24
d 0 0 0 0 0 2 3 2 1 0 0 0 8
Porangahau 2 a 10.5 10.6 8.9 5.8 3.6 2.1 1.3 1.7 2.9 5.0 7.4 9.3 5.7
b -1.1 0.6 -2.4 -3.0 -5.1 -6.9 -7.1 -6.7 -5.3 -4.5 -1.8 -2.4
c 0 0 0 1 4 8 10 9 6 2 0 0 40
d 0 0 0 0 0 1 2 1 0 0 0 0 4
Waipukurau Aero a 8.4 8.9 7.9 4.4 2.6 1.0 0.3 1.1 2.4 3.8 5.6 7.4 4.5
b -4.0 -1.1 -5.2 -5.0 -7.1 -12.0 -9.8 -7.6 -5.6 -5.4 -4.2 -3.4
c 1 0 0 2 6 10 12 10 6 4 1 1 52
d 0 0 0 0 3 6 7 4 2 0 0 0 22
Wairoa, North Clyde a 11.2 12.0 10.0 7.4 5.0 2.4 2.6 2.4 3.8 5.6 7.9 10.3 6.7
EWS b 0.9 2.0 0.5 -1.7 -3.5 -5.6 -5.0 -5.2 -6.0 -3.0 -2.0 0.0
c 0 0 0 0 1 7 6 6 2 1 0 0 23
d 0 0 0 0 0 1 1 1 0 0 0 0 2
a: mean daily grass minimum (°C)
b: lowest grass minimum recorded (°C)
c: average number of ground frosts per month
d: average number of air frosts per month
28Sunshine and Solar Radiation
Sunshine
The extensive sheltering by the western
high country from the prevailing westerly
winds, makes much of Hawke’s Bay a
very sunny region (Figure 21). Bright
sunshine hours are highest at and near
the coast (more than 2200 hours recorded
annually in these areas), and sunshine
totals decline further inland. Increased
cloudiness in the high country reduces
the amount of sunshine, and less than
1850 hours per year are common in the
Ruahine Ranges. Figure 22 shows the
monthly mean, maximum, and minimum
recorded bright sunshine hours for
selected sites in Hawke’s Bay.
Figure 21. Median annual sunshine hours for Hawke’s Bay, 1981-2010.
Napier Nelson Park Waipukurau Aero
Bright Sunshine (hours)
Bright Sunshine (hours)
300
300
200
200
100
100
0
0
J F M A M J J A S O N D J F M A M J J A S O N D
Wairoa Hospital
Highest Recorded
Bright Sunshine (hours)
300
200
Mean
100
0
J F M A M J J A S O N D Lowest Recorded
Figure 22. Mean, highest, and lowest recorded monthly bright sunshine hours for selected sites in Hawke’s Bay.
29Solar radiation
Solar radiation records are available for a number
of sites in Hawke’s Bay, but only a few sites have a
long record (>10 years). Solar radiation is presented
for Mahia, Napier, and Whakatu. Insolation is at a
maximum in December and January and a minimum
in June. Table 14 shows mean daily solar radiation
(global) for each month for these three sites.
Table 14. Mean daily global solar radiation (MJ/m2/day) for Hawke’s Bay sites.
Location Jan Feb Mar Apr May Jun Jul Aug Sep Oct Nov Dec Ann
Mahia AWS 22.2 18.8 14.9 10.5 7.5 6.0 6.4 9.4 13.7 18.0 21.1 22.2 14.2
Napier Aero AWS 22.9 19.4 15.8 11.2 7.9 6.4 6.8 9.9 14.0 18.5 21.7 22.8 14.8
Whakatu EWS 23.4 20.2 15.9 11.1 7.5 6.0 6.4 9.6 14.1 18.8 22.0 23.1 14.8
UV (Ultra-violet radiation)
Ultra-violet radiation (UV) measurements are not
available for any stations in the Hawke’s Bay region.
Figure 23 shows an example of a UV forecast for
Napier, and indicates the levels of UV and times of the
day where sun protection is required.
Figure 23. UV Index forecast for Napier, January and July. Source: https://www.niwa.co.nz/our-services/online-services/
uv-and-ozone
30Fog Hail
The most common type of fog in the Hawke’s Bay region There is no significant difference in days with hail
is radiation fog, formed when the air cools to its dew- throughout the region, the number of which are low
point on clear nights, allowing the water vapour in the (0.5-1 days per year). As with thunderstorms, an
air to condense. Fogs also sometimes form when the unknown number of hail falls will escape detection at
humidity of the air near the ground has been raised by some of the stations. Hail is most likely over the winter
falling rain. and spring months. Table 15 gives the average number
of days per year on which hail is reported at selected
The frequency of fog varies widely over the Hawke’s Bay
stations.
region, ranging from an average of 36 days with fog per
year at Waikaremoana to an average of once every four One particularly severe hail event was on 8 October
months in Esk Forest. Although fog can occur at any 1986. A hailstorm which was about 300m wide affected
time of the year it is recorded most frequently between the Hastings and Taradale area and lasted about
March and August. The average number of days per 10 minutes. Most of the hailstones were 10 mm in
year with fog for selected stations in the Hawke’s Bay diameter, although some were up to 40 mm diameter.
region is listed in Table 15. Fifty-seven fruit growers were affected, and 450 ha of
pipfruit was badly damaged, plus grapes, kiwifruit, and
Table 15. Average number of days each year with berry crops. The total cost of damage was estimated at
thunder, fog, and hail, from all available data.
$39 million 2010 dollars. One strawberry grower said
Location Thunder Fog Hail his strawberries had reduced from $7/kg to $1.70/kg
Esk Forest 3 3 1 due to hail damage.
Havelock Nth D.S.I.R. 1 3 12 1
Makaretu Research
3 8 0.7
Tornadoes
Station
Tornadoes are rapidly rotating columns of air extending
Napier Nelson Pk 4 4 0.9
from the base of a cumulonimbus cloud, and have in
Waikaremoana Onepoto 2 36 1
New Zealand a damage path typically 10-20m wide and
Waipukurau Aero 8 34 1
1-5 km long. The small size (compared to tornadoes
Wairoa, Frasertown 0.2 4 0.5
in the USA), their short lifetimes, and the sparse
population of much of New Zealand must result in an
Severe convective storms unknown number of tornadoes not being reported.
Thunderstorms Tornadoes are rare in the Hawke’s Bay region. Only
In the Hawke’s Bay region, thunderstorms occur three damage-causing tornadoes are recorded in
throughout the year, and thunder has a maximum NIWA’s Historical Weather Events Database (www.
frequency in the late spring and summer months. hwe.niwa.co.nz), two in 2008 and one in 2004. On
Thunderstorms are usually associated with cold 30 April 2004, a tornado tore its way across forest
south or southwest airstreams, whereas summertime and farmlands between Te Haroto and Tarawera in
thunderstorms may result from strong surface the early morning. The tornado lasted for about ten
heating in weak synoptic gradients, leading to intense minutes, and it uprooted trees, tore down fences, and
cumuliform cloud development. Average annual brought down power lines. Windows were smashed on
frequencies for selected stations are given in Table 15, some properties and outdoor furniture was sent flying.
and range from eight in Waipukurau to only one every SH 5 was closed due to power lines being brought
five years in Wairoa. At some of the stations, it is likely down across the highway. About 100 homes lost power
that not all thunderstorms are detected. The heavy for a few hours following the tornado.
rain, lightning, hail, wind squalls, and rare tornadoes
which can occur with thunderstorms will sometimes
cause severe local flooding, disruption of electrical and
electronic equipment, and damage to trees, crops, and
buildings.
31Snow
Snow showers may occur at any time of the year on
the ranges surrounding Hawke’s Bay in cold southerly
airstreams, but snow to low levels is exceedingly rare;
about one or two days every 10 years.
Widespread snow was reported to low levels over
the east of the North Island on 21 June 1976 (Figure
24) when a deep depression lay just east of the
North Island and a slow moving anticyclone over the
southwest Tasman Sea extended a ridge over the seas
to the south of the country. The strong cold southerlies
between the high and low pressure areas brought
Figure 24. Mean sea level analysis for 0000 hours on 21 June
heavy falls of snow to the ranges of Hawke’s Bay from 1976.
20-25 June as the synoptic weather pattern remained
static during this time.
More recently, a significant snow event occurred on 24-
26 September 2000. A rapidly deepening low crossed
the North Island and caused a very cold southerly flow Table 16. Generated wave heights associated with specific wind
speeds. Assumes a fetch length of 500 km with unlimited wind
over Hawke’s Bay. This caused high winds, heavy rain, duration.
and snow as low as 250 m in the region. The storm Wind speed (km/hr) Associated wave height (m)
cut power to 95,000 people on the night of the 25th.
10 0.5
Numerous highways were closed due to snow and
20 1
ice, which was up to 20 cm deep on the roads, as well
30 2
as fallen trees. There were large lamb losses in the
40 3
region due to the low temperatures.
50 4
75 7
Sea swell and waves
100 11
The area of the Pacific Ocean which is bounded by the
125 13+
Hawke’s Bay region is sheltered from the prevailing
west to southwest swells of its latitude zone by the
land mass of the North Island. Consequently high
waves are less frequent than in corresponding western the strong south-westerly wind zone that frequently
areas. Similarly it is protected from the cool ocean exists between New Zealand and the Chatham Islands.
currents induced by the prevailing westerly winds.
Thus waves from the southerly quarter are the most Along some parts of the Hawke’s Bay coast,
frequent (due to the region’s exposure to the south). particularly at Te Awanga and Haumoana, high seas
The prevailing easterly flow over the Pacific Ocean associated with high tides can cause significant
to the north of New Zealand produces a persistent damage to beachfront properties. On 8-9 February
easterly swell in the latitude of northern New Zealand, 2008, heavy swells associated with ex-tropical cyclone
especially during the summer and autumn when the Gene undermined some beachfront properties, flooded
belt of southeasterly trade winds tends to lie further car parks, and left debris along the shoreline.
south than in other seasons. Of all swells observed, There is a known relationship between steady wind
the frequency of those from one to two metres is speed and wave heights over the open sea. The most
65%, while for those greater than two metres is 20% probable wave heights for a given wind speed over a
(Gorman et al., 2003). Most of the large southerly typical fetch length in New Zealand coastal waters of
swells arriving in the Hawke’s Bay region originate in about 500 km are given in Table 16.
3233
DERIVED CLIMATOLOGICAL
PARAMETERS
Apart from elements such as temperature and rainfall             Vapour pressure is the part of total air pressure
which can be measured directly, it has been found                that results from the presence of water vapour in
that parameters computed from several elements,                  the atmosphere. It varies greatly with air masses
have some important uses especially in industry.                 from different sources, being greatest in warm air
Parameters which define the overall suitability of the           masses that have tropical origins and lowest in cold,
climate for agriculture, horticulture, architectural and         polar-derived air masses. Vapour pressure can be
structural designs, and contracting, etc., are vapour            important in determining the physiological response of
pressure, relative humidity, evapotranspiration (leading         organisms to the environment (very dry air, especially
to soil water balance), degree-days (thermal time),              if there is a pre-existing soil moisture deficit, can
and rainfall extremes. Some of these parameters and              cause or increase wilting in plants). Average 9 am
their uses are discussed in the following paragraphs.            vapour pressures for several stations are given in
Short-term high intensity rainfalls have been covered            Table 17.
previously.
                                                                 Relative humidity is quite high in all seasons, but there
                                                                 is a peak in winter, as shown in Table 18. The sites
Vapour pressure and relative humidity                            inland (Waipukurau and Wairoa) tend to have higher
Vapour pressure and relative humidity are the two                relative humidity than coastal sites.
parameters most frequently used to indicate moisture
levels in the atmosphere. Both are calculated from
simultaneous dry and wet bulb thermometer readings,
although a hygrograph may be used to obtain
continuous humidity readings.

       Table 17 Mean monthly/annual 9 am vapour pressure (hPa) for selected Hawke’s Bay sites.
        Location                      Jan   Feb   Mar Apr      May Jun      Jul    Aug Sep     Oct       Nov Dec   Ann
        Mahia Aws                     15.6 16.2 14.8 13.6 11.9 10.1 9.8            9.7   10.5 11.2 12.2 14.5 12.5
        Napier Nelson Pk              15.6 15.8 14.7 13.0 11.0 9.3          8.9    9.3   10.2 11.1 12.4 14.2 12.1
        Waipukurau Aero               15.6 15.6 14.6 12.0 9.9         8.6   8.2    9.0   10.2 11.5 12.8 14.5 11.5
        Wairoa, North Clyde EWS       15.5 16.1 14.5 13.1 11.1 9.3          9.3    9.6   10.9 11.1 12.6 14.4 12.3

        Table 18. Mean monthly/annual 9 am relative humidity (%) for selected Hawke’s Bay sites.
        Location                      Jan   Feb   Mar Apr      May    Jun   Jul    Aug Sep         Oct   Nov Dec   Ann
        Mahia AWS                      75    78    78     79    79     79    80     77    75       75    74   76   77
        Napier Nelson Pk               70    74    75     77    79     80    80     76    69       67    68   67   73
         Waipukurau Aero               77    84    84     84    84     85    84     84    81       78    78   78   82
         Wairoa, North Clyde EWS       72    78    79     82    82     82    85     81    76       74    71   70   78

                                                                                                                             35
Evapotranspiration and soil water balance
Evapotranspiration is the process where water held
in the soil is gradually released to the atmosphere
through a combination of direct evaporation and
transpiration from plants. A water balance can be
calculated by using daily rainfalls and by assuming
that the soil can hold a fixed amount of water with
actual evapotranspiration continuing at the maximum
rate until moisture depletion of the soil occurs. The
calculation of water balance begins after a long
dry spell when it is known that all available soil
moisture is depleted or after a period of very heavy
rainfall when the soil is completely saturated. Daily
calculations are then made of moisture lost through
evapotranspiration or replaced through precipitation.
If the available soil water becomes insufficient to
maintain evapotranspiration then a soil moisture
Table 19. Mean monthly/annual water balance summary for a soil moisture capacity of 150 mm.
Location Jan Feb Mar Apr May Jun Jul Aug Sep Oct Nov Dec Ann
Napier Nelson Pk DE 107 65 44 15 3 1 0 0 1 39 74 98 449
ND 22 15 13 8 3 1 0 0 0 11 17 20 111
RO 0 0 2 2 17 39 68 25 14 5 1 0 174
NR 0 0 0 0 1 4 6 3 1 0 0 0 16
Ngatarawa DE 95 61 39 15 4 1 0 0 0 31 68 82 395
ND 21 16 13 9 4 1 0 0 0 9 17 17 107
RO 0 0 2 7 5 22 63 23 14 9 2 0 147
NR 0 0 0 0 1 3 5 3 2 1 0 0 15
Ongaonga DE 73 48 27 9 2 0 0 0 0 7 41 61 269
ND 17 13 10 6 2 1 0 0 0 3 11 15 76
RO 0 6 5 14 17 46 85 40 27 16 4 0 259
NR 0 0 0 1 2 6 8 5 3 1 0 0 26
Tutira DE 86 53 31 9 4 0 0 0 1 26 53 100 363
ND 17 12 9 4 3 0 0 0 0 7 12 19 83
RO 15 5 57 39 53 51 141 54 68 8 10 0 500
NR 0 0 1 2 3 6 6 4 2 0 0 0 25
Wairoa, Waiputaputa DE 52 34 16 1 0 0 0 0 0 5 26 50 184
Stn ND 11 8 5 1 0 0 0 0 0 2 6 11 45
RO 12 25 51 79 104 132 154 74 58 50 19 9 767
NR 1 1 3 4 6 9 11 7 4 2 1 0 48
DE is the average amount of soil moisture deficit in mm
ND is the average number of days per month on which a soil moisture deficit occurs
RO is the average amount of runoff in mm
NR is the average number of days per month on which runoff occurs
36You can also read