Testing New Concepts for Crop Cultivation in Space: Effects of Rooting Volume and Nitrogen Availability - MDPI
←
→
Page content transcription
If your browser does not render page correctly, please read the page content below
life

Article
Testing New Concepts for Crop Cultivation in Space:
Effects of Rooting Volume and Nitrogen Availability
Silje A. Wolff 1, *, Carolina F. Palma 2 , Leo Marcelis 2 , Ann-Iren Kittang Jost 1 and
Sander H. van Delden 2
 1    Centre for Interdisciplinary Research in Space (CIRiS), NTNU Samfunnsforskning AS, N-7491 Trondheim,
      Norway; a.i.kittang.jost@ciris.no
 2    Horticulture and Product Physiology, Wageningen University, PO Box 16, 6700AA Wageningen,
      Netherlands; cffpalma@gmail.com (C.F.P.); leo.marcelis@wur.nl (L.M.); sander.vandelden@wur.nl (S.H.v.D.)
 *    Correspondence: silje.wolff@ciris.no; Tel.: +47-41407561

 Received: 8 September 2018; Accepted: 3 October 2018; Published: 6 October 2018

 Abstract: Long term human missions to the Moon and Mars, rely on life support systems for food
 production and regeneration of resources. In the EU H2020 TIME SCALE-project, an advanced life
 support system concept was developed to facilitate plant research and technology demonstration
 under different gravity conditions. Ground experiments assessed irrigation systems and effects
 of rooting- and nutrient solution volume. The maximal allowed volume for existing International
 Space Station research facilities (3.4 L) was able to support cultivation of two lettuce heads for at
 least 24 days. A smaller rooting volume (0.6 L) increased root biomass after 24 days, but induced a
 5% reduction in total biomass at day 35. Regulating effects of nitrate supply on plant water fluxes
 in light and dark were also investigated. At low concentrations of nitrate in the nutrient solution,
 both transpiration and stomatal conductance increased rapidly with increasing nitrate concentration.
 During day-time this increase levelled off at high concentrations, while during nigh-time there was
 a distinct decline at supra optimal concentrations. Plants supplied with nitrate concentrations as low
 as 1.25 mM did not show visible signs of nutrient stress or growth reduction. These findings hold
 promise for both reducing the environmental impact of terrestrial horticulture and avoiding nutrient
 stress in small scale closed cultivation systems for space.

 Keywords: life support; hydroponics; transpiration; human space flight; lettuce; greenhouse;
 conductivity; gas exchange

1. Introduction
     Since the year 2000, humans have been continuously present in space on the International Space
Station (ISS). Due to its relative proximity to Earth and regular space flights, replenishment of resources
such as food and water is ensured to the crew onboard ISS. However, future plans for long term human
spaceflight beyond the low Earth orbit or establishment of colonies with a larger crew, will bring critical
challenges connected to resupply and waste management [1]. To reduce the need for replenishment,
transport mass and costs, different concepts for Bioregenerative Life Support System (BLSS) are
developed for future in situ food production in space. Higher plants are foreseen to be an essential part
of such systems [2–4]. As reviewed by Wheeler [5], ground demonstrations and plant research for BLSS
have been performed by the major governmental space agencies for the past half century. In addition
to ground-based research, crop cultivation experiments under space conditions with reduced gravity
are required [1–3,6]. Reduced gravity is expected to influence plant physiology, nutrient uptake
and thereby growth speed and potentially nutritional value in space grown crops [3,7]. On the ISS,

Life 2018, 8, 45; doi:10.3390/life8040045                                           www.mdpi.com/journal/life
Life 2018, 8, x FOR PEER REVIEW 2 of 20
Life 2018, 8, 45 2 of 19
grown crops [3,7]. On the ISS, scientific work and technology demonstrations can be performed with
fractional gravities including microgravity and simulated Moon and Mars gravity using research
facilities withwork
scientific centrifuges [8,9]. demonstrations can be performed with fractional gravities including
and technology
In the EU Horizon
microgravity 2020 TIME
and simulated Moon SCALE
and Marsproject,
gravity an
using advanced
research crop cultivation
facilities system[8,9].
with centrifuges prototype
In the EU
was developed forHorizon
imminent 2020useTIME
on an SCALE project,
existing an advanced
centrifuge on thecrop
ISS cultivation
(Figure 1).system The crop prototype
cultivation
was developed for imminent use on an existing centrifuge on the ISS (Figure
concept developed comprises a system to facilitate both technology demonstration and research on 1). The crop cultivation
algaeconcept
or plants developed comprises
in fractional gravity.a system to facilitate
Cultivation can beboth technology
performed withdemonstration
or without substrate; and research
i.e., deep
on algae or plants in fractional gravity. Cultivation can be performed with or without substrate;
water culture, which allows pure nutrient research unaffected by soil properties. The system contains
i.e., deep water culture, which allows pure nutrient research unaffected by soil properties. The system
two growth chambers per centrifuge rotor with nutrient solution volumes as large as allowed by the
contains two growth chambers per centrifuge rotor with nutrient solution volumes as large as allowed
centrifuge diameter of 600 mm (Figure A1). Each growth chamber is connected to independent
by the centrifuge diameter of 600 mm (Figure A1). Each growth chamber is connected to independent
systems that
systems that cancanmonitor
monitor plant
planthealth,
health,provide
provide light, recyclewater,
light, recycle water, and
and manage
manage nutrient
nutrient solution
solution
electric conductivity
electric conductivity (EC) and
(EC) andpH.pH. AAmulti-ion
multi-ion(NO
−
(NO33 −, ,HH2PO 4 ,−Cl , −
− − NH4 , Mg
+ + 2+ , 2+
Ca , 2+
2 PO4 , Cl , NH4 , Mg , Ca , K , Na )
2+ K , Na
+ + ) sensor
+ +
monitoring system (CleanGrow,
sensor monitoring Wolverhampton,
system (CleanGrow, Wolverhampton, UnitedUnitedKingdom)
Kingdom) is able abletoto accurately
accurately detectdetect
dynamics in macro nutrient uptake. The crop cultivation chambers are interchangeable with algae
dynamics in macro nutrient uptake. The crop cultivation chambers are interchangeable with algae
cultivation
cultivation chambers
chambers [10,11].AllAllother
[10,11]. otherparameters
parameters required
required for foroptimal
optimal cultivation
cultivation (temperature,
(temperature,
humidity, and
humidity, and CO2) are CO 2 ensured by integrating the system in an incubator on ground orthe
) are ensured by integrating the system in an incubator on ground or on onISS.
the ISS.
Figure 1. Crop
Figure cultivation
1. Crop system
cultivation systemprototype
prototypedeveloped inthe
developed in theEU
EUH-2020
H-2020 project
project TIME
TIME SCALE.
SCALE. Credit:
Credit:
DTMDTM technologies
technologies andand NTNU
NTNU Socialresearch.
Social research.
Restricted growth volumes, as used in our crop cultivation system (Figure A1), can result in a wide
Restricted growth volumes, as used in our crop cultivation system (Figure A1), can result in a
range of physiological and morphological responses [12]. This effect is undesirable because it will
wide range of physiological and morphological responses [12]. This effect is undesirable because it
confound the fractional gravity effects assessed on the ISS. Moreover, nutrient supply is an important
will environmental
confound thesignal fractional gravity
that strongly effects
affects rootassessed
developmenton the
[13] ISS. Moreover,
and shoot nutrient
gas exchange supply
rates [14–17].is an
important
As gas exchange in micro gravity is severely hindered by the lack of buoyant thermal convectionexchange
environmental signal that strongly affects root development [13] and shoot gas [18],
ratesany
[14–17].
potential regulatory effects of nutrient concentration on plant water fluxes could be usedthermal
As gas exchange in micro gravity is severely hindered by the lack of buoyant to
convection
enhance[18], any potential
transpiration regulatory
in space effects ofsystems.
crop cultivation nutrient The
concentration on plant water
effects of transpiration on fluxes
nutrientcould
be used to enhance transpiration in space crop cultivation systems. The effects of transpiration on
acquisition are well documented (reviewed by Tibbitts [19]): transpiration drives the mass flow of
nutrients
nutrient from theare
acquisition soilwell
to the roots [14], and
documented aids in translocation
(reviewed by Tibbittsof[19]):
nutrients within the plant
transpiration drives [20,21].
the mass
In turn, nutrient availability can influence transpiration [14–17]. Although the regulating
flow of nutrients from the soil to the roots [14], and aids in translocation of nutrients within the plant mechanisms
are not
[20,21]. clear, nitrogen
In turn, nutrient (N) is among the
availability canelements
influence proposed to have [14–17].
transpiration a role in regulating
Although plant water
the regulating
fluxes [14–16,22–25]. Plant fertilization with low or restricted N, causing N limitation but not deficiency,
mechanisms are not clear, nitrogen (N) is among the elements proposed to have a role in regulating
has induced increased stomatal conductance and transpiration in maize [16] and bean [15] as compared
plant water fluxes [14–16,22–25]. Plant fertilization with low or restricted N, causing N limitation but
to deficient and supra optimal concentrations. According to Wilkinson, Bacon and Davies [16] the
not deficiency, has induced
observed response increased
is stronger stomatal plants,
in well-watered conductance
pointingand transpiration
in the in maize [16]
direction of interaction and bean
between
[15] as compared toand
N concentration deficient
stomataland supra optimal concentrations. According to Wilkinson, Bacon and
conductivity.
Davies [16] the observed response is stronger in well-watered plants, pointing in the direction of
interaction between N concentration and stomatal conductivity.
The current paper aims to address three aspects of plant (Lactuca sativa) production in confined
and closed loop cultivation systems: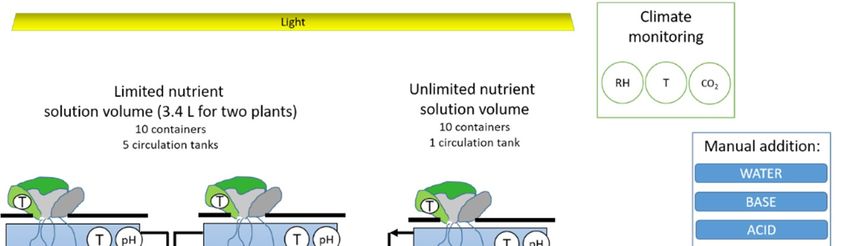
Life 2018, 8, 45                                                                                     3 of 19

    The current paper aims to address three aspects of plant (Lactuca sativa) production in confined
and closed loop cultivation systems:

(i)   The effect of a restricted rooting volume was studied by comparing a small (0.6 L) and a large
      (3.5 L) root container. We hypothesize that as longs as the conditions in both containers are similar
      there will be no effect of the root container.
(ii) The effects of a limited amount of nutrient solution were tested by comparing a 3.4 L nutrient
      solution for the cultivation of two lettuce heads to plants which receive an unlimited supply of
      fresh nutrient solution. We hypothesize that plants in both systems will be similar.
(iii) The effects of nitrate concentration on stomatal conductance, transpiration and nitrate uptake in
      intact lettuce was studied by growing plants on different nitrate concentrations; causing growth
      limitation but no morphological deficiency symptoms. To look for variations throughout
      the diel cycle, conductance and transpiration was measured during both dark and light
      conditions. We hypothesize that nitrate concentration has a regulating effect on plant water
      fluxes and that the relation between nitrate concentration and transpiration can be represented by
      a “bell curve” as described by Wilkinson, Bacon and Davies [16]. That is, when nitrate is supplied
      in a concentration range between 0 and 30 mM plant responses will gradually increase until
      reaching an “optimum concentration” at which transpiration peaks and then declines as nitrate
      concentrations becomes supra optimal.

2. Materials and Methods
     Three experiments were performed: the first two experiments determined the effect of restricted
rooting- and nutrient solution volumes (Figure A2), and based on this a third experiment was
performed to assess plant responses to various nitrate nutrient solution concentrations.

2.1. Plant Material and Growth Conditions
     Lettuce (Lactuca sativa, cv. Cecilia RZ butterhead) seeds, from Rijk Zwaan Nederland B.V.
De Lier, The Netherlands, were sown in round seed holders filled with vermiculite and water.
All plants were cultured in climate chambers at Wageningen University under a photoperiod of
16 h. CO2 concentration, temperature, and relative humidity (RH) were controlled and recorded
by a “Hoogendoorn® climate control system”. Temperature was set to 24/19 ◦ C (day/night),
relative humidity to 75% and CO2 concentration to 400 ppm (ambient). Light was provided by
fluorescent-tubes (T5-36W, Philips, Eindhoven, The Netherlands), average light intensity at plant
height was 335 µmol·m−2 ·s−1 PAR (Photosynthetic Active Radiation). Harvested plants were directly
stored in a cooling box and root and shoot fresh weights, leaf area, leaf number and both rooting
volume and length were determined within two hours after harvest. To obtain dry weights (biomass),
shoots and roots were dried separately at 70 ◦ C until constant weight (max. 4 days). The leaf
area (cm2 ·plant−1 ) was measured using a Li-Cor-3100 (Li-Cor Biosciences, Lincoln, NE, USA) and
a flatbed scanner for early growth stages. In the first two experiments, to get an impression of
relative differences in stress or nutrient shortages the Dualex ScientificTM was used. The DualexTM
provides relative estimates of concentrations of chlorophyll, flavonoids, and anthocyanins (http:
//www.force-a.com/en/publications). Plant nitrogen content was determined by a LECO element
analyzer at the Chemisch Biologisch Laboratorium Bodem (CBLB) lab of the Wageningen University.

2.2. The Effects of a Restricted Rooting- and Nutrient Solution Volume
     In the first experiment the effects of rooting volume per se were determined and in a second
experiment the effects of a limited nutrient solution were determined. For both experiments the
nutrient solution had an EC of 1.65 dS·m−1 and was composed of the following ions in mmol L−1 :
NO3 − 9, NH4 1.5, P-H2 PO4 − 1.5, K+ 5.5, Ca2+ 3, Mg2+ 1, SO4 2− 1.5, Cl− 1.5, Si 0.5, and in µmol L−1 :
Fe 28.1, B 47, Cu 1, Zn 6.4, Mn 1.5, Mo 0.7. EC and pH were measured both in the main solution tank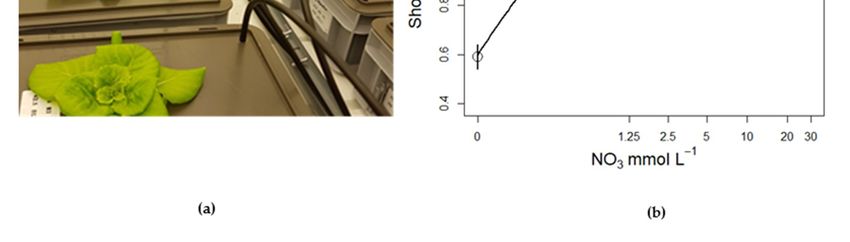
Life 2018, 8, 45                                                                                    4 of 19

and in the growth units. EC was maintained daily by adding small amounts of deionized water when
the EC increased due to evapotranspiration and pH was maintained in the range of 5.6–6.0 with citric
acid (0.1 M) and K2 HCO3 (0.1 M) added to the main solution tank when necessary.
       For the root volume experiment two container types were used: small root containers,
inner dimensions 105 × 105 × 75 mm; i.e., similar size as in the space crop cultivation concept,
which were filled with 0.6 L nutrient solution; and large root containers, inner dimensions:
265 × 165 × 115, which were filled with 3.5 L nutrient solution. Ten blocks containing one replicate of
each small and large root container were distributed over the climate room. The system was setup such
that all root containers received the same nutrient solution from a 100 liter nutrient tank. Solution was
pumped (‘Eheim Universal’ 1200 L/h, EHEIM GmbH & Co. KG, Germany) via a distribution tube
into the root containers. By adjusting the inlet valves of each container, the flow rate of the nutrient
solution was set to approximately 21 L h−1 . The drain tube in container was located at the upper part
of the containers. The drain was collected into a main drainage pipe and returned to the main nutrient
solution tank by gravity, creating a closed nutrient solution loop (Figure A2). An air pump (28 L min−1 )
pumped air to a main PVC distribution pipe Ø 4 cm from which air out flow to each root container
was controlled per container. This insured the equal distribution of air to maintain O2 saturation
levels in the root zones of all the units. The 100 L nutrient solution tank was refreshed weekly and
as a check samples of the solution were taken every 5 days and sent to the lab facilities of Eurofins
Agro NL, Wageningen, the Netherlands, for ion concentration analysis. EC, pH and dissolved oxygen
where measured with a calibrated Orion Star™ A329 pH/ISE/Conductivity/Dissolved Oxygen sensor.
Four plants were harvested after: 10, 15, 20, 25, 30 and 35 days. Fresh and dry mass of both root and
shoot, leaf area, root length and root volume were obtained. DualexTM measurements were performed
on both sides of two leaves per plant just before harvest.
       In the second experiment on nutrient solution volume the small root containers (0.6 L) were used.
Five blocks containing two root containers each were distributed over the climate room. The two
containers were either connected to a container with 3.5 L nutrients solution that was not refreshed;
i.e., limited nutrient solution treatment, or to a main system with 100 L that was refreshed weekly,
‘unlimited’ nutrient solution treatment. Environmental conditions for both experiments were similar
except for CO2 concentration that was 1000 ppm in the nutrient solution experiment opposed to
400 ppm in the rooting volume experiment.
       For both the first and second experiment treatment means per plant measurements, i.e., root length,
root volume, leaf area and both root and shoot dry and fresh mass were compared per time point using
ANOVA for a randomized block design using five blocks (‘aov’ function in R version 3.5.1.). Assessment
for significant differences between means was done using Fishers Least Significant Difference (LSD)
test (p ≤ 0.05).

2.3. Plant Responses to Various Nitrate Concentrations
      Two experimental runs were performed to determine the effects of nitrate (NO3 ) concentrations
on lettuce biomass, nitrogen content, stomatal conductance and transpiration. In the first run
(hereafter referred to as Run 1), plants grew in five different nutrient solutions with NO3 concentrations
ranging from 2.5–30 mM (Table 1). Preliminary analysis of Run 1 indicated a curvilinear response to
NO3 concentration, with a decline in stomatal conductance (gs ) and transpiration (E) mainly under
dark conditions. Based on this, a second run (Run 2) including more replicates and lower NO3
concentrations than 2.5 mM, was performed to further explore the plant responses in the lower
concentration range and improve data resolution. Following gas exchange measurements on day
12 (Run 1) and day 8 (Run 2), plants were harvested and measured for root length, leaf number,
leaf area, fresh biomass of shoots, and roots separately.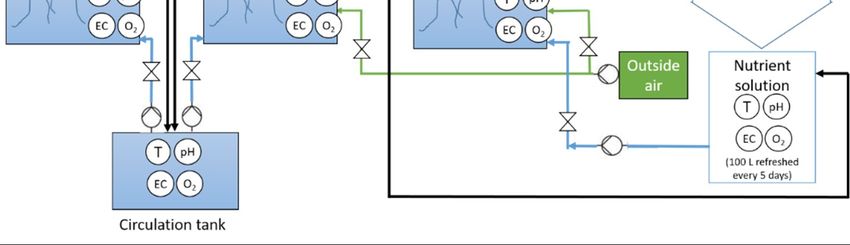
Life 2018, 8, 45                                                                                              5 of 19

       Table 1. Fertilization treatments with different N concentrations used in the two experimental runs.

                                               Run 1                            Run 2
                   Nutrient Solution       NO3 (mmol L−1 )                  NO3 (mmol L−1 )
                          1                        30                               30
                          2                        20                               20
                          3                        10                               10
                          4                         5                               5
                          5                        2.5                             2.5
                          6                                                        1.25
                          7                                                          0
      EC was kept at 3.3 dS·m−1 by substituting the NO3 with SO4 and Cl. pH was set to 5.7. Nutrient solution
      composition and salt recipes for all treatments are given in appendix x.

2.3.1. Nutrient solution formulation for nitrate treatments
      Based on the root volume experiment, the nutrient solution of the breeding phase and used as
starting point for the different nitrate treatments was composed of the following ions in mmol L−1 :
NO3 − 10, P-H2 PO4 − 1.5, K+ 13.9, Ca2+ 7, Mg2+ 2.3, SO4 2− 7, Cl− 7, Si 0.5, and in µmol L−1 : Fe 28.1,
B 47, Cu 1, Zn 6.4, Mn 1.5, Mo 0.7. To allow for the various N concentrations while keeping EC
constant, EC was kept at 3.3 dS·m−1 by substituting NO3 − with SO4 − and Cl− (Table A1). At seedling
emergence, four days after sowing (DAS) plants were exposed to a 1/3rd (1.1 dS·m−1 ) nutrient
solution, six DAS to a 2/3rd (2.2 dS·m−1 ) and eight DAS to a full strength (3.3 dS·m−1 ) nutrient
solution. At 16 DAS, plants with similar size and dimension were transferred to the experimental root
containers (265 × 165 × 115 mm, same as large root container in the root volume experiment) prefilled
with the different nutrient solution treatments (3.5 L in each container, filled to 35mm under the lid).
Nutrient solution composition was determined before onset of treatments (without plants) and at
experiment end (after harvest). Samples of 50 ml were taken from each growth pot and analyzed for
all essential plant nutrients (Eurofins® Netherlands, Wageningen).

2.3.2. Stomatal Conductance and Transpiration Rate Measurements
     After exposure to the different nitrate concentration treatments (Table 1), stomatal conductance
and transpiration were measured during the light and the dark period with a LI-6400 Portable
Photosynthesis System (Li-Cor Biosciences, Lincoln, NE, USA) equipped with a leaf chamber
fluorometer (area = 2 cm2 ) and controlled LED source (90% Red + 10% Blue). Three hours after
start of the dark or light period five measurements per leaf, one every five seconds were recorded.
In order to reduce the variance between plants the distal part of the last fully expanded leaf blade,
avoiding the leaf vein, were measured. Rates of night-time transpiration were measured with the same
climatic settings as the in the cultivation chamber and a PPFD of 0 µmol m−2 s−1 . Low intensity green
light (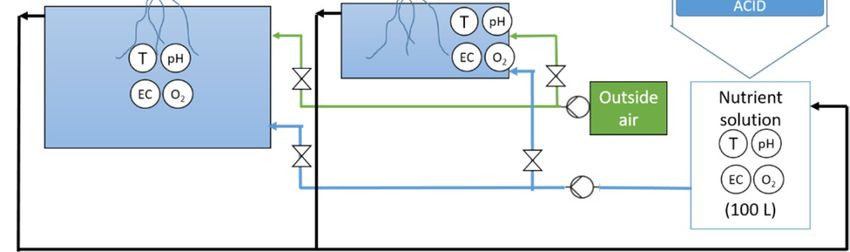
Life 2018, 8, 45                                                                                     6 of 19

To analyze the effects of nitrate concentration on transpiration (E) and stomatal conductance (gs ),
we ran linear mixed effects regression models (LMERs) from the lmer function in package lme4 for
R. The five data points per leaf sample from the LiCor 6400 photosynthesis system (E and gs ) were
aggregated using the median. LMERs were run with NO3 concentration as a continuous variable
(log-transformed and adding 0.1 to avoid log of 0). First, we built a global model for model selection
based on the Akaike Information Criteria corrected for sample size (AICc; Burnham [26], Table A2).
The global model included the main effects of experimental run (two-level factor) and light conditions
(two-level factor) and their two-ways interactions with both a linear and a quadratic term for NO3 .
Plant ID nested within Block was included as random intercept effects. In the model selection, all
possible subsets of this global model were included, keeping the random structure constant. A similar
approach was used to evaluate effects of nitrate concentration on plant biomass and root and shoot
tissue N content, except that the factor Light Conditions (and hence Plant ID) was not included as
measurements were performed only once at harvest. The residuals were tested for normality and
homogeneity of the distribution using Shapiro–Wilk test and QQ-plots. All analyses were performed
in R version 3.3.2 (R core Team, 2016).

3. Results and Discussion

3.1. Root Volume Experiments
      Only at final harvest, 35 days after sowing (DAS), shoot dry mass from large (3.5 L) root containers
was 10% higher than from the small (0.6 L) root containers (Table A3). Total plant dry mass from
the large containers was only 5% higher, reflecting a different Root:Shoot ratio. Root:Shoot ratio of
the container types already differed from 25 DAS onwards (Figure 2). The plants in the small root
containers accumulated more root biomass than the plants in the large root containers (Table A3).
However, before 35 DAS plant characteristics other than root biomass; i.e., plant total dry mass, leaf area,
plant water and nutrient content did not differ significantly between container sizes (Table A3).
      Daily in situ measurements of root growth conditions: dissolved oxygen content, pH, and electric
conductivity (EC) did not reveal significant differences between the root containers. However, it could
be that higher root density in the small containers created local micro environments with lower oxygen.
Peterson, et al., [27] reported a significant decline in root respiration capacity that correlated with
a reduction in root/shoot ratio of tomato plants that were grown in small root containers in a flow
through hydroponic system. But the study of Peterson, et al., [27] was done on tomato while lettuce is
known to generally handle reduced O2 very well, with a minimum dissolved oxygen concentration
for proper root respiration of 78 µmol·L−1 (30% saturation at 25 ◦ C) [28] and at least 125 µmol·L−1 is
recommended for optimum lettuce growth [29]; i.e., approximately 50% saturation at 25 ◦ C. Due to
constant aeration and nutrient solution circulation, the measured dissolved oxygen in our cultivation
system was always close to 100% O2 saturation (>250 µmol·L−1 ) and the nutrient solution was
stable. However, Poorter, et al., [30] reported, that even in the absence of symptoms of nutritional
imbalance, restricted hydroponically grown plants do show a decrease in photosynthesis and growth.
Although the reasons for this observation are unknown, it could be that the higher root density resulted
in locally lower nutrient concentrations in the inner parts of the root system. The fresh nutrient solution
was pumped in at the bottom of the container and most likely followed the path of least resistance
around the developing rooting system; thereby creating a relatively high local nutrient concentration
at the outside of the roots resulting in a more proliferated root system [31,32]. This response is also
observed in case of plant to plant competition [32].
      Another explanation in the direction of a competition response is that local root exudate
concentration (unmeasured) might have been higher in the small root compartment because of
higher root density, therewith triggering a competition response of increased root growth to capture
nutrient resources.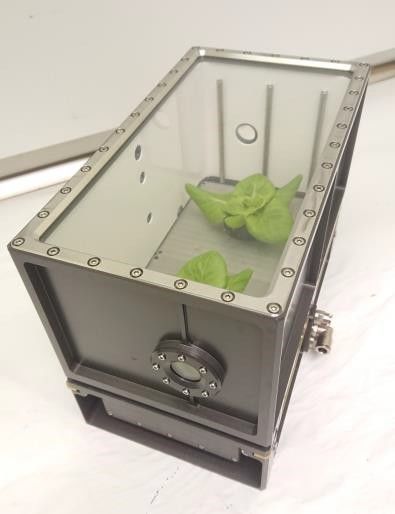
Life 2018, 8, 45                                                                                                            7 of 19

      Life 2018, 8, x FOR PEER REVIEW                                                                                       7 of 20
      Aside from signals in form of root exudates or nutrient concentration gradients, roots can respond
therefore,
to physicalintouching
               itself have
                        per caused
                             se [33]. the
                                      Thealternation
                                           boundariesin of root  shoot ratio
                                                            the limited  growthandenvironment
                                                                                    a more proliferated        rooting
                                                                                                   could, therefore,
system.
in itself have caused the alternation in root shoot ratio and a more proliferated rooting system.
      Currently there is no literature found that indicates the minimal or optimal root volume for
hydroponic water
hydroponic    water culture
                      culturesystems.
                               systems.Given
                                          Giventhat
                                                 thateventually
                                                      eventuallyatatfinal
                                                                      finalharvest
                                                                             harvest(35(35 DAS)
                                                                                         DAS)     shoot
                                                                                               shoot       fresh
                                                                                                       fresh     mass
                                                                                                               mass  in
in the
the    small
     small    root
           root    container
                container   was was
                                 10%10%   lower
                                       lower     than
                                              than    in the
                                                   in the     large
                                                          large     container,
                                                                 container,      an important
                                                                             an important        practical
                                                                                             practical        message
                                                                                                         message    for
for the
the      growers
     growers  thatthat
                   push push   toward
                          toward        an ever
                                   an ever       decreasing
                                             decreasing       rooting
                                                         rooting       volume
                                                                  volume         in vertical
                                                                            in vertical  farmsfarms   is athat
                                                                                                is that        a small
                                                                                                            small root
root compartment
compartment           can reduce
                can reduce         yields,
                              yields,       regardless
                                      regardless        of optimal
                                                  of optimal        supply
                                                               supply         of water,
                                                                       of water,          nutrients
                                                                                   nutrients         and oxygen.
                                                                                              and oxygen.

      Figure 2.2. (a)
                   (a)Total
                       Totalplant
                              plantdry
                                     drymass
                                          massandand
                                                   (b) (b)
                                                       Root:Shoot   ratioratio
                                                           Root:Shoot     per harvest, i.e., time
                                                                               per harvest,    i.e.,from
                                                                                                     timesowing,   of lettuce
                                                                                                          from sowing,     of
      plants
      lettuce grown     in the large
              plants grown      in the3.5 L (black
                                       large        bars) and
                                              3.5 L (black      small
                                                            bars) and 0.6  L (white
                                                                       small         bars) containers.
                                                                              0.6 L (white                 Means
                                                                                             bars) containers.     per time
                                                                                                                 Means    per
      point followed
      time point         by * differ
                    followed         significantly
                               by * differ          (p < 0.05).
                                           significantly         ErrorError
                                                          (p < 0.05).  barsbars
                                                                             represent the standard
                                                                                 represent              errorerror
                                                                                              the standard    (α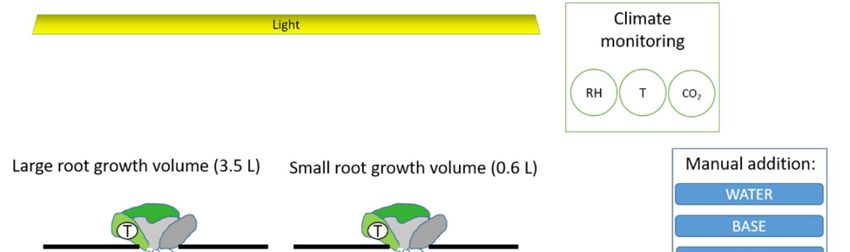
Life 2018, 8, 45                                                                                                8 of 19

3.3. Nitrate Concentration Experiments

3.3.1. Effects on Stomatal Conductance and Transpiration
      Nitrate concentration affected stomatal conductance (gs ) and leaf transpiration (E) in lettuce
plants grown in water culture (Table 2, Figures 3 and 4). The response was similar across Run 1 and 2,
but showed a different response under light and dark conditions (Table 2, Figures 3 and 4). During
the light period, both stomatal conductance and leaf transpiration increased rapidly when moving
from 0 to 1.25 mM NO3 , and then showed almost no response at concentrations above ~1.25 mM
(Figures 3 and 4). Under dark conditions, gs and E also increased from 0 to 1.25 mM, but less steeply
than under light conditions. The highest night time gs and night E was measured among plants
supplied with between 1.25 and 5 mM NO3 , and then declined with increasing NO3 concentrations
above 5 mM (Figures 3 and 4). Model selection included the 0 function (no effect of N dose), a linear
function and the quadratic function, with the quadratic function giving the best fit (Table A2). We run
a similar model selection for leaf photosynthesis versus nitrate concentration, and the top ranked
model suggested no effect of N dose on photosynthesis. Accordingly, there was only a tendency for
increased leaf photosynthesis when increasing nitrate concentration from zero to 1.25 mM (Figure A3).

      Table 2. Parameter estimates (β) and standard errors (SE) of fixed effects in the top-ranked linear mixed
      effects model of lettuce gas exchange responses to solution N concentrations. “Intercept” is the estimate
      for Run 2, under Dark conditions, and when log (NO3 concentration + 0.1) is zero. “Run 1” is the main
      effect of Run; i.e., the estimated difference from Run 2. “Light” is the main effect of light conditions;
      i.e., the estimated difference from Dark. The two parameters “NO3 concentration” and “NO3
      concentration ˆ 2” give the curvilinear (i.e., quadratic) response under Dark conditions, where “NO3
      concentration” is the slope when log (NO3 concentration + 0.1) is zero, and “NO3 concentration ˆ 2” is
      the curvature; i.e., the decrease in slope with increased concentration. “NO3 concentration: Light” is the
      difference in slope from Dark. Standard deviations (SD) and number of groups (n) are given for random
      effects on the intercept. 85 plants nested in 6 blocks (Run 1) and 8 blocks (Run 2) were measured.

                                         Conductance (gs )                    Transpiration (E)
               Fixed effects:                 β ± SE             P-value            β ± SE            P-value
        Intercept (i.e., Run 2, Dark)      0.12 ± 0.0078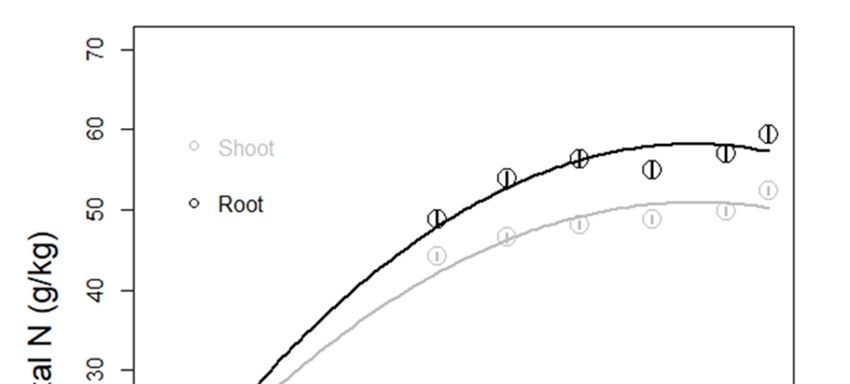
Life 2018, 8, 45 9 of 19
In addition, gs start to level off at 10 mM in maize while for lettuce it declines only slightly from
about 5 mM onwards, and shows a significant response to higher nitrate concentrations in dark only
(Figures 3 and 4). These differences could be explained by the nutrient depletion zone forming in the
soil rhizosphere interface [14,25], justifying a stronger response and slower down regulation of the
response when compared to soilless systems. Among the few reported studies of N concentration
Life 2018, 8, x FOR PEER REVIEW 9 of 20
effects in soilless culture, Senbayram, et al., [35] also reported increased night time gs among plants
supplied with NO3 concentrations between 3–5 mM compared to N deficient plants receiving 0–0.4 mM
Life 2018, 8, x FOR PEER REVIEW 9 of 20
NO3 . However, more research is required to fully understand the impact of night time regulation of
transpiration and stomatal conductance.
Figure 3. Effect of nitrate level on stomatal conductance in lettuce plants supplied with different
nitrate concentrations for one week. Stomatal conductance was measured under light (grey curve)
Figure 3. Effect of (black
and dark nitrate level
curve) on stomatal
conditions. conductance in lettuce plants = 14)supplied awith
modeldifferent
Figure 3. Effect of nitrate level on Circles
stomataland error bars represent
conductance in lettucemean (n supplied
plants ± SEwith
fromdifferent
nitrate concentrations
replacing
nitrate for oneforweek.
the continuous
concentrations NO Stomatal
one3 concentration
week. Stomatalconductance
(i.e., as covariate)
conductance was
with
was measured underunder
NO3 concentration
measured light as light
factor,
(grey (grey
and curve)
curve)
Experimental
and dark (black
and curve)
dark Run
(black as random
conditions.
curve) factor.
Circles
conditions. andand
Circles error
errorbars
bars represent mean
represent mean (n =(n
14)=±14) ± SE
SE from from a model
a model
replacing
replacing the the continuous
continuous NO3 concentration
NO3 concentration (i.e.,asascovariate)
(i.e., covariate) with
withNONO
3 concentration as factor, and
3 concentration as factor, and
Experimental Run as random factor.
Experimental Run as random factor.
Figure 4. Effect
Figureof4.nitrate
Effect ofconcentration of theofnutrient
nitrate concentration solution
the nutrient solutionononleaf
leaftranspiration
transpiration inin lettuce
lettuce plants
plants
supplied with different N concentrations for one week. Leaf transpiration was
supplied with different N concentrations for one week. Leaf transpiration was measured under light measured under light (grey
curve) and dark of
(black curve) conditions.of
Circlesnutrient
and error bars represent mean (n=14) ±SE from a plants
model
(grey curve)Figure
and 4. Effect
dark (blacknitrate concentration
curve) conditions.theCircles solution
and erroronbars
leaf represent
transpiration in lettuce
mean (n = 14) ±SE
replacingwith
supplied the different
continuous NO3 concentration
N concentrations for one(i.e., as Leaf
week. covariate) with NO
transpiration was3 concentration as factor, and
measured under light (grey
from a model replacingRun
Experimental theascontinuous
random NO3 concentration (i.e., as covariate) with NO3 concentration
curve) and dark (black curve) factor.
conditions. Circles and error bars represent mean (n=14) ±SE from a model
as factor, and Experimental Run as random factor.
replacing the continuous NO3 concentration (i.e., as covariate) with NO3 concentration as factor, and
Experimental Run as random factor.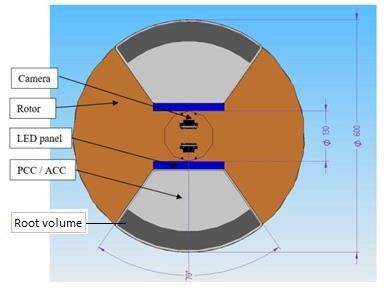
supplied with NO3 concentrations between 3–5 mM compared to N deficient plants receiving 0-0.4
mM NO3. However, more research is required to fully understand the impact of night time regulation
of transpiration and stomatal conductance.
To study the immediate NO3 response, before plants acclimated to the changes in NO3 level, Run
Life 2018, 8, 45 10 of 19
2 included measurements after 24 hours exposure to treatments. After 24 hours there was no effect of
nitrate concentration on stomatal conductance or transpiration (data not shown). However, small
To study the immediate NO3 response, before plants acclimated to the changes in NO3 level, Run 2
plant size and high variation between individual lettuce plants could have concealed the responses
included measurements after 24 hours exposure to treatments. After 24 hours there was no effect of
to the NO 3 treatments.
nitrate concentration on stomatal conductance or transpiration (data not shown). However, small plant
size and high variation between individual lettuce plants could have concealed the responses to the
3.3.2. Plant
NO3Biomass Response to NO3 Concentration
treatments.
Expectedly,
3.3.2. Plant nitrate
Biomass concentration
Response to NO3of the nutrient solution affected the biomass and the plants
Concentration
grown in theExpectedly,
zero NO3nitrate
treatments showed strong growth retardation. There was also a difference in
concentration of the nutrient solution affected the biomass and the plants
the response
grownbetween
in the zeroRun
NO31treatments
and 2, which
showedcan be explained
strong by the longer
growth retardation. duration
There was of Run 1inresulting
also a difference
in biggerthe
plants (Table
response A5,Run
between Figure
1 andA4). Model
2, which canselection and
be explained byparameter estimates
the longer duration from
of Run the top-ranked
1 resulting
in bigger plants (Table A5, Figure A4). Model selection and parameter estimates from
linear models for the effects of NO3 supply on lettuce plant shoot dry mass are shown in tables A4 the top-ranked
and A5,linear models for the effects of NO3 supply on lettuce plant shoot dry mass are shown in tables A4 and
respectively. In Run 2, the additional treatments (0 and 1.25 mM N) showed that shoot dry
A5, respectively. In Run 2, the additional treatments (0 and 1.25 mM N) showed that shoot dry mass
mass increased
increased strongly when
strongly when nitrate
nitrate concentration
concentration increasedincreased
from 0 N tofrom 0 N(Figure
1.25 mM to 1.255b),mM (Figure 5b),
however,
however, higher
higher nitrate
nitrate concentrations
concentrations did not
did not seem seem
to affect to affect
plant biomassplant biomass(Figure
accumulation accumulation
5). (Figure 5).
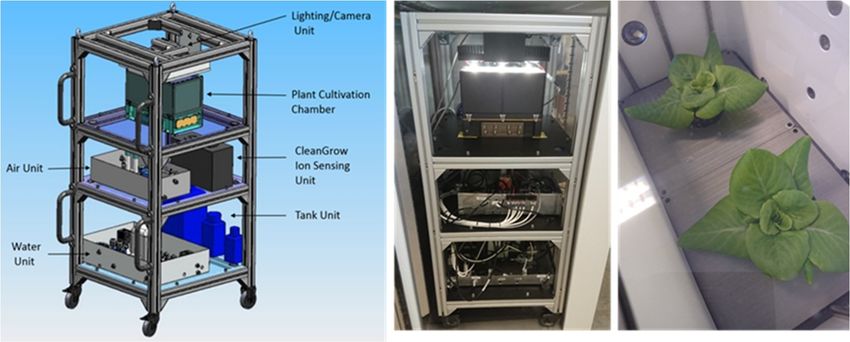
Figure 5. (a) Lettuce plants growing in separate growth containers with different nutrient solutions;
Figure 5. (a) Lettuce plants growing in separate growth containers with different nutrient solutions; (b) Effect
(b) Effect of nitrate level on lettuce shoot dry mass (from Run 2). Circles and error bars represent mean
of nitrate (n
level
= 8) on
± SElettuce
from a shoot dry mass
model replacing the(from Run NO
continuous 2). Circles and error bars represent mean (n = 8) ± SE
3 concentration (i.e., as covariate) with NO3
from a model replacing
concentration the continuous NO3 concentration (i.e., as covariate) with NO3 concentration as
as factor.
factor.
To check for potential confounding effects of individual plant biomass on plant water fluxes,
the shoot dry mass was added (in interaction with experiment run) in an initial global model.
Including individual plant shoot dry mass in the global model did not change the top ranked
model, confirming that the observed responses in plant water fluxes was not due to plant size.
Thus, plants supplied with nitrate concentrations as low as 1.25 mM did not show visible signs
of nutrient stress or growth reduction. This indicates that growing plants in water culture with
roots directly immersed in the nutrient solution allows for lower N concentrations than in systems
with solid growth media. Leaf area and leaf number responses were similar to biomass responses
(data not shown). For small scale closed cultivation systems for space, where water culture is the
preferred system [2,7] and where nutrient solution volumes are limited, this is good news as it makes
such systems more robust towards nutrient stress. Also, for terrestrial horticulture this indicates
that lowering the nitrate supply and reducing environmental impact could be implemented without
yield reduction.confirming that the observed responses in plant water fluxes was not due to plant size. Thus, plants
supplied with nitrate concentrations as low as 1.25 mM did not show visible signs of nutrient stress
or growth reduction. This indicates that growing plants in water culture with roots directly
immersed in the nutrient solution allows for lower N concentrations than in systems with solid
growth media. Leaf area and leaf number responses were similar to biomass responses (data not
Life 2018, 8, 45 shown). For small scale closed cultivation systems for space, where water culture is the preferred 11 of 19
system [2,7] and where nutrient solution volumes are limited, this is good news as it makes such
systems more robust towards nutrient stress. Also, for terrestrial horticulture this indicates that
lowering the nitrate supply and reducing environmental impact could be implemented without
3.3.3. N Amount in Plant Tissue
yield reduction.
The NO3 concentration in the nutrient solution affected the nitrogen content (measured as total
3.3.3. N Amount in Plant Tissue
N) in plant shoots and roots, generating a curvilinear response curve to N concentration in the nutrient
solution (TableTheA6,NO 3 concentration in the nutrient solution affected the nitrogen content (measured as total
Figure 6). There was also a difference between Run 1 and 2, with a different slope
N) in plant shoots and roots, generating a curvilinear response curve to N concentration in the
between the two runs. In Run 1, the initial error in nutrient solution formulation affected the tissue N
nutrient solution (Table A6, Figure 6). There was also a difference between Run 1 and 2, with a
concentration,
different slope between theof
making the slope theruns.
two curve hard
In Run 1, to
the interpret
initial error(Figure A5).
in nutrient In Run
solution 2, both root and
formulation
affected the tissue N concentration, making the slope of the curve hard
shoot N concentration rapidly increased when NO3 concentration in the nutrient solution to interpret (Figure A5). Inincreased
Run 2, both root and shoot N concentration rapidly increased when NO3 concentration in the nutrient
from 0 up to 2.5 mM, and then diminished (Figure 6). The N concentrations in tissues seem to level
solution increased from 0 up to 2.5 mM, and then diminished (Figure 6). The N concentrations in
off when supplied
tissues seemwith nitrate
to level concentrations
off when aboveconcentrations
supplied with nitrate 5 mM, strengthening the proposition
above 5 mM, strengthening the that N
assimilation in response
proposition that toN nitrate concentration
assimilation in response of
to the nutrient
nitrate solution
concentration is regulated
of the by a decrease
nutrient solution is in
night-time regulated
stomatalbyconductance
a decrease in night-time stomatal conductance and transpiration.
and transpiration.
Figure 6. Effects of nutrient solutions with varying NO3 levels for one week on N concentration in
Figure 6. Effects of nutrient solutions with varying NO3 levels for one week on N concentration in
shoot (grey)shoot
and(grey)
root and
(black) tissues
root (black) in lettuce
tissues plants
in lettuce plants(from Run2).2).
(from Run
3.4. Relevance for Future Crop Cultivation in Space
Previous experiments on the International Space Station (ISS) have proven water and nutrient
supply to be a challenging aspect of plant growth in space, and illustrated the need for upgraded water
and nutrient supply systems [3,8,36]. In TIME SCALE, new concepts for plant cultivation including
water culture and nutrient recycling have been developed that can be implemented e.g. in Biolab on the
ISS. In addition, the present study adds to the knowledge required for higher plant space cultivation in
two ways. Firstly by demonstrating that lettuce can be cultivated without signs of growth retardation
or nutrient stress within the volumes allowed on existing rotors. Secondly by adding to the knowledge
on NO3 regulation of plant water fluxes. Supplying plants with NO3 concentrations between 1.25 and
5 mM seems to increase stomatal conductance and transpiration, which would be beneficial under
reduced gravity conditions [18]. However, reported responses are highly variable between different
species [14], and the number of days a closed and confined cultivation system can support cultivation
varies with container size and species. For lettuce in our experimental setup, the maximum time would
be approximately 24 days. After 24 days the confounding effects of growth- and nutrient solution
volume might impact the gravitational treatment.
In addition, and with regard to the limitation on nutrient solution replenishment in remote
cultivation systems, the ability of lettuce to grow vigorously when supplied with N concentrations as
low as 1.25 mM indicates that water culture allows plants to better utilize the nutrients supplied and
thus making such systems less susceptible to nutrient stress.Life 2018, 8, 45 12 of 19
4. Conclusions
For space plant research both the confined environment and mass restriction favor recycling
of all resources. Soilless cultivation systems provide effective control in terms of nutrient solution
monitoring, adjusting, and recycling. The deep water culture with limited root- (0.6 L) and nutrient
solution volume (3.4 L per two plants) used in this study, provided stable and reliable plant growth and
high biomass production over a period of at least 24 days. Nitrate concentrations as low as 1.25 mM
did not reduce biomass and plant N content.
As expected, the absence of nitrate in the nutrient solution results in low transpiration (E) and
conductance (gs). When moving from zero to 1.25 mM the increase in E and gs was much steeper in
light than in dark. At concentrations above 1.25 mM, no response was detected in light, while night
time gs and night E decreased in response to nitrate concentrations above 5 mM.
Supplementary Materials: The following are available online at http://www.mdpi.com/2075-1729/8/4/45/s1,
Figure S1: Ion concentrations in nutrient solution volume experiment, Figure S2: Effects of nutrient solution
volume over time, Figure S3: EC and pH in nutrient solution volume experiment, Figure S4: Rosette growth model
Author Contributions: Conceptualization, S.A.W., S.H.v.D. and L.M.; Methodology, S.A.W., S.H.v.D. and C.F.P.;
Validation, S.H.v.D., A.I.K.J. and L.M.; Formal Analysis, S.A.W. and S.H.v.D.; Investigation, S.A.W., S.H.v.D.
and C.F.P.; Data Curation, S.A.W., S.H.v.D.; Writing-Original Draft Preparation, S.A.W., S.H.v.D., A.I.K.J.;
Writing-Review & Editing, L.M., S.H.v.D., A.I.K.J. and C.F.P.; Visualization, S.A.W. and S.H.v.D.; Supervision,
L.M.; Project Administration, S.A.W. and S.H.v.D.
Funding: This research was funded by the EU Horizon 2020 TIME SCALE project grant number 640231, NTNU
Samfunnsforskning AS, and Wageningen University Horticulture and Product Physiology (HPP).
Acknowledgments: We thank Brage B. Hansen for providing valuable input on the analyses, Gil Schramm for
his excellent work in the root volume and nutrient solution experiments, and the technical staff at Wageningen
University for support during the experiments.
Conflicts of Interest: The authors declare no conflict of interest.
Appendix A
Table A1. Nutrient solution formulation table for the nitrate concentration experiments.
N-NO3 Treatment P-H2 PO4 K Ca Mg S − SO4 Cl Si
30.00 1.50 13.90 7.00 2.30 0.50 0.00 0.50
20.00 1.50 13.90 7.00 2.30 3.50 4.00 0.50
10.00 1.50 13.90 7.00 2.30 7.00 7.00 0.50
5.00 1.50 13.90 7.00 2.30 8.63 8.75 0.50
2.50 1.50 13.90 7.00 2.30 9.50 9.50 0.50
1.25 1.50 13.90 7.00 2.30 9.88 10.00 0.50
0.00 1.50 13.90 7.00 2.30 10.33 10.35 0.50
Table A2. Model selection results for the effects of NO3 supply on lettuce plant water fluxes, showing
the top ranked models for (a) stomatal conductance and (b) transpiration. All models include plant ID and
block as random effects on the intercept. Cross indicates that the fixed effect was included in the model.
Model Rank Run NO3 NO3 ˆ2 Light Run:NO3 NO3 :Light NO3 ˆ2:Light AIC ∆AIC Loglik
(a) Conductance
1 + + + + + -622.4 0.00 320.76
2 + + + + + -620.3 2.08 320.85
3 + + + + + + -620.2 2.19 320.79
4 + + + + + + -620.1 2.25 320.77
5 + + + + + + -618.7 3.70 321.18
(b) Transpiration
1 + + + + + -119.5 0.00 69.32
2 + + + + + + -117.5 2.05 69.42
3 + + + + + -117.4 2.14 69.38
4 + + + + + + -117.3 2.18 69.36
5 + + + + + + + -116.0 3.54 69.82Life 2018, 8, 45 13 of 19
Table A3. Effects of a restricted rooting volume on several plant characteristics. Means are followed by their s.e. (n = 5). Means from the small root container (0.6 L)
followed by an asterisks (*) are significantly different from the large root container (3.4 L).
Days After Container.volume Root Dry Mass(g) Shoot Dry Mass(g) Total Dry Mass (g) Root:Shoot Leaf Area Specific Leaf
Biomass (%) #
Sowing (d) (L) [dry weight] [dry weight] [Plant dry weight] Ratio (cm2 ) Area (cm2 ·g−1 )
10 3.5 0.00218 ± 0.00 0.00670 ± 0.00 0.0089 ± 0.00 0.347 ± 0.01 3.08 ± 0.10 356 ± 10.7 8.30 ± 0.25
0.6 0.00218 ± 0.00 0.00670 ± 0.00 0.0089 ± 0.00 0.347 ± 0.01 3.08 ± 0.10 356 ± 10.7 8.30 ± 0.25
15 3.5 0.00935 ± 0.00 0.0393 ± 0.00 0.0486 ± 0.00 0.243 ± 0.02 18.1 ± 0.27 373 ± 8.23 6.48 ± 0.15
0.6 0.00868 ± 0.00 0.0366 ± 0.00 0.0453 ± 0.00 0.242 ± 0.01 17.2 ± 0.28 385 ± 13.8 6.61 ± 0.32
20 3.5 0.0424 ± 0.00 0.240 ± 0.02 0.283 ± 0.02 0.179 ± 0.00 113 ± 3.93 409 ± 12.3 5.91 ± 0.10
0.6 0.0363 ± 0.00 * 0.214 ± 0.02 0.250 ± 0.02 0.174 ± 0.01 102 ± 5.52 414 ± 9.85 5.88 ± 0.07
25 3.5 0.124 ± 0.00 1.07 ± 0.02 1.19 ± 0.02 0.117 ± 0.00 423 ± 6.88 356 ± 6.89 5.30 ± 0.11
0.6 0.133 ± 0.00 0.94 ± 0.04 1.07 ± 0.04 0.143 ± 0.00 * 389 ± 6.00 367 ± 10.8 5.48 ± 0.09
30 3.5 0.233 ± 0.00 3.02 ± 0.02 3.25 ± 0.01 0.0774 ± 0.00 984 ± 12.9 302 ± 3.83 5.12 ± 0.11
0.6 0.284 ± 0.00 2.84 ± 0.05 3.13 ± 0.05 0.1001 ± 0.00 * 982 ± 15.3 314 ± 2.89 4.98 ± 0.03
35 3.5 0.310 ± 0.02 6.06 ± 0.05 6.37 ± 0.03 0.0514 ± 0.00 1857 ± 35.5 291 ± 4.53 4.58 ± 0.03
0.6 0.386 ± 0.01 * 5.69 ± 0.06 * 6.07 ± 0.06 0.0680 ± 0.00 * 1698 ± 40.0 * 279 ± 4.04 4.86 ± 0.05
# Percentage of dry biomass of the total fresh weight.
Table A4. Model selection results for the effects of NO3 supply on lettuce plant shoot dry mass, showing the top ranked models with a ∆AICLife 2018, 8, 45 14 of 19
Table A5. Parameter estimates from the top-ranked linear mixed effects model of lettuce shoot dry
mass in response to nutrient solution N concentrations. Solution N concentration was log transformed
(adding 0.1) in the analysis. Standard deviations (SD) and number of groups (n) are given for random
effects on the intercept. 85 plants nested in 6 (Run 1) and 8 blocks (Run 2) were measured.
Shoot Dry Mass (g)
Fixed effects: β±SE p-value
Intercept 1.23±0.043Life 2018, 8, 45 15 of 19
Life 2018, 8, x FOR PEER REVIEW 16 of 20
(a)
Plant cultivation chamber (PCC) dimensions
PCC total volume (litre) 10.35
PCC dimension (mm)
170 x 300 x 215
With x Length x Height
Shoot growth volume (litre) 5. 21
Root growth total volume (l) 3.6
Root growth compartment
2 x 0.77
volume (l)
(b)
Figure
FigureA1.Dimensions
A1. Dimensions of: of:
(a) Space centrifuge
(a) Space rotorrotor
centrifuge impression for future
impression space space
for future hardware development
hardware
bydevelopment
DTM technologies and (b) plant cultivation chamber (PCC) developed by CMR
by DTM technologies and (b) plant cultivation chamber (PCC) developed by CMR Prototech for
ground testing.
Prototech for ground testing.Life 2018, 8, x FOR PEER REVIEW 17 of 20
Life 2018, 8, 45 16 of 19
Figure A2. Schematic representation of (a) root and (b) nutrient volume experiment.
(a)
(b)
Legend:
Circles with letter refer to sensors where T = temperature, pH = acidity, EC = electro
conductivity, O2 = dissolved oxygen, CO2 = carbon dioxide, RH = relative humidity
Pump
Figure A2. Schematic representation of (a) root and (b) nutrient volume experiment.Life
Life2018,
2018,8,8,xxFOR
FORPEER
PEERREVIEW
REVIEW 18
18of
of20
20
Life 2018, 8, 45 17 of 19
A3. Effect
Figure Figure of nitrate concentrationofofthethe nutrient solution on photosynthesis in lettuce plants
Figure A3.
A3. Effect
Effect of
of nitrate
nitrate concentration
concentration of the nutrient
nutrient solution
solution on on photosynthesis
photosynthesis in
in lettuce
lettuce plants
plants supplied
supplied
supplied with
with
with different
different
different N N concentrations
N concentrations
concentrations for one for
for one one
week.
week. week.
Data
Data shown
shownData shownmeasurements
represent
represent represent measurements
measurements performed
performed during
duringperformed
light
light
during conditions.
conditions.
light Circles
Circles and
conditions. and error bars
bars represent
error and
Circles represent
error mean
barsmean (n
(n == 14)
represent ±± SE
14)mean SE from
(n =aa14)
from model
model replacing
± SE from athe
replacing the continuous
continuous
model NONO33 the
replacing
concentration
concentration(i.e.,
(i.e.,as
ascovariate)
covariate)with
withNO NO33concentration
concentrationasasfactor,
factor,and
andExperimental
ExperimentalRun
Runas asrandom
randomfactor.
factor.
continuous NO3 concentration (i.e., as covariate) with NO3 concentration as factor, and Experimental
Run as random factor.
FigureLife
A4.
FigureEffect
2018,A4.
Figure A4. of nitrate
8, xEffect
FOR of
Effect level
of nitrate
nitrate
PEER level
level
REVIEW
ononlettuce
on lettuce shootdry
lettuce shoot
shoot dry
dry mass
mass
mass for for Experimental
for Experimental
Experimental Runs Runs
Runs 11 (black 1 (black
(black curve)
curve) andcurve)
and (grey19and
22 (grey of 20
2 (grey curve).
curve).
curve). Circles
Circles
Circles and error
andand bars
bars represent
errorerror parameter
bars represent
represent parameter estimates
estimates and
parameter standard
estimates
and errors
standardand from
from aa model
standard
errors errors
model replacing
from athe
replacing model
the
continuous
continuous NO
NO33concentration
concentration (i.e.,
(i.e.,as
ascovariate)
covariate) with NO
withasNO 33concentration
concentration as
asfactor.
factor.concentration as factor.
replacing the continuous NO3 concentration (i.e., covariate) with NO 3
(a) (b)
Figure
FigureA5.A5. Effects ofnutrient
Effects of nutrient solutions
solutions with
with varying
varying NO3 levels
NO3 levels for onefor one
week onweek on N concentration
N concentration in
in (a) roots and
(a)(b)roots
shootand (b) in
tissues shoot tissues
lettuce inCircles
plants. lettuceand
plants. Circles
error bars and error
represent bars represent
parameter parameter
estimates and standardestimates
errors from
a model
and replacing
standard the
errors continuous
from a model NO 3 concentration
replacing (i.e., as covariate)
the continuous with NO3 concentration
NO3 concentration as factor. with
(i.e., as covariate)
NO3 concentration as factor.
References
1. Clauwaert, P.; Muys, M.; Alloul, A.; De Paepe, J.; Luther, A.; Sun, X.; Ilgrande, C.; Christiaens, M.E.R.; Hu,
X.; Zhang, D.; et al. Nitrogen cycling in bioregenerative life support systems: Challenges for waste refinery
and food production processes. Prog. Aerosp. Sci. 2017, 91, 87–98.
2. Paradiso, R.; De Micco, V.; Buonomo, R.; Aronne, G.; Barbieri, G.; De Pascale, S. Soilless cultivation of
soybean for bioregenerative life-support systems: A literature review and the experience of the melissaLife 2018, 8, 45 18 of 19
References
1. Clauwaert, P.; Muys, M.; Alloul, A.; De Paepe, J.; Luther, A.; Sun, X.; Ilgrande, C.; Christiaens, M.E.R.; Hu, X.;
Zhang, D.; et al. Nitrogen cycling in bioregenerative life support systems: Challenges for waste refinery and
food production processes. Prog. Aerosp. Sci. 2017, 91, 87–98. [CrossRef]
2. Paradiso, R.; De Micco, V.; Buonomo, R.; Aronne, G.; Barbieri, G.; De Pascale, S. Soilless cultivation of
soybean for bioregenerative life-support systems: A literature review and the experience of the melissa
project - food characterisation phase i. Plant Biol. 2014, 16, 69–78. [CrossRef] [PubMed]
3. Wolff, S.A.; Coelho, L.H.; Zabrodina, M.; Brinckmann, E.; Kittang, A.I. Plant mineral nutrition, gas exchange
and photosynthesis in space: A review. Adv. Space Res. 2013, 51, 465–475. [CrossRef]
4. Wheeler, R.M.; Stutte, G.W.; Sobarrao, G.V.; Yorio, N.C. Plant growth and human life support for space
travel. In Handbook of Plant and Crop Physiology; Pessarakli, M., Ed.; Marcel Dekker: New York, NY, USA,
2001; pp. 925–941.
5. Wheeler, R.M. Agriculture for space: People and places paving the way. Open Agric. 2017, 2, 14–32. [CrossRef]
6. Wolff, S.A.; Coelho, L.; Karoliussen, I.; Jost, A.I.K. Effects of the extraterrestrial environment on plants:
Recommendations for future space experiments for the melissa higher plant compartment. Life 2014, 4, 189–204.
[CrossRef] [PubMed]
7. Wolff, S.A.; Coelho, L.; Hauan, T.M.; Kittang Jost, A.I.; Aronne, G. Water Management in Space-Examples of
Hydration Systems for Cultivation in Microgravity and Future Prospects; International Society for Horticultural
Science (ISHS): Leuven, Belgium, 2018; pp. 45–52.
8. Kittang, A.I.; Iversen, T.H.; Fossum, K.R.; Mazars, C.; Carnero-Diaz, E.; Boucheron-Dubuisson, E.;
Le Disquet, I.; Legué, V.; Herranz, R.; Pereda-Loth, V.; et al. Exploration of plant growth and development
using the european modular cultivation system facility on the international space station. Plant Biol.
2014, 16, 528–538. [CrossRef] [PubMed]
9. Zabel, P.; Bamsey, M.; Schubert, D.; Tajmar, M. Review and analysis of over 40 years of space plant growth
systems. Life Sci. Space Res. 2016, 10, 1–16. [CrossRef] [PubMed]
10. Gisela, D.; Belz, S.; Bretschneider, J.; Ewald, R.; Fasoulas, S. A hybrid life support system for a moon base. In 68th
International Astronautical Congress (IAC); International Astronautical Congress: Adelaide, Australia, 2017.
11. Gisela, D.; Belz, S.; Bretschneider, J.; Jost, A.I.K.; Jakobsen, Ø.M. Design of a test platform for algae cultivation
research at different gravitation levels. In Proceedings of the 48th International Conference on Environmental
Systems, Albuquerque, New Mexico, 8–12 July 2018.
12. Graham, T.; Wheeler, R. Root restriction: A tool for improving volume utilization efficiency in bioregenerative
life-support systems. Life Sci. Space Res. 2016, 9, 62–68. [CrossRef] [PubMed]
13. Forde, B.; Lorenzo, H. The nutritional control of root development. Plant Soil 2001, 232, 51–68. [CrossRef]
14. Cramer, M.D.; Hawkins, H.J.; Verboom, G.A. The importance of nutritional regulation of plant water flux.
Oecologia 2009, 161, 15–24. [CrossRef] [PubMed]
15. Matimati, I.; Verboom, G.A.; Cramer, M.D. Nitrogen regulation of transpiration controls mass-flow
acquisition of nutrients. J. Exp. Bot. 2014, 65, 159–168. [CrossRef] [PubMed]
16. Wilkinson, S.; Bacon, M.A.; Davies, W.J. Nitrate signalling to stomata and growing leaves: Interactions with
soil drying, aba, and xylem sap ph in maize. J. Exp. Bot. 2007, 58, 1705–1716. [CrossRef] [PubMed]
17. Kupper, P.; Rohula, G.; Saksing, L.; Sellin, A.; Lohmus, K.; Ostonen, I.; Helmisaari, H.S.; Sober, A. Does soil
nutrient availability influence night-time water flux of aspen saplings? Environ. Exp. Bot. 2012, 82, 37–42.
[CrossRef]
18. Porterfield, D.M. The biophysical limitations in physiological transport and exchange in plants grown in
microgravity. J. Plant Growth Regul. 2002, 21, 177–190. [CrossRef] [PubMed]
19. Tibbitts, T.W. Humidity and plants. Bioscience 1979, 29, 358–363. [CrossRef]
20. Conroy, J.; Hocking, P. Nitrogen nutrition of C-3 plants at elevated atmospheric CO2 concentrations.
Physiol. Plantarum. 1993, 89, 570–576. [CrossRef]
21. McGrath, J.M.; Lobell, D.B. Reduction of transpiration and altered nutrient allocation contribute to nutrient
decline of crops grown in elevated CO2 concentrations. Plant Cell Environ. 2013, 36, 697–705. [CrossRef]
[PubMed]
22. Kudoyarova, G.R.; Dodd, I.C.; Veselov, D.S.; Rothwell, S.A.; Veselov, S.Y. Common and specific responses to
availability of mineral nutrients and water. J. Exp. Bot. 2015, 66, 2133–2144. [CrossRef] [PubMed]You can also read