Genesis, controls and risk prediction of H2S in coal mine gas - Nature
←
→
Page content transcription
If your browser does not render page correctly, please read the page content below
www.nature.com/scientificreports
OPEN Genesis, controls and risk
prediction of H2S in coal mine gas
Weidong Xie1,2, Hua Wang1,2, Meng Wang3* & Ye He3
Abnormal H2S concentration in coal mine gas is a serious threat to normal mining activities, which
has caused serious loss of life and property in many coal mines. This study explores the genesis and
influencing factors of abnormal H2S concentration in coal mine gas, taking the Xishan coal mine
in the Fukang mining area as a case study. The H2S formation by bacterial sulfate reduction (BSR)
is simulated with a bacterial culture experiment and that by thermochemical sulfate reduction
(TSR) is simulated with a thermal reduction experiment. The potential for a magmatic genesis is
assessed using data regarding the tectonic evolution and history of magma intrusion in the study
area. The factors influencing H2S formation and enrichment are then analyzed by a comprehensive
consideration of the characteristics of coal, the gas composition, the coal seam groundwater
geochemistry and other geological factors in the study area. The results show that the study area
meets the necessary conditions for the BSR process to operate and that there is widespread BSR
derived H2S. TSR genesis H2S mainly forms in coal fire areas and their vicinity, while there is little
contribution from magmatically formed H2S. The concentration of H2S is negatively correlated with
the buried depth of the coal seam, the concentrations of CH4, N2 and CO2, and the ash yield; and it
is positively correlated with the volatiles yield and total sulfur content. In addition, in areas with
abnormally high H2S concentration, the concentration of SO42− is obviously lower, HCO3− + CO32−
concentration is higher, and the HCO3−/SO42− value is larger than that in non-anomalous areas.
Geologically, H2S enrichment is found to be controlled by lithology, tectonism, and hydrogeological
conditions. Moreover, the results of predictive modeling show that areas prone to abnormal H2S
concentration are generally spatially correlated with coal fire areas. In this study, the genetic types of
H2S and the factors controlling their formation and retention are discussed, producing research results
that have guiding significance for the prediction and prevention of the coal mine disasters that arises
from abnormal H2S concentration.
H2S is a colorless, highly toxic gas with an unpleasant odor. The Chinese "Coal Mine Safety Regulations" states
that the H2S concentration of coal mine gas is considered abnormal if it concentration is greater than 6.6 ppm1–3.
Such concentrations present a serious threat to life and property in well mines due to the risk of H2S outburst3–6.
In recent years, more than 10 people have died in H2S disasters in mines in Xinjiang, Sichuan, Hunan, Chongqing
and elsewhere in China, and H2S poisoning incidents have led to shutdowns in Shandong, Shanxi and Henan
provinces4–7,22. The strong odor of rotten eggs appeared in many of the main coal seams during the exploration
and mining of the Xishan coal mine in the Fukang mining area, Urumqi, indicating that there is a potential risk
of abnormal concentration of H 2S, and the H 2S disasters have ever resulted in both poisonings and fatalities. The
resulted in the loss tens of thousands of day production during suspensions and seriously affected the safety of
production8–10. It is essential to determine the genesis and controlling factors of abnormal H2S concentration as
theoretical principles on which to base H2S-disaster prevention and control measures in mining areas. It is gener-
ally believed that the genesis of H 2S in coal mines can be divided into four main types: bacteria sulfate reduction
(BSR), thermochemical sulfate reduction (TSR), thermochemical thermal destruction of sulfur compounds
(TDS) and magmatism,which of this genetic types dominates depends on geological setting6,9,11–16. Previous
researches have indicated that the enrichment rule of H2S is similar to that of coal bed methane, being controlled
by geological structure, the roof and floor lithology, hydrogeological conditions, and other factors7,11,17–23. A
certain progress has been made in research into H2S disasters in coal mines in recent years, nevertheless, several
key problems still require urgent consideration. For example, more research work is needed on the simulation,
detailed characterization and identification of the factors influencing the formation process of H 2S in coal mines.
1
Key Laboratory of Tectonics and Petroleum Resources of Ministry of Education, China University of Geoscience,
Hubei 430074, Wuhan, China. 2School of Earth Resources, China University of Geoscience, Hubei 430074,
Wuhan, China. 3School of Resources and Earth Geosciences, China University of Mining and Technology, Jiangsu,
Xuzhou 221116, China. *email: wangm@cumt.edu.cn
Scientific Reports | (2021) 11:5712 | https://doi.org/10.1038/s41598-021-85263-w 1
Vol.:(0123456789)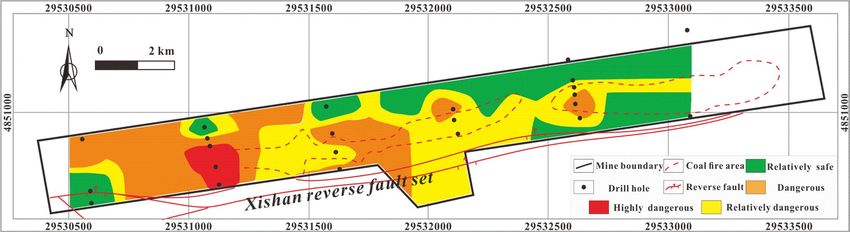
www.nature.com/scientificreports/
Figure 1. The structural position of the Xishan mine.
This study aimed to address these deficiencies in the literature by taking the Xishan mine as its research area,
taking the physical characteristics of coal, geochemical conditions and other geological factors as its variables,
and taking experimental simulation and theoretical analysis as its means, to reveal the genesis and controlling
factors of H2S abnormal concentration in the study area. Moreover, it establishes a corresponding model, to
predict the region in which abnormally H2S concentrations will develop, aiming to address the threat to safe
production from H 2S anomalies in both theoretical and practical aspects.
Samples, experiments and theory
Sample collection. Xishan mine belongs to the Fukang mining area, Urumqi, western China Fig. 1. Sixteen
matched coal and sixteen gas samples were collected from different buried depths for this study. The coal sam-
ples were characterized by block integrity and macro coal components, which can reduce the error caused by the
components discrepancies of coal samples. The samples were sealed and transported to the laboratory imme-
diately. Gas samples were collected by air bag (Polyvinyl chloride bag) method. The vacuum sealing bags were
carried to mining face underground, and the gas samples were collected, sealed and immediately transported to
the laboratory. In addition, ten groundwater samples were collected from coal seams (XJ-S10 and XJ-S9 from B7,
XJ-S8 and XJ-S7 from B8 coal seam, XJ-S6 and XJ-S5 from B11 coal seam, XJ-S4 from B12 coal seam, XJ-S3 from
B14 coal seam, XJ-S2 from B 15 coal seam, and XJ-S1 from B
18 coal seam). Among them, four of these were from
normal areas and six from areas with abnormal H2S concentration.
Experimental scheme. Basic data acquisition. Sixteen gas samples were tested by gas chromatography,
and their gas composition was analyzed with an HP5890A high-sensitivity gas chromatograph produced by
Hewlett-Packard, USA. The quality of sixteen coal samples was analyzed, and the industrial composition of
each coal seam was tested. These experiments were carried out at the Jiangsu Institute of Geology and Mineral
Resources using standards GB/T 30431-2013 and GB212-91, respectively. The ion composition, acidity, and
alkalinity of the 10 coal seam groundwater samples were tested at Xinjiang Coal Design and Research Insti-
tute to characterize their geochemical characteristics, using ICS900 ion chromatograph manufactured by Diane
company, America.
Simulation of BSR‑genesis H2S. Sulfate-reducing bacteria (SRB) enrichment and culture experiments were car-
ried out on groundwater samples (Sample XS-10 from the abnormal area of H2S concentration and sample XS-1
from the normal area of H2S concentration) from coal seams in area with normal and abnormal H2S concentra-
tions. The culture medium comprised 4.5 g Na2SO4, 1 g NH4Cl, 0.5 g K2HPO4, 0.2 g MgSO4·7H2O, 0.06 g CaCl2,
0.1 g yeast extract, 1000 mL distilled water, and 3 mL sodium lactate. Its pH ranged from 6.5 to 7.2, a weakly
alkaline environment. The culture medium was placed in a sterilizing pot for 20 min at a pressure of 0.2 MPa,
and a temperature 121 °C; after which the sterilizing pot and the bacterial culture medium were cooled to room
temperature. FeSO4·7H2O 0.5 g was then added to the culture medium, and the pot was then filled with N2 for
30 min.
Scientific Reports | (2021) 11:5712 | https://doi.org/10.1038/s41598-021-85263-w 2
Vol:.(1234567890)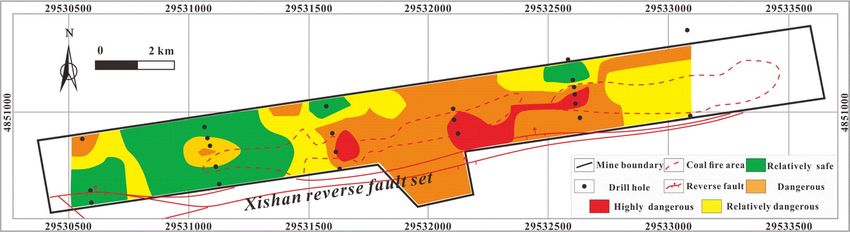
www.nature.com/scientificreports/
Gas content (cm3/g, ad) Gas composition (mol%) Coal quality (wt.%)
Coal seam ID Buried depth (m) CH4 CO2 N2 H2S CH4 CO2 N2 H2S Mad Vdaf Ad St.d
B7 411.61 4.51 0.85 4.65 0.15 44.36 8.41 45.73 1.5 1.05 23.97 14.05 0.41
B7 416.65 5.41 1 2.35 0.12 60.95 11.29 26.44 1.32 1.49 24.07 15.47 0.29
B7 419.32 3.54 0.67 5.33 0.13 36.84 6.92 55.4 1.4 1.32 34.85 16.31 0.35
B8 242.79 2.18 0.61 1.97 0.16 43.25 12.21 39.2 3.1 2.05 30.7 16.77 0.21
B8 250.18 3.16 0.76 5.11 0.53 31.06 7.46 50.22 5.24 1.36 34.26 21.01 0.71
B8 255.66 2.67 0.71 3.19 0.3 37.3 9.89 44.58 4.14 1.71 32.44 18.84 0.46
B12 167.3 1.52 0.26 2.68 0.93 25.36 4.4 44.51 15.51 1.31 38.5 16.51 0.95
B12 515.9 2.75 0.71 4.67 0.22 31.91 8.23 54.28 2.53 1.54 35.42 20.5 0.59
B12 516.2 2.15 0.48 3.71 0.68 28.64 6.32 49.4 9.02 1.43 36.96 18.51 0.77
B14 123.08 1.62 0.38 3.97 0.32 24.73 5.75 60.73 4.9 1.5 33.1 17.03 0.82
B14 361.03 1.34 0.68 6.22 0.4 16.33 8.32 75.92 4.9 1.15 35.73 12.65 0.72
B15 328.68 3.65 0.39 1.13 0.67 51.32 5.52 15.91 9.37 1.61 38.97 5.78 0.69
B15 103.13 0.47 0.28 2.99 0.03 11.08 6.6 70.89 0.6 1.77 41.12 28.99 1.27
B15 155.8 1.79 0.36 2.66 0.28 30.14 6.09 44.85 4.75 1.69 40.1 18 0.75
B11 172.01 2.75 0.26 2.63 0.36 33.79 3.14 32.38 4.43 1.28 34.94 6.22 0.69
B18 347.72 5.94 2.14 4.75 0.48 38.22 13.77 30.59 3.1 1.75
Table 1. Gas composition and the results of coal quality analysis. ad air-dried basis, Mad moisture of air-dried
basis, Vdaf volatile of dry ash-free basis, Ad ash of dry basis, St.d total sulfur of dry basis.
A mixture of 2/3 volume culture medium and 1/3 coal seam groundwater from a normal and abnormal area
were placed in two 1000 ml culture bottles, respectively, and cultured in a water bath at a constant temperature
of 37 °C. When the water sample bottles were opened during the experiment, the strong odor of strong rotten
eggs characteristic of H2S was emitted by bottles incorporating groundwater from H2S abnormal areas, and the
liquid in the bottle rapidly turned black. After having been left to stand for one day, a solid black precipitate
was found at the bottom of the bottle, while no obvious odor or experimental phenomena were observed in the
culture bottle samples for the normal area. The redox potential and pH value of the culture solution in the bottle
were measured every day. After the third day, there was an obvious slowdown in the reaction process.
Subsequent tests were carried out on the bacterial communities in the two types of culture bottles, includ-
ing macro genome and 16 rDNA sequencing (V3-V4 amplification region; Miseq Miseq × 300 bp sequencing
platform) and analysis by PHI5000 Versaprobe III X-ray photoelectron spectroscopy (XPS, manufactured by
ULVAC company, Japan) of the solid sediments metabolized by bacteria. The relevant experiments were carried
out at Shanghai Biotechnology Services Co., Ltd.
Simulation of TSR‑genesis H2S. In order to explore the formation conditions and process of TSR-genesis H2S,
experiments were conducted to simulate the thermal reduction of H 2S. Coal samples (Which collected from the
main mining coal seam, B 8 coal seam with a buried depth of 242.79 m) and M gSO4, NaCl and deionized water
were added to a fully enclosed autoclave reaction system. Eight temperature points were set in the experiment:
250 °C, 300 °C, 350 °C, 400 °C, 450 °C, 500 °C, 550 °C and 600 °C. The temperature was raised to the designated
temperature point at a rate of 20 °C/h and was kept at each temperature point for 48 h. After the reaction had
occurred, the gas was collected, and the H2S concentration was determined with a chromatograph.
Results
Basic experimental data. The results of gas chromatography and coal quality analysis are shown in
Table 1. The sampling depth ranged from 237 to 364 m, and the main components of the gas samples were CH4,
CO2, N2, and H2S. The concentration of CH4 ranged from 11.08% to 60.95%, with an average of 30.48%, the con-
centration of CO2 ranged from 4.4% to 13.77%, with an average of 7.77%, the concentration of N2 ranged from
15.91% to 75.92%, with an average of 46.32%, and the concentration of H2S ranged from 0.6% to 15.51%, with
an average of 4.74%. The moisture content ranged from 1.05% to 2.05%, with an average of 1.48%, the volatile
yield ranges from 23.97% to 41.12%, with an average of 34.34%, the ash yield ranged from 14.05% to 28.99%,
with an average of 16.44%, and the total sulfur content ranged from 0.21% to 1.75%, with an average of 0.71%.
The geochemical characteristics of the coal seam groundwater samples are shown in Table 2. The pH value
of the water samples ranged from 6.95 to 8.3, with an average of 7.59, SO42− content ranged from 237.08 mg/L to
6676.2 mg/L, with an average of 2179.77 mg/L, HCO3− + CO32− content ranged from 137.42 mg/L to 1888 mg/L,
with an average of 682.82 mg/L. The concentration of S O42− ion ranged from 17.12% to 88.30%, with an average
of 55.69%, H CO3− + CO32− ion concentration ranged from 1.61% to 54.75%, with an average of 22.38%, and the
value of γHCO3−/γSO42− ion ranges from 4.92% to 182.48%, with an average of 60.72%.
Scientific Reports | (2021) 11:5712 | https://doi.org/10.1038/s41598-021-85263-w 3
Vol.:(0123456789)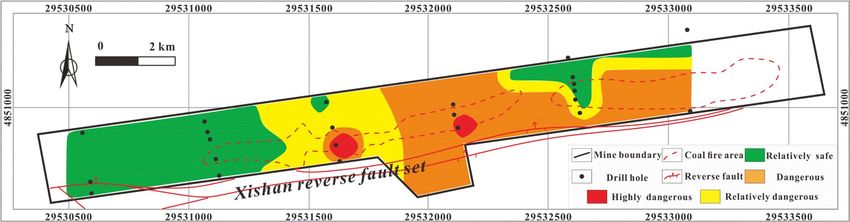
www.nature.com/scientificreports/
Percentage of ion concentration
SO42− HCO3− + CO32− γHCO3−/γSO42−
Sample ID mg/L % mg/L % % pH H2S concentration
XJ-S1 6676.2 85.12 503.4 6.42 5.94 8.1
XJ-S2 2497.6 75.85 562.6 17.09 17.73 8.3
Normal
XJ-S3 4841.4 73.18 1003.2 12.47 16.31 7.95
XJ-S4 2198.36 88.30 137.42 1.61 4.92 7.8
XJ-S5 1717.2 66.77 399.74 31.35 36.93 7.29
XJ-S6 598.47 57.64 806.26 31.35 52.54 7.29
XJ-S7 237.08 29.78 435.87 54.75 135.6 7.37
Abnormal
XJ-S8 998.71 39.55 525.71 20.82 58.01 7.6
XJ-S9 1537 17.12 1888 21.03 96.69 6.95
XJ-S10 495.67 23.58 565.95 26.92 182.48 7.22
Table 2. Hydrogeological characteristics of coal seam water.
Figure 2. The peak spectrum of S of the black solid in the culture bottle with sample XS-10.
Experimental simulation of BSR‑genesis H2S. The experiment simulation of BSR indicated that the
culture bottle containing groundwater from abnormal area promoted the formation H2S; and that SRB activity
was strongest when the temperature was less than 50 °C and the pH conditions were neutral or weakly alkaline.
The results of macro genome and 16 rDNA sequencing showed that sulfate reducing bacteria (SRB) in the
abnormal-area bottle included a large number of Desulfovibrio and Desulfomicrobium in two genera but that
there were few methane-reducing bacteria. Thus it is inferred that the formation of BSR-genesis H 2S was mainly
promoted by Desulfovibrio and Desulfomicrobium. While a large number of methane-reducing bacteria were
detected in the normal-area bottle, there were very few SRB. The similarity between the experimental results and
the NCBI (National Center for Biotechnology Information) database was 95%-99%. The composition state of S
in the black solid in the abnormal-area culture bottle was investigated by XPS narrow scanning surface analysis
Fig. 2. The detection data were processed by XPS peak-separation software, and the binding energy was found
to peak at 161.2 eV, indicating that the black precipitate was FeS. Namely, S6+ in SO42− was reduced to S2− by SRB
and combined with Fe2+ to form the solid black sediment.
Experimental simulation of TSR‑genesis H2S. The degree of reaction was closely related to tempera-
ture in the TSR genesis simulation. When the temperature was between 250 °C and 350 °C, the H 2S concentra-
tion in the reactor was less than 0.1% Fig. 3. The concentration increased slowly with an increase in temperature.
When the temperature was between 350 °C and 600 °C, the rate of increase in H2S concentration with tempera-
ture increased, causing the slope of the curve to steepen obviously. It is suggested that when the temperature was
relatively low in the 250–350 °C stage, H 2S mainly formed through the decomposition of organic sulfur in the
coal into H2S in coal, and the TSR reaction was relatively weak. It is speculated that less H2S was produced at
this stage, controlled by the total sulfur content in coal seam Table 1. In the 350–600 °C range, the TSR reaction
became dominant, and the amount of H2S gas in the reactor increased rapidly, reaching a maximum value of
0.38% at 600 °C.
Discussion
H2S genesis. BSR genesis. BSR requires three basic material conditions: organic matter, a sulfur source,
and SRB. The main reaction processes proceed according to Eqs. (1) and (2)6,24–27.
Scientific Reports | (2021) 11:5712 | https://doi.org/10.1038/s41598-021-85263-w 4
Vol:.(1234567890)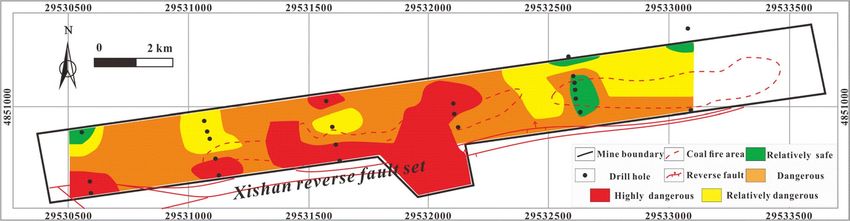
www.nature.com/scientificreports/
Figure 3. Correlation between temperature and H2S concentration.
2C + SO2− −
4 + 2H2 O → H2 S + HCO3 (1)
2H2 S + Fe2+ → FeS2 + 2 H+ (2)
The geochemical results for the coal seam water geochemistry show that the water samples were rich in
SO42−, the bacterial culture experiments showed abundant SRB in the groundwater from the abnormal areas,
and aggregated organic matter is available in the form of coal. Thus, the material conditions in the study area
meet the requirements for BSR action. Apart from in coal fire areas, the temperature of the coal seam is gener-
ally lower than 50 °C, and the pH value of the water is between 6.8 and 8.4, conditions under which SRB have
strong activity. The above analysis suggests that BSR genesis is one of the main causes of certain regions having
abnormal concentrations of H 2S in the study area.
TSR genesis. Three basic material conditions are also needed for TSR: organic matter, a sulfur source, and a
temperature of coal thermal evolution of more than 90 °C, corresponding to a thermal maturity of organic mat-
ter (Ro) greater than 1.2%, approximately a coal rank above coking coal. The main reaction processes involved
are shown in Eqs. (3) and (4)6,23,28–30.
2C + CaSO4 + H2 O → CaCO3 + H2 S + CO2 (3)
CH + CaSO4 → CaCO3 + H2 S + H2 O (4)
The Ro of the coal in the study area ranges from 0.506% to 0.819%, corresponding to a coal rank dominated
by gas coal and gas-fertilized coal. The maximum temperature corresponding to this thermal evolution stage is
less than 90 °C. Thus, generally, conditions are not appropriate for the formation of H2S via TSR. However, due
to the exposure conditions of the coal seam in the study area, it undergoes ubiquitous spontaneous combustion,
and many such areas are still burning now. Especially in the middle part of the coalfield, the coal seam thickness
is large and spontaneous combustion is serious (areas delineated with red dotted lines in Figs. 10–17. Most of the
spontaneous combustion occurs at depth of less than 100 m, 226.80 m at a maximum. Spontaneous combustion
in a coal seam bakes the surrounding rock at high temperature, causing metamorphism and deformation, and
also emits heat and energy to the surroundings. Enough heat (The temperature of coal fire area is higher than
600 °C) is generated by spontaneous combustion of a coal seam to meet the temperature (The temperature needs
to higher than 350 °C which obtained from the TSR simulation experiments) conditions of TSR. Meanwhile
there are abundant sulfate Table 2 and organic matter, which indicating that TSR genesis in the coal fire areas
and adjacent to them is important cause of the development of abnormal H2S concentrations.
Factors influencing H2S concentration. Relationship between gas composition and H2S concentra‑
tion. Lu31 concluded that the composition and content of coal mine gas have certain influences on its H2S
content. In this investigation, H2S concentration was found to be negatively correlated with CH4 concentration
(R2 = 0.2137), CO2 concentration (R2 = 0.2853), and N2 concentration (R2 = 0.01) Fig. 4a–c. The results of BSR
simulation showed that there was a large number of SRB in abnormal-area bottle, but fewer methanogens than in
normal-area bottle and that there was a large number of methanogens, but fewer SRB in normal-area bottle. This
indicated that SRB and methanogens inhibited each other and hence the presence of large amounts of methane is
not conducive to the formation of BSR-genesis H2S. BSR produces the reaction products H+ and HCO3+ forma-
tion (Eqs. (1) and (3), and CO2 dissolved in water will ionize a certain amount of H+ and HCO3−,moreover, CO2
is a reaction product in TSR formation. Therefore, the presence of C O2 leads to a shift of the reaction equilibrium
Scientific Reports | (2021) 11:5712 | https://doi.org/10.1038/s41598-021-85263-w 5
Vol.:(0123456789)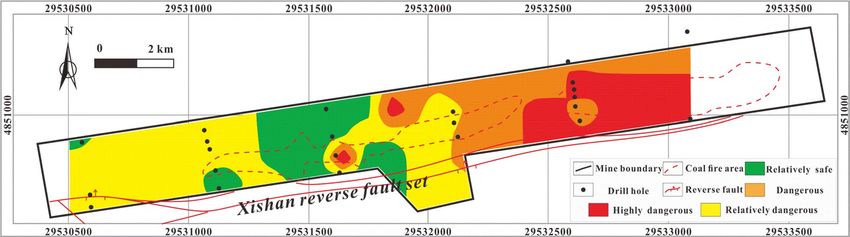
www.nature.com/scientificreports/
Figure 4. Correlation between gas composition and H2S concentration. (a) is the correlation of H2S
concentration versus C H4 concentration, (b) is the correlation of H
2S concentration versus N
2 concentration and
(c) is the correlation of H
2S concentration versus CO2 concentration.
Figure 5. Correlation between coal quality and H2S concentration. (a) is the correlation of H2S concentration
versus Ad yield, (b) is the correlation of H2S concentration versus Std content, (c) is the correlation of H2S
concentration versus V daf yield and (d) is the correlation of H2S concentration versus Mad.
to the left and proceeds in the direction of the reactants, which is not conducive to the formation of H 2S. In addi-
tion, N2 is relatively chemically stable, and is often used as a protective gas, so a high N
2 content is not conducive
to the reaction either.
Relationship between coal quality and H2S concentration. Xue32 suggested that the content of H 2S is different
in areas with different coal quality characteristics. In this work, the concentration of H2S negatively correlated
with ash yield (R2 = 0.017) Fig. 5a, positively correlated with total sulfur content (R2 = 0.5708) and volatile yield
(R2 = 0.3878) Fig. 5b,c, and had no obvious relationship with water content Fig. 5d. It is considered that the rea-
Scientific Reports | (2021) 11:5712 | https://doi.org/10.1038/s41598-021-85263-w 6
Vol:.(1234567890)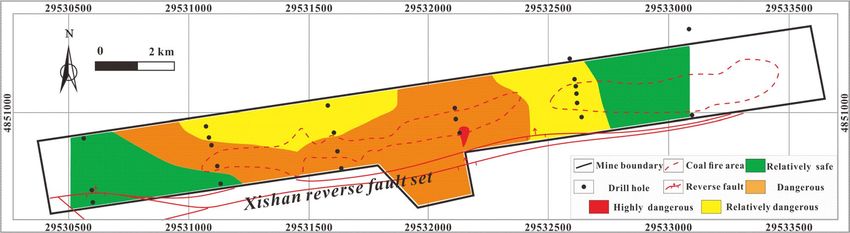
www.nature.com/scientificreports/
Figure 6. Correlation between groundwater geochemistry and H2S concentration. (a) The pH of samples, (b) is
the value of γHCO3−/γSO42− of samples, (c) is the content of HCO3− + CO32− and (d) is the content of SO42−.
sons for the above are as follows. The ash in coal is mainly composed of inorganic minerals, mostly carbonate
and clay minerals. Carbonate minerals dissolved in water will form a large number of H+ and HCO3− ions, caus-
ing shift of BSR reaction to the left. Also, where massive micron-nanometer scale pores have developed in clay
minerals, some H2S will exist in the adsorbed state33. Volatiles represent the non- aromatic fraction of coal and
are mainly composed of gases. Most of them exist in the adsorbed or free state at the surface of the coal matrix or
in pores, occupying a large amount of storage space and specific surface a rea34. There is therefore a competitive
adsorption relationship between volatiles and H 2S in the coal matrix and pores. Total sulfur is the direct source
of sulfur in H
2S, and the two values are thus closely related. However, moisture content has no single effect on
H2S content: on the one hand, water is conductive to the formation of H2S as a reactant and reaction medium,
but on the other hand, water competes with H2S in the coal matrix. The combination of these two effects results
in a lack of clear overall correlation between moisture content and H 2S concentration.
Relationship between groundwater geochemistry and H 2S concentration. Differences in the ion composition,
content and pH value of water have important influences on the BSR and TSR reaction processes and con-
trol the formation of H2S31,32. In this study, The SO42− concentration was found to be lower Fig. 6a and the
HCO3− + CO32− concentration and γHCO3−/γSO42− to be higher Fig. 6b,c in groundwater from abnormal areas
than that from normal areas, while the two had similar pH values Fig. 6d. SO42−, as the major source of sulfur
will be consumed heavily in the course of the BSR and TSR reactions, causing its depletion in the abnormal areas.
CO2, a product of the BSR and TSR reactions, exists in the form of HCO3− and CO32− after dissolving in water
(mainly the former), resulting in a higher HCO3− + CO32− concentration in the abnormal areas. As, of SO42− and
HCO3−, one is a reactant and the other a product of the BSR and TSR reactions, the value of γHCO3−/γSO42− to
some content represents the degree of BSR and TSR reaction. So γHCO3−/γSO42− is generally higher than 50% or
even as high as 180% in the abnormal areas, while it is always lower than 20% in the normal areas.
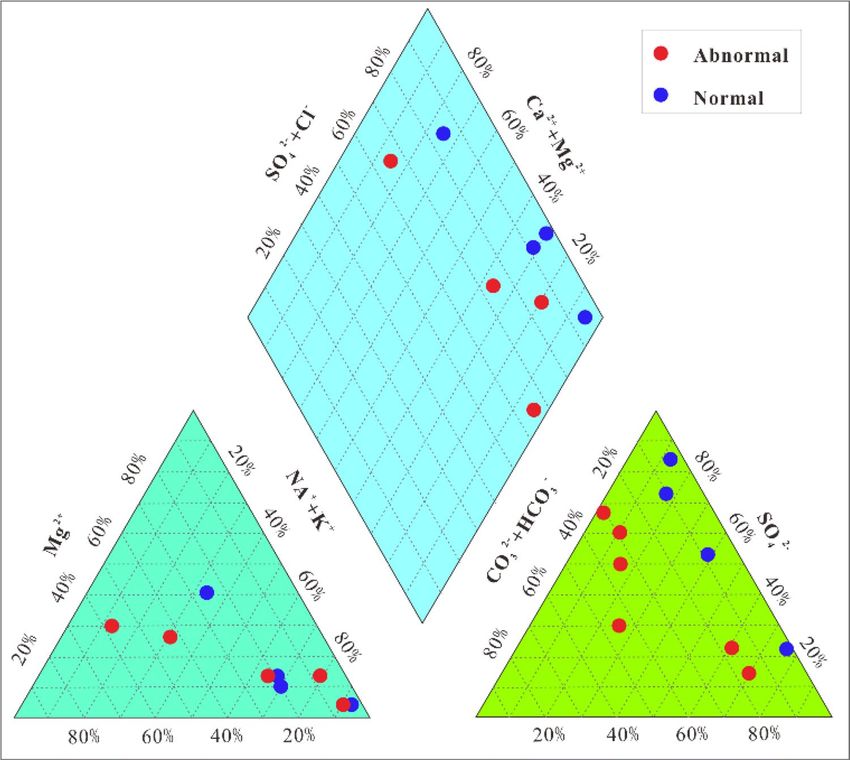
A piper diagram was used to visualized the results for the ion concentration in the coal seam water samples
Fig. 7. The Cl− concentration was lower in abnormal area than in normal areas, as was the Cl− + SO42− concentra-
tion. Overall, the water type is N a+- K + – Cl−–SO42−—HCO3− water in the abnormal areas.
Scientific Reports | (2021) 11:5712 | https://doi.org/10.1038/s41598-021-85263-w 7
Vol.:(0123456789)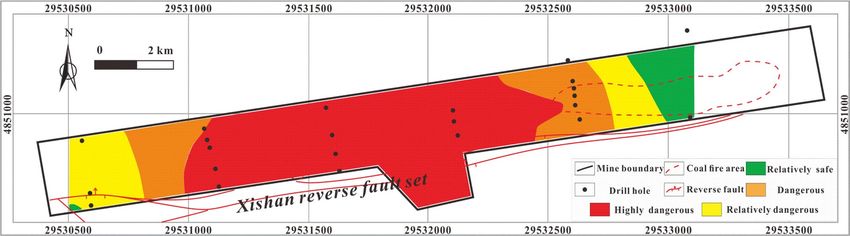
www.nature.com/scientificreports/
Figure 7. Piper ion diagram for coal seam water samples.
Relationship between geological factors and H2S concentration. Previous researchers have found that the geolog-
ical factors controlling H2S enrichment are similar to those affecting enrichment in coal bed methane4,8,10. The
formation and accumulation of H2S are mainly controlled by geological factors such as coal seam buried depth,
lithological conditions, tectonic conditions, hydrogeological conditions, and the distribution of coal fire areas.
Coal seam buried depth. The H2S concentration was weak negatively correlated with coal seam buried depth
(R2 = 0.08), however, the data concentrated in the lower part of the figure (inside the blue ellipse) shows an obvi-
ous linear positive correlation (R2 = 0.6997). On the whole, therefore, the buried depth has an inhibitory effect
on the concentration of H2S in coal mine gas. In that H2S concentration decreased with an increase in buried
depth Fig. 8. Overburden formation pressure increases as buried depth increases, and the adsorption capacity of
a rock matrix is controlled by pressure: the higher the pressure, the stronger the adsorption c apacity34. Thus, in
seams at depth, H2S mostly occurred on the surface of the coal matrix in the absorbed state, which resulted in a
decrease in H2S in coal mine gas.
Lithological conditions. The lithological character of the cap rock is one of the main parameters for gas res-
ervoir evaluation35,36. The main mineable coal seams in the study area are Jurassic continental coal-bearing
strata of the Badaowan Formation ( J1b) and the Xishanyao Formation ( J2x). The bility of overlying Cretaceous
and Cenozoic cap rocks provide a seal to gas reservoirs is of great importance. The cap rock in the study area
performs well and has a wide extent and consistent thickness. It is mostly Paleogene gypsum and gypsum-
mudstone, Cretaceous mudstone and Jurassic mudstone. Which is compact and generally has low porosity and
permeability, providing stable lithological traps with a good sealing effect.
Tectonic and hydrogeological conditions. Xishan Mine takes the forms of an east–west extending narrow,
irregular strip Fig. 1. It is located in the front fold zone of the Bogda thrust nappe between the Fukang and Yao-
moshan faults, which is arc-shaped with a northward bulge. Mesozoic faults and folds dominate the area, most
are compressive-torsional making them conductive to good sealing10,16, and the H2S enriched areas are most
concentrated at the tectonic high-point of the arc part of the nappe, conforming to the characteristics of syncline
controlled gas and reservoir formation at tectonic high points. In addition, the hydraulic connection between
coal aquifers and other aquifers is weak, and the direction of gas migration is opposite to that of groundwater
flow10,16, which has played a role in promoting hydraulic plugging.
Scientific Reports | (2021) 11:5712 | https://doi.org/10.1038/s41598-021-85263-w 8
Vol:.(1234567890)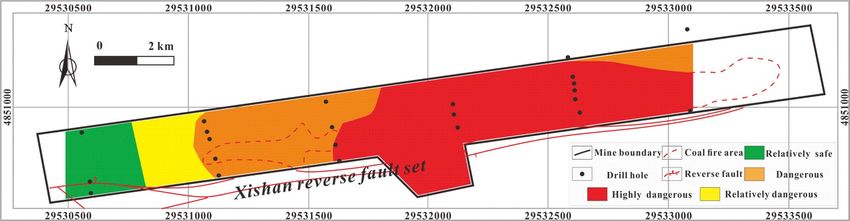
www.nature.com/scientificreports/
16
12
H2S concentration (%)
8
R2=0.08
4 2
R =0.6997
0
100 200 300 400 500
Buried Depth (m)
Figure 8. Correlation between buried depth and H2S concentration. Where the red fitting line represents all
data correlation and the blue fitting line represents the data correlation inside the ellipse.
Coal fire areas. H2S enriched areas are generally located in coal fire areas and their peripheries. Coal fire mainly
affects the formation and enrichment of H 2S in two ways. One is that the spontaneous combustion of coal seams
produces a large amount of energy, which radiates to the surrounding area, resulting in an increase in overall
energy and temperature in the area, and creating conditions that are favorable to the formation of TSR-genesis
H2S. Moreover, metamorphism occurs in rocks baked at high temperature for a long time near coal fire areas,
and partial melting and recrystallization of minerals will fill the original cracks in the rock, blocking the escape
of H2S.
Prediction of spatial variation in H2S concentration. Analysis of the results of gas chromatography of
coal mine gas can quantitatively characterize the H2S concentration in different strata and working faces of the
Xishan mine area. The above research shows that H2S concentration has complex relationship with the ground-
water geochemistry, the physical properties of the coal and various geological factors. These relationships can be
summarized as follows. The H2S concentration is linearly positively correlated with volatile yield and total sul-
fur content, negatively correlated with CH4 concentration, N2 concentration, CO2 concentration and ash yield.
Moreover, compared with non-anomalous areas, anomalous areas have lower SO42−, higher HCO3− + CO32− con-
tent, and a higher γ HCO3−/γ SO42− ratio. To predict H2S concentration and intuitively characterize the distri-
bution of areas with abnormally high H2S, the analytic hierarchy process (AHP) and MAPGIS (MAPGIS 10.3,
manufactured by China University of Geosciences and Engineering Research Center of GIS software and its
application Ministry of Education (Zondy Cyber Co., Ltd, Wuhan, China), URL link: http://www.mapgis.com/)
were used to establish an image model of H2S anomaly concentration that takes into account the process of
generation, migration and preservation of H2S together with the effects of gas composition, coal quality charac-
teristics, groundwater geochemistry, and other geological factors.
Establishment of analytical hierarchy process model. AHP model can take various decision-making factors into
account qualitatively and quantitatively and has been widely used for in dealing with multi-factor comprehen-
sive evaluation37,38. It is a step-by-step transfer model based on the specific conditions of the research object and
generally includes three levels: the target level, the middle level, and the decision level. The research model is
shown in Fig. 9. According to experimental analysis and single factor fitting results, H 2S concentration is taken
as the target level of the model, and the gas composition, groundwater geochemistry, coal quality and other
geological factors are taken as the middle level, C H4 concentration, CO2 concentration, SO42− concentration,
γ HCO3−/γ SO42−, total sulfur content, volatile yield and sampling depth are taken as the decision level, each
of which corresponds with one of the middle levels. The model was thus built by systematically analyzing the
research objectives are analyzed systematically, establishing several influencing factors, and then determining
the secondary influencing those primary factors. In this way, the factors that affect each other and act upon each
other were decomposed step by step, forming a top-down hierarchical relationship structure. When determining
the factors, it is important to follow the principle of highlighting the main indicators, the principle of the relative
independence of the main factors and the principle of operability in the establishment of each factor.
Establishment of hierarchical matrix. The hierarchical structure reflects the relationships among various fac-
tors, but each factor differs in its degree of influence on the target measurement. After referring to previous
research1,6,10,23,24,36,37, this study assigns each factor according to Saaty’s 9-level assignment theory and establishes
a hierarchical matrix Tables 3, 4, 5 and 6. The weight calculation criteria of the AHP model are then used to
Scientific Reports | (2021) 11:5712 | https://doi.org/10.1038/s41598-021-85263-w 9
Vol.:(0123456789)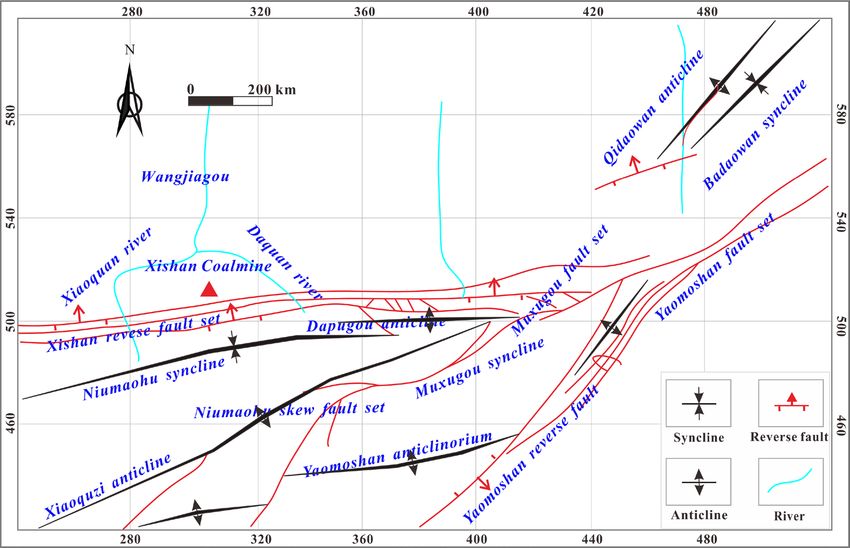
www.nature.com/scientificreports/
Figure 9. Schematic diagram of the AHP structure model.
A B1 B2 B3 B4
B1 1.00 2.00 0.50 1.00
B2 0.50 1.00 0.25 1.00
B3 2.00 4.00 1.00 2.00
B4 1.00 2.00 0.50 1.00
Table 3. Judgment matrix A-Bi (i = 1–4).
B1 C1 C2
C1 1.00 0.50
C2 2.00 1.00
Table 4. Judgment matrix B1-Ci (i = 1–2).
B2 C3 C4
C3 1.00 0.50
C4 2.00 1.00
Table 5. Judgment matrix B2-Ci (i = 3–4).
B3 C5 C6
C5 1.00 0.25
C6 4.00 1.00
Table 6. Judgment matrix B3-Ci (i = 5 ~ 6).
obtain the maximum eigenvalue λMAX and its corresponding eigenvectors according to the obtained matrix. The
normalized eigenvectors are the single ranking weight W of each matrix. The total ranking weight WA/Ci is then
calculated according to the transferability of the matrix. The results are given in Table 7.
Single‑factor thematic map and multi‑factor superposition map predictions. The superposition analysis function
of a MAPGIS database is used to compound all of the information is compounded into a comprehensive infor-
mation that relevant to the partition model of H2S concentration in the coal mine. That is to say, a mathematical
model is established that correlates the H2S concentration and its influencing factors. The values calculated by
Scientific Reports | (2021) 11:5712 | https://doi.org/10.1038/s41598-021-85263-w 10
Vol:.(1234567890)www.nature.com/scientificreports/
CH4 concentration CO2 concentration SO42− concentration Total sulfur Sampling depth
Controlling factors (W1) (W2) (W3) γSO42−/γHCO3−(W4) concentration (W5) Volatile yield (W6) (W7)
Weight (Wi) 0.024 0.145 0.045 0.089 0.087 0.346 0.217
Table 7. Weight of main factors controlling H2S concentration.
Figure 10. Thematic map of CH4 concentration in MAPGIS software.
the model directly reflect the risk that there will be an abnormal H2S concentration at a certain geographical
location. The model is based on gas composition, groundwater geochemistry, coal quality, and other geological
factors, and, using the results of the hierarchical analysis, weights are assigned to each factor to make a compre-
hensive multi-factor prediction. The RI (Risk Index) is introduced to evaluate the risk, which is defined as the
sum of the superimposed effects of various factors on the H2S concentration in a certain area (Eq. (5)).
n
RI = Wk ∗ fk x, y (5)
k=1
where RI is the risk index; Wk is the weight of the dominant factor; fk (x, y) is the function of a single-factor
influence value; x, y is geographical coordinate; n is the number of influencing factors.
The coordinates of the drill hole and the quantified values should be input into the MAPGIS to predict the RI
coupling MAPGIS and AHP. The powerful data storage, spatial data processing and analysis functions, results
display and output functions and data update functions of MAPGIS are then used to generate corresponding
data files that can be read by drawing software. These are then processed by mesh generation and interpolation.
Finally, the quantified results are displayed in the form of graphics, and the result is output as a diagram through
the graphics output system. According to the normalized value of the H 2S concentration gradient, the natural
grading method (also known as the best difference method) can be used to divide the study area into highly
dangerous, dangerous, relatively dangerous and relatively safe areas, which correspond to different colors. The
darker the color, the higher the risk coefficient. RI values within the range 0–0.000015% are safe area (green),
an RI ranging 0.000015–0.00036% is relatively dangerous (yellow), an RI ranging from 0.00036 to 0.0023% is
dangerous (orange), and an RI ranging 0.0023–0.015% is highly dangerous (red) Figs. 10–17.
The thematic map of the single influencing factor of C H4 concentration Fig. 10 shows that the highly dan-
gerous area is located in the central coal fire area of the mining area and is very small. Most of the study area is
relatively safe or relatively dangerous apart from in and around the central coal fire area.
The thematic map of the single influencing factor of C O2 concentration Fig. 11 shows that a highly danger-
ous area in the southwest corner of the central coal fire area and dangerous areas distributed around the highly
dangerous area and in the coal fire areas. The relatively safe and relatively dangerous areas are mainly in the
eastern part and in a small area in the southwest of the mining area.
The thematic map of the single influencing factor of S O42− concentration Fig. 12 shows that the main body of
highly dangerous area is located in the central coal fire area and that certain regions of the west are also highly
dangerous, while the dangerous area occupies most of the study area. The relatively safe and relatively dangerous
areas are mainly located in the northeast of the study area as well as an isolated part of the central and western
areas.
The thematic map of the single influencing factor of γHCO3−/γSO42− Fig. 13 shows that the highly danger-
ous area is relatively small and is concentrated in the central coal fire area. The main part of the dangerous area
is located in the coal fire area and its surroundings, while the relatively safe and relatively dangerous areas are
mainly located outside the coal fire areas.
The thematic map of the single influencing factor of sulfur concentration Fig. 14 shows that the coal fire
areas and the areas surrounding them are all high-danger or dangerous, while the western area is relatively safe
or relatively dangerous.
Scientific Reports | (2021) 11:5712 | https://doi.org/10.1038/s41598-021-85263-w 11
Vol.:(0123456789)www.nature.com/scientificreports/
Figure 11. Thematic map of CO2 concentration in MAPGIS software.
Figure 12. Thematic map of SO42− concentration in MAPGIS software.
Figure 13. Thematic map of γHCO3−/γSO42− in MAPGIS software.
Figure 14. Thematic map of total sulfur concentration in MAPGIS software.
Scientific Reports | (2021) 11:5712 | https://doi.org/10.1038/s41598-021-85263-w 12
Vol:.(1234567890)www.nature.com/scientificreports/
Figure 15. Thematic map of volatile yield in MAPGIS software.
Figure 16. Thematic map of sampling depth in MAPGIS software.
Figure 17. Thematic map of multi-factor superposition in MAPGIS software.
The thematic map of the single influencing factor of volatile yield Fig. 15 shows a stepped downward trend
in the H2S concentration from the middle to either side of the study area. The highly dangerous and dangerous
areas are located in the middle part, while the relatively safe and relatively dangerous areas are located at the
east and west margins.
The thematic map of the single influencing factor of sampling depth shows Fig. 16 that the highly danger-
ous area is mainly in the east coal fire area and in certain parts of the central coal fire area. The dangerous area
is mainly located in the northeastern part of the study area, while relatively safe and relatively dangerous areas
occupy the central and western parts of the study area.
The thematic map of a single influencing factor can reflect the how that variable controls the distribution of
H2S under specific conditions, but a thematic map with multi-factor superposition can predict the characteristics
and variability of overall H2S concentration under the control of multiple factors accurately. The multi-factor
thematic map is shown in Fig. 17. The highly dangerous area is small: it is mainly located in the eastern coal fire
area, with a few highly dangerous areas in the central coal fire area. The dangerous area is mainly located on both
sides of the area between the two coal fire areas. The relatively safe and relatively dangerous areas are mainly in
the west and northeast. The prediction results are relative accurate: several H 2S disasters have occurred in the
history of the study area and all were in areas indicated in Fig. 17 to be highly dangerous or dangerous.
Scientific Reports | (2021) 11:5712 | https://doi.org/10.1038/s41598-021-85263-w 13
Vol.:(0123456789)www.nature.com/scientificreports/
Conclusion
1. Disasters resulting from abnormal concentration of H2S have occurred in many coal seams and working
faces at the Xishan coal mine. The H 2S is derived from two processes, BSR and TSR. Two genera of SRB are
primarily responsible for the BSR, Desulfovibrio and Desulfomicrobium, and the TSR-genesis of H2S, which
requires temperature, mainly occurred in coal fire areas.
2. The H2S concentration is negatively correlated with C H4 concentration, N
2 concentration, C O2 concentra-
tion and ash yield and positively correlated with volatile yield and total sulfur content. Moreover, the S O42−
concentration is lower and H CO3− + CO32− and γHCO3−/γSO42− are higher in areas with an abnormal H 2S
concentration.
3. The overall tectonic conditions of the study area are simple, with the cap rock lithology and tectonic and
hydrogeological conditions being conductive to the storage of H 2S. In addition, the presence of two coal fire
areas is favorable to the formation of H2S.
4. An Analytical Hierarchy Process Model and the results of MAPGIS prediction show that areas that can be
considered highly dangerous and dangerous as regards H2S concentration are mainly located in and around
the coal fire areas, while the west and northeast of the study area can be considered relatively safe to relatively
dangerous.
Received: 23 October 2020; Accepted: 28 February 2021
References
1. Liang, B. et al. Numerical simulation of lye injection into coal seams for governance of H2S and its field applications. J. China Univ.
Min. Technol. 46(2), 244–249 (2017).
2. Jong, W., Verkooijen, A. & Meng, X. Thermodynamic analysis and kinetics model of H2S sorption using different sorbents. Environ.
Progr. Sustain. Energy 28(3), 360–371 (2009).
3. Meng, N. et al. Sulfur transformation in coal during supercritical water gasification. Fuel 186, 394–404 (2016).
4. Xue, J. et al. Adsorption characteristics of H2S in coal mine gas and their effect on H2S control in coal mines. Geol. Explor. 53(3),
609–614 (2017).
5. Lu, W., Cao, Y. & Ctien, J. Method for prevention and control of spontaneous combustion of coal seam and its application in mining
field. Int. J. Min. Sci. Technol. 27(5), 839–846 (2017).
6. Liu, M. et al. Genesis modes discussion of H2S gas in coal mines. J. China Coal Soc. 36(6), 978–983 (2011).
7. Chen, L. et al. Distinguishing the Cambrian source rock from the upper Ordovician: Evidence from sulfur isotopes and biomarkers
in the Tarim basin. Org. Geochem. 40(7), 755–768 (2009).
8. Jiao, C. et al. Distribution characteristics of H2S anomaly area of coal mine gas in China. J. Heilongjiang Inst. Sci. Technol. 23(4),
375–377 (2013).
9. He, Y., Fu, X. & Lu, L. Influencing factors of different coal ranks on H2S adsorption. Saf. Coal Mines 46(11), 149–155 (2015).
10. Fu, X. et al. In-situ coal seam gas H2S content influencing factors and genetic analysis in Xishan Minefield, Urumqi, Xinjiang.
Coal Geol. China 27(1), 28–30 (2015).
11. Fu, X. et al. Prevention and origin of exceptional deleterious gas composition in coal mine. Procedia Eng. 26(2011), 424–430 (2011).
12. Lin, H. et al. Study on the rapid removal of H2S in underground coal mines. J. China Coal Soc. 37(12), 2065–2069 (2012).
13. Zhu, Y., Hao, F. & Guo, T. Evidence for multiple stages of oil cracking and thermochemical sulfate reduction in the Puguang gas
field, Sichuan Basin, China. AAPG Bull. 92(5), 611–637 (2008).
14. Wang, A. et al. Enrichment and cultivation of natural methanogen and simulation of biogenetic gas generation from brown coal
samples. Geol. J. China Univ. 16(1), 80–85 (2010).
15. Liu, K. Experimental research on influence factors of spraying absorption liquid to control H_2S in coal mine. Saf. Coal Mines
47(2), 29–32 (2016).
16. Li, L. et al. Gas deposit influence factors analysis of Xinjiang Fukang mining area. Saf. Coal Mines 46(3), 156–159 (2015).
17. Sun, Y. et al. Component analysis of irritant gases in Jinniu mine. Saf. Coal Mines 46(8), 185–187 (2015).
18. Wu, Y., Liu, J. & Fan, K. Study on release mechanism and control technology of hydrogen sulfide gas in coal mine. J. Residuals Sci.
Technol. 13(4), S73–S83 (2016).
19. Yuan, X. et al. Research on control of mine hydrogen sulfide emission by injecting sodium bicarbonate solution into coal seams.
China Saf. Sci. J. 25(5), 114–1119 (2015).
20. Li, C. Alkali ingection to control H2S in Xiqu Mine. Shanxi Coal 29(03), 31–32+35 (2009).
21. Wang, Y. Analysis of hydrogen sulfide origin for coal seams of the Taiyuan formation in Tiexin Mine Field. J. Liaoning Tech. Univ.
Nat. Sci. 34(10), 1137–1142 (2015).
22. Chen, A., Li, J. & Dai, J. Geological conditions of generating hydrogen sulphide. Mar. Origin Pet. Geol. 14(4), 24–34 (2009).
23. Cai, C. et al. Thermochemical sulphate reduction and the generation of hydrogen sulphide and thiols (mercaptans) in Triassic
carbonate reservoirs from the Sichuan Basin, China. Chem. Geol. 202(1), 39–57 (2003).
24. Zhang, S. et al. Geochemical characteristics of the Zhaolanzhuang sour gas accumulation and thermochemical sulfate reduction
in the Jixian sag of Bohai bay basin. Org. Geochem. 36(12), 1717–1730 (2005).
25. Park, Y., Kim, Y. & Lee, C. Development of a detection sensor for lethal H2S gas. J. Nanosci. Nanotechnol. 12(7), 5283–5289 (2012).
26. Wim, B. et al. A molecular modelling study towards the development of H2S-free removal of iron sulphide scale from oil and gas
wells. Ind. Eng. Chem. Res. 57(31), 10061–10070 (2018).
27. Zhang, L. et al. Biological sulfur reduction to generate H2S as a reducing agent to achieve simultaneous catalytic removal of SO2
and NO and sulfur recovery from flue gas. Environ. Sci. Technol. 52(8), 4754–4762 (2018).
28. Bangale, S. V. & Bamane, S. R. Preparation and study of h2s gas sensing behavior of znfe2o4thick film resistors. Sens. Transducers
137(2), 123–136 (2012).
29. Huang, B., Chen, B. & Chen, R. Predicting H2S oxidative dehydrogenation over graphene oxides from first principles. Chin. J.
Chem. Phys. 28(2), 143–149 (2015).
30. Frigge, L. et al. Sulfur and chlorine gas species formation during coal pyrolysis in nitrogen and carbon dioxide atmosphere. Energy
Fuels 30(9), 7713–7720 (2016).
31. Lu, L. Experimental Study of H2S Adsorption by Coals of Different Coal-ranks. Master’s Thesis, China University of Mining and
Technology, China (2014).
Scientific Reports | (2021) 11:5712 | https://doi.org/10.1038/s41598-021-85263-w 14
Vol:.(1234567890)www.nature.com/scientificreports/
32. Xue, J. The Bacterial Sulfate Reduction and Thermochemical Sulfate Reduction Reason Research of Abnormal Hydrogen Sulfide in
Coal Mine Gas of Wudong. Master’s Thesis, China University of Mining and Technology, China (2017).
33. Zhao, X. et al. Three-dimensional porous graphene oxide-maize amylopectin composites with controllable pore-sizes and good
adsorption-desorption properties: Facile fabrication and reutilization, and the adsorption mechanism. Ecotoxicol. Environ. Saf.
176, 11–19 (2019).
34. Wang, B. Industrial Analysis and Detection Technology (Central Radio and Television University Press, 2014).
O2 in shale. J. China Univ. Petrol. 37(5), 95–99 (2013).
35. Sun, B. et al. Evaluation of adsorption and desorption properties of C
36. Wei, X. et al. Micro-pores structure characteristics and development control factors of shale gas reservoir: A case of Longmaxi
formation in xx area of southern Sichuan and northern Guizhou. Nat. Gas Geosci. 24(5), 1048–1059 (2013).
37. Wei, C., Chien, C. & Wang, M. An ahp-based approach to erp system selection. Int. J. Prod. Econ. 96(1), 47–62 (2005).
38. Al-Harbi, A. Application of the AHP in project management. Int. J. Project Manage. 19(1), 19–27 (2001).
Acknowledgements
The authors gratefully acknowledge the support of the Major Project Cultivation of CUMT (2020ZDPYMS09)
and the Foundation Research Project of National Science and Technology Major Project (2017ZX05035004-002).
Author contributions
Y.H., M.W. and W.X. conceived and conducted the experiments, W.X. conducted the software simulation, H.W.,
M.W. and W.X. analysed the results. All authors reviewed the manuscript.
Competing interests
The authors declare no competing interests.
Additional information
Correspondence and requests for materials should be addressed to M.W.
Reprints and permissions information is available at www.nature.com/reprints.
Publisher’s note Springer Nature remains neutral with regard to jurisdictional claims in published maps and
institutional affiliations.
Open Access This article is licensed under a Creative Commons Attribution 4.0 International
License, which permits use, sharing, adaptation, distribution and reproduction in any medium or
format, as long as you give appropriate credit to the original author(s) and the source, provide a link to the
Creative Commons licence, and indicate if changes were made. The images or other third party material in this
article are included in the article’s Creative Commons licence, unless indicated otherwise in a credit line to the
material. If material is not included in the article’s Creative Commons licence and your intended use is not
permitted by statutory regulation or exceeds the permitted use, you will need to obtain permission directly from
the copyright holder. To view a copy of this licence, visit http://creativecommons.org/licenses/by/4.0/.
© The Author(s) 2021
Scientific Reports | (2021) 11:5712 | https://doi.org/10.1038/s41598-021-85263-w 15
Vol.:(0123456789)You can also read