Creche and Schools Demand Assessment - Proposed Residential Development at Sandyford Central - An Bord Pleanala
←
→
Page content transcription
If your browser does not render page correctly, please read the page content below
Creche and Schools Demand Assessment
                                                             November 2019

Creche and Schools Demand Assessment

Proposed Residential Development at Sandyford Central

November 2019
Creche and Schools Demand Assessment
                                                                                           November 2019

Document Control Sheet

 Project                   Former Aldi Site, Carmanhall Road, Sandyford
 Project No.               2-0719
 Document Title            Creche and Schools Demand Assessment

 Contents              No. of Pages
 Cover Page            1
 Control Sheet         1
 Table of Contents     1
 Text                  29
 Table of Tables       0
 Table of Figures      0
 Appendices            2
 Total No. of          34
 Pages

 Rev    Distribution       Comments      Author    Checked    Approved Day          Month      Year
 1      Thornton           Issued to     RF        SMP        SMP      18           07         2019
        O’Connor           Client
 2      Thornton           Issued to     KMcK      SMP        SMP         11        10         2019
        O’Connor           Client
 3      Thornton           Issued to     KMcK      SMP        SMP         04        11         2019
        O’Connor           Client
Creche and Schools Demand Assessment
                                                                                                                               November 2019

Contents
1.0 Introduction ........................................................................................................................... 1
   1.1 Study Area ..................................................................................................................................... 1
   1.2 Proposed Development................................................................................................................. 1
2.0 Policy ..................................................................................................................................... 4
   2.1 Action Plan for Education 2019 ..................................................................................................... 4
   2.2 Sustainable Urban Housing: Design Standards for New Apartments – Guidelines for Planning
   Authorities (2018) ............................................................................................................................... 4
   2.3 Guidelines for Planning Authorities on Sustainable Residential Development in Urban Areas
   (2009) .................................................................................................................................................. 5
   2.4 The Provision of Schools and the Planning System: A Code of Practice (2008) ............................ 5
   2.5 Childcare Facilities: Guidelines for Planning Authorities (2001) ................................................... 5
   2.6 Dún-Laoghaire-Rathdown County Development Plan 2016-2022 ................................................ 6
   2.7 Sandyford Urban Framework Plan (SUFP)..................................................................................... 7
   2.8 School Building Programme .......................................................................................................... 8
3.0 Approach ............................................................................................................................. 10
4.0 Supply .................................................................................................................................. 11
   4.1 Existing Provision ......................................................................................................................... 11
   4.2 Childcare Facilities ....................................................................................................................... 11
      4.2.1 Consultation.......................................................................................................................... 13
   4.3 Primary Schools ........................................................................................................................... 14
   4.4 Post-Primary Schools ................................................................................................................... 16
5.0 Demand ............................................................................................................................... 18
   5.1 Demographic Profile .................................................................................................................... 18
   5.2 Impact of the Proposed Development ........................................................................................ 20
   5.3 Further Analysis/Observations .................................................................................................... 23
      5.3.1 Accessibility........................................................................................................................... 23
      5.3.2 Quarterly National Household Survey .................................................................................. 23
   5.4 Recommendations ...................................................................................................................... 24
      5.4.1 Previous Scheme................................................................................................................... 25
6.0 Conclusion ........................................................................................................................... 28
Appendices ................................................................................................................................ 30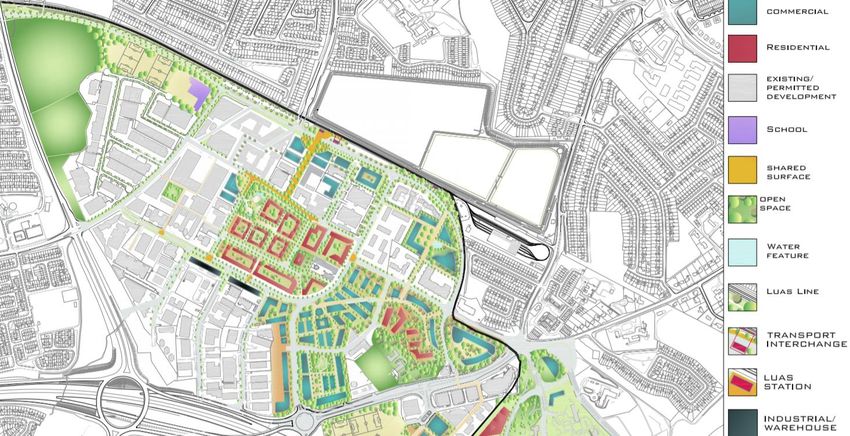
Creche and Schools Demand Assessment
                                                                                            November 2019

1.0 Introduction
This Creche and Schools Demand Assessment has been prepared by Future Analytics Consulting Ltd.
on behalf of Sandyford GP Limited, acting in its Capacity as General Partner for ‘The Sandyford Central
Partnership’ (the Partnership) for their proposed development, ‘Sandyford Central’, on a site within
the former Sandyford Industrial Estate. This report provides a detailed review of the strategic,
statutory and policy context that relates to the provision of childcare and educational facilities in the
area. The report:

    •   Outlines the existing range of educational services on offer in the study area;
    •   Describes the demand generated by the proposed development; and
    •   Offers insights into the future capacity of the existing facilities.

1.1 Study Area
The subject site for the proposed development is located in the former Sandyford Industrial Estate
and is approximately 1.54 ha (3.81 acres). It lies approximately 8.25km south of Dublin City Centre and
is adjacent to the Stillorgan LUAS stop in the catchment area of Dún-Laoghaire Rathdown County
Council (DLR Council). The site is bounded by Blackthorn Drive to the north, Carmanhall Road to the
south, commercial development to the east and residential to the west. It benefits from excellent
accessibility and public transport facilities, with the Stillorgan LUAS stop adjacent to the site,
numerous bus routes within walking distance and easy access to the M50.

The catchment area for this study is defined by a 2km buffer created around the centre of the site. All
Electoral Divisions (EDs) that intersect with this boundary and have a significant proportion of their
area within the buffer zone, are included in the study area and will form the basis for the socio-
economic analysis performed in later chapters. In total there are 11 EDs included for the purpose of
this study and a more detailed analysis of this will take place in a later chapter of the report.

1.2 Proposed Development
The development, which will have a Gross Floor Area of 49,342 sq.m will principally consist of: the
demolition of the existing structures on site and the provision of a Build-to-Rent residential
development comprising 564 no. apartments (46 no. studio apartments, 205 no. one bed apartments,
295 no. two bed apartments and 18 no. three bed apartments) in 6 no. blocks as follows: Block A (144
no. apartments) is part 10 to part 11 no. storeys over basement; Block B (68 no. apartments) is 8 no.
storeys over basement; Block C (33 no. apartments) is 5 no. storeys over lower ground; Block D (103
no. apartments) is part 16 to part 17 no. storeys over lower ground; Block E (48 no. apartments) is 10
no. storeys over semi-basement; and Block F (168 no. apartments) is 14 no. storeys over semi
basement.

The development provides resident amenity spaces (1,095 sq.m) in Blocks A, C and D including
concierge, gymnasium, lounges, games room and a panoramic function room at Roof Level of Block D;
a creche (354 sq.m); café (141 sq.m); a pedestrian thoroughfare from Carmanhall Road to Blackthorn
Drive also connecting into the boulevard at Rockbrook to the west; principal vehicular access off
Carmanhall Road with servicing and bicycle access also provided off Blackthorn Drive; 285 no. car

                                                                                                        1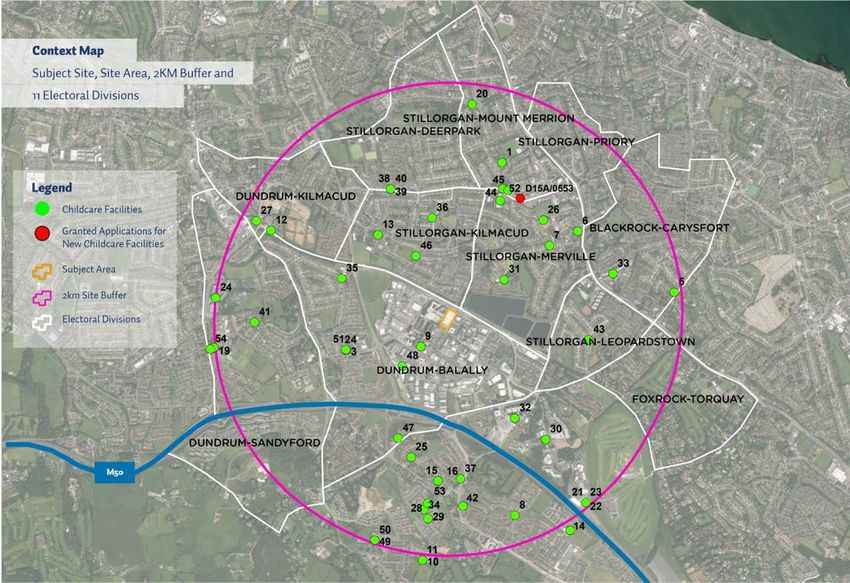
Creche and Schools Demand Assessment
                                                                                         November 2019

parking spaces (254 no. at basement level and 31 no. at ground level); 21 no. motorcycle spaces; set-
down areas; bicycle parking; bin storage; boundary treatments; hard and soft landscaping; lighting;
plant; ESB substations and switchrooms; sedum roofs; and all other associated site works above and
below ground.

                                                                                                     2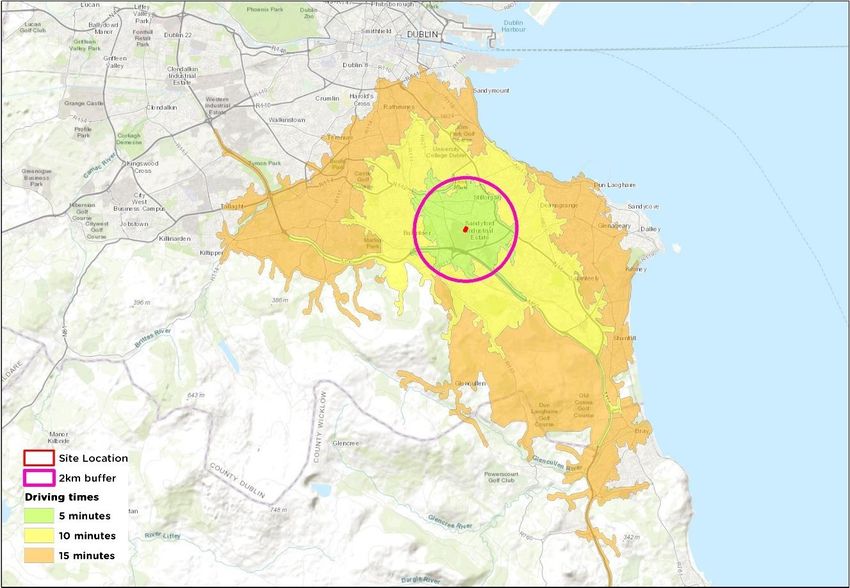
Creche and Schools Demand Assessment
                                                                                  November 2019

                                                                                              3
Figure 1: Subject Site, Study Area and Transport Network.
Creche and Schools Demand Assessment
November 2019
2.0 Policy
For the purpose of this report Future Analytics Consulting Ltd. (FAC) have reviewed national-level
planning policy relating to childcare and schools, along with the relevant Local Authority Development
Plan and associated Urban Framework Plan. The key points relating to this study, as derived from each
piece of policy, will now be discussed.
2.1 Action Plan for Education 2019
Goal 4 of the Department of Education and Skills (DES) 2019 ‘Action Plan for Education’ aims to
“intensify the relationship between education and the wider community, society and the economy”. A
fundamental part of this goal is the provision of increased choices in school type, affording parents of
children with greater options.
Action 51 aims to “make progress towards increasing the diversity of school type, in order to offer
parents more choice’’. DES commitment 10.3.2, arising from the Programme for a Partnership
Government, is to increase the number of non-denominational and multi-denominational schools
with a view to reaching 400 by 2030.
Goal 5 is to “lead in the delivery of strategic direction and supportive systems in partnership with key
stakeholders in education and training” and methods through which this can be achieved is via the
delivery of appropriate infrastructure for learning environments. The capital programme, at €941
million for 2019, represents a very substantial commitment of resources, in order to develop the
physical learning infrastructure.
Strategic Action 1 is to “implement the National Development Plan 2018-2027 and Project Ireland 2040
in respect of the schools’ sector, higher education and further education and training”.
Action 84 seeks to “implement the ‘National Development Plan 2018-2027’ in respect of the primary
and post-primary school sectors”. One of the indicators that will be used to measure the progress of
Goal 5 during 2019 is the number of primary and post-primary schools.
2.2 Sustainable Urban Housing: Design Standards for New Apartments – Guidelines for
Planning Authorities (2018)
Section 4.7 of the Design Standards references the provision of childcare facilities in new apartment
developments. It states the following:
“Notwithstanding the Planning Guidelines for Childcare Facilities (2001), in respect of which a
review is to be progressed, and which recommend the provision of one child-care facility
(equivalent to a minimum of 20 child places) for every 75 dwelling units, the threshold for
provision of any such facilities in apartment schemes should be established having regard
to the scale and unit mix of the proposed development and the existing geographical
distribution of childcare facilities and the emerging demographic profile of the area. One-
bedroom or studio type units should not generally be considered to contribute to a requirement
4Creche and Schools Demand Assessment
November 2019
for any childcare provision and subject to location, this may also apply in part or whole, to
units with two or more bedrooms” (emphasis added).
This provides an element of flexibility in the provision of childcare facilities provided a sufficient
demographic and/or geographical argument can be made. It also stipulates that studio and one-
bedroom apartments do not need to be included in any count that estimates the number of minors in
a development.
2.3 Guidelines for Planning Authorities on Sustainable Residential Development in
Urban Areas (2009)
Under the chapter entitled ‘planning for sustainable neighbourhoods’ the provision of certain key
community facilities is discussed, with both schools and childcare forming essential elements. As new
residential developments can lead to a demand for school places, it is vital that the “timely provision
of new school buildings” is planned for. Furthermore, it is stated that “no substantial residential
development should proceed without an assessment of existing school capacity or the provision of new
school facilities in tandem with the development”. In addition, the Guidelines recommend that
development applications with over 200 units should be accompanied by a report that assess the likely
school-place demand generated, and the existing capacity. This report addresses the requirement.
Regarding childcare facilities, the Guidelines note that, when assessing development applications,
particularly for larger developments, it is recommended that there is a “provision of one childcare
facility (equivalent to a minimum of 20 child places) for every 75 dwelling units”. It continues to state
that the provision of such should have regard to the “existing geographical distribution of childcare
facilities and the emerging demographic profile of areas”.
2.4 The Provision of Schools and the Planning System: A Code of Practice (2008)
The Code of Practice stipulates the methodology for forecasting future education demand.
Identification of future primary school demands should be based upon:
- The anticipated increase in overall population for the city/county plan area over the next nine
years (as set out in relevant development or local area plans);
- The current school-going population based on school returns;
- The increase in school going population, assuming that an average of 12% of the population
are expected to present for primary education; and,
- The number of classrooms required in total derived from the above.
2.5 Childcare Facilities: Guidelines for Planning Authorities (2001)
The Guidelines instruct Local Authorities to set out objectives in Development Plans that relate to the
provision of childcare facilities. A focus should be placed on promoting childcare facilities, as part of
the development of sustainable communities, in locations such as: residential areas; places of
5Creche and Schools Demand Assessment
November 2019
employment; educational establishments; city, town, neighbourhood and district centres; and
locations convenient to public transport nodes.
Additionally, the Guidelines require the objectives section of development plans to include childcare
facilities as a specific use in ‘appropriate locations/zones’. These locations would include “new
communities/larger new housing developments”. The Guidelines state the following in relation to new
housing developments:
“Planning authorities should require the provision of at least one childcare facility for new
housing areas unless there are significant reasons to the contrary for example, development
consisting of single bed apartments or where there are adequate childcare facilities in
adjoining developments. For new housing areas, an average of one childcare facility for each
75 dwellings would be appropriate. The threshold for provision should be established having
regard to the existing geographical distribution of childcare facilities and the emerging
demographic profile of areas. Authorities could consider requiring the provision of larger units
catering for up to 30/40 children in areas of major residential development on the basis that
such a large facility might be able to offer a variety of services – sessional/drop in/after-school,
etc.”
Section 3.3.1 elaborates further by stating that “a standard of one childcare facility providing for a
minimum 20 childcare places per approximately 75 dwellings may be appropriate” for new residential
developments. However, it continues by clarifying that such guidelines are exactly that and “will
depend on the particular circumstances of each individual site”.
2.6 Dún-Laoghaire-Rathdown County Development Plan 2016-2022
The current Dún-Laoghaire-Rathdown County Development Plan (DLRCDP) covers the period between
2016 and 2022. It stipulates several requirements for development in the County over the lifetime of
the plan.
Sandyford is designated as a ‘Secondary Centre’ in the DLRCDP, which means that it will function as a
focal point of future growth and development. Indeed, Sandyford Business District is considered a
primary growth node for the delivery of residential units. In this regard it is worth noting the
population targets outlined in the DLRCDP, which themselves are taken from the Regional Planning
Guidelines (RPG) 2010-2022. For 2022 the population target for Dún-Laoghaire Rathdown is listed as
240,338 persons, however this figure is an estimate based upon the 2006 Census figures from which
the RPG was developed. We also note that the RPG has been superseded by the Eastern and Midland
Area Regional Spatial and Economic Strategy (EMRSES), which has recently been adopted.
Sandyford Business District is considered a key location in the County and has its own policy measure.
Policy E9 states that it is “County policy to implement the Urban Framework Plan for Sandyford”.
The business district refers to the combination of Sandyford Business Estate, Central Park and the
South County Business Park. Due to the changing nature of the area, which has experienced major
residential growth and development in recent years, it was deemed appropriate to create an Urban
Framework Plan for the area.
6Creche and Schools Demand Assessment
November 2019
Policy SIC6: Community Facilities: “It is Council policy to support the development, improvement and
provision of a wide range of community facilities distributed in an equitable manner throughout the
County”.
Based upon previous national policy direction, DLR Council acknowledge that community facilities
should be located within or close to neighbourhood centres and be well served by public transport.
Schools and childcare facilities are considered to be a fundamental part of sustainable communities.
Policy SIC7: New Development Areas: “It is Council policy to ensure that proper community
infrastructure and complementary neighbourhood facilities are provided concurrently with the
development of new residential growth nodes in the County”.
This policy measure is of particular relevance to Sandyford as it has been created specifically to address
development in locations that previously did not undergo major residential growth. Measures such as
Local Area Plans and Urban Framework Plans will be created for these areas to direct sustainable
growth and ensure that the appropriate and necessary community facilities and amenities are
delivered.
Policy SIC8: Schools: “It is Council policy to ensure the reservation of primary and post-primary school
sites in accordance with the requirements of the relevant education authorities and to support the
provision of school facilities and the development / redevelopment of existing schools throughout the
County.”
This policy requires the planning authority, in conjunction with the DES, to identify suitable locations
for schools which accounts for future development patterns. When identifying sites there must be
consideration given “both to the co-location of childcare provision and the potential use of school
facilities by the wider community”.
Policy SIC11: Childcare Facilities: “It is Council policy to encourage the provision of affordable and
appropriate childcare facilities as an integral part of proposals for new residential developments and
to improve/expand existing childcare facilities across the County. In general, at least one childcare
facility should be provided for all new residential developments subject to demographic and
geographic needs. The Council will encourage the provision of childcare facilities in a sustainable
manner to encourage local economic development and to assist in addressing disadvantage.”
This policy measure is a result of DLR Council’s adherence to the ‘Childcare Facilities Guidelines for
Planning Authorities’, which is discussed in this report. The policy reflects the Guidelines’
recommendation that new residential developments of 75+ dwellings should provide one childcare
facility on site. However, this will have regard to geographic distribution and the existing capacity of
surrounding facilities.
2.7 Sandyford Urban Framework Plan (SUFP)
The SUFP forms part of DLR’s County Development Plan.
Policy SUFP 10 Education: “It is Council policy to either provide for and/or facilitate access to the full
spectrum of educational needs required to support Sandyford Business District”.
7Creche and Schools Demand Assessment
November 2019
This policy calls for the full spectrum of educational needs, including preschools, to be provided for as
the necessary supporting structures for the area.
Objective E1 states that: “It is an objective of the Council to encourage the inclusion of childcare
facilities in school campuses in mixed use areas, residential areas and office areas particularly where
they can make use of identified open space areas”.
The Council will actively encourage childcare facilities in school campuses as part of this objective.
Objective E2 reads: “It is an objective of the Council to retain 2 no. core sites for the provision of 2 No.
primary schools (equivalent) and 1 no. post primary school. The Council shall liaise with the
Department of Education in the development of these site (SLO 112 Map 1)”.
This objective highlights the Council’s forward thinking in terms of the provision of adequate
education facilities to support the needs of the area.
Specific Local Objective (SLO) 112: “To provide for primary and post primary education facilities at
Legionaries of Christ lands and at Stillorgan Industrial Estate/Benildus Avenue”.
This specific objective identifies certain sites, which are in close proximity to the study area, as the
location of primary and post-primary facilities (See Figure 2 below).
Figure 2: UFP - Drawing 11 - Design Principles and Character Areas.
2.8 School Building Programme
The DES provide details on planned construction projects for new school facilities. The following two
projects are listed in the most up-to-date version of this project list (dated 31st August 2019):
Ballyowen Meadows Special School, Beechpark, Stillorgan and Setanta Special School, Beechpark,
Stillorgan (Project 19355S and 20028K) (Status: Stage 2b – Detailed Design). The DES are committed
to providing these educational facilities in the near future, with ‘detailed design’ stage in
8Creche and Schools Demand Assessment
November 2019
commencement already. This will increase the educational capacity of the wider area when
completed.
9Creche and Schools Demand Assessment
November 2019
3.0 Approach
Having regard to the planning policy outlined in the previous section it is evident that an assessment
of the existing childcare facilities in the study area is required. It is imperative that a baseline is
identified which would then allow future demand estimations to be made based on demographic
change and the associated impact of the proposed development. Therefore, a methodology for the
assessment of school and childcare facilities has been developed in accordance with the directions
provided in the aforementioned planning policies involving the following steps:
1. Determining the extent and provision of existing school and childcare facilities within the
wider study area;
2. Undertaking a study of the current and potential future demographic make-up of the study
area’s population; and
3. Estimating the level of demand for childcare and school facilities that may arise from the
development proposal.
The following chapters will utilise this methodology as a structural framework with the currently
existing supply of facilities first established, followed by a demographic analysis that provides valuable
insight into the characteristics of the study area’s population, before finally determining the potential
demand created by the proposed development.
10Creche and Schools Demand Assessment
November 2019
4.0 Supply
In order to establish a baseline of existing capacity in the study area it is necessary to first identify each
of the existing childcare facilities. This was undertaken through a comprehensive desktop research
exercise which used publicly available information and sources. It was decided that Tusla offered the
most appropriate source of information on childcare facilities as it is the dedicated State agency
charged with undertaking a comprehensive reform of child protection, early intervention and family
support services in Ireland. In this regard, they were deemed to provide the most definitive and
accurate source of information on childcare facilities and the selection of facilities was made based
upon their database, which allowed the next stage of assessment to take place.
4.1 Existing Provision
While the various policies referenced do make certain provisions for determining the requirements
for childcare facilities in neighbourhoods, there is no reference to the most appropriate distances
families should travel, or indeed the quantum of facilities that are appropriate in a given area.
Therefore, for the purpose of this study it was deemed appropriate to audit all facilities within a 2km
catchment of the subject site. This distance is roughly equivalent to a 20-minute walk and would be,
therefore, within easy reach of the proposed development.
4.2 Childcare Facilities
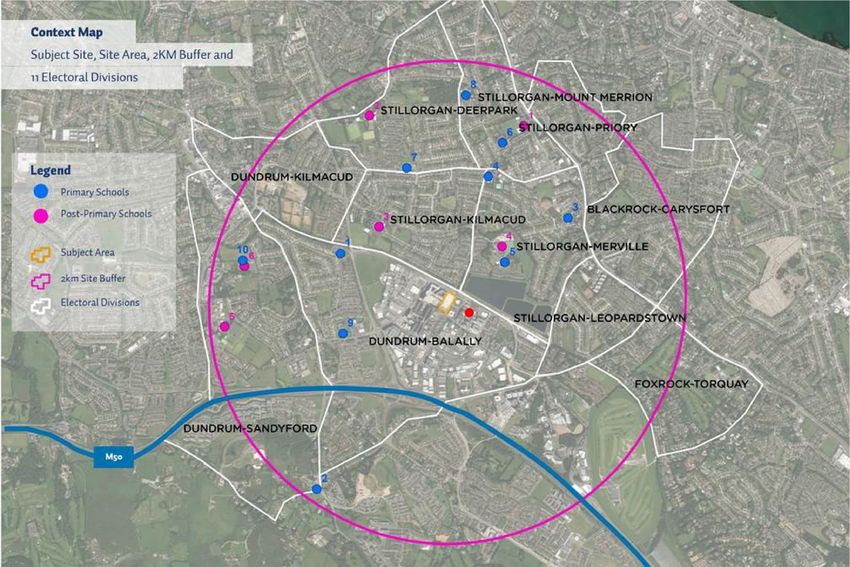
Figure 3 provides the locations of all childcare facilities, registered with Tusla, found within this 2km
study area. The green symbols correspond to each childcare facility. In total there are 41 identified
locations, however some of these operate within the same location but under different names. It
should also be noted that there were several more registered facilities listed on the Tusla database,
however, it was found during the consultation phase that some of these have since ceased operation.
On the accompanying map there is one red symbol which indicates the location of a granted planning
permission for a childcare facility. The permitted application provides for:
• Planning Application Reg. Ref. D15A/0553 relates to a granted permission for change of use
from office use to childcare facility, which would increase the unit size from 375 sq.m to 435
sq.m. The granted development will allow the facility to increase the number of children in its
care to 75, at any one time.
In addition to the existing childcare facilities and granted permission for a new facility, a Strategic
Housing Development application for a site located at the junction of Blackthorn Drive and Carmanhall
Road has been lodged with An Bord Pleanála (Case No. PL06D.304405). The proposed development,
known as RB Central, will include a creche facility of approximately 486 sq.m. While it is acknowledged
that a decision on the application is still pending, if successful the creche that forms part of the
development will further add to the existing supply of childcare facilities in the study area.
11Creche and School Demand Assessment
November 2019
Figure 3: Location of Childcare Facilities and Granted Applications. 12
12Creche and School Demand Assessment
November 2019
4.2.1 Consultation
With the locations of existing childcare facilities identified an assessment of their current capacity
could be completed. With no publicly available data listing the quantum of available childcare spaces
there was a necessity to contact each individual facility and request such information. Due to the
understandably cautious attitudes of childcare facility owners to release such information, this proved
to be a challenging task.
Table 1 offers an overview of the childcare facilities that were located in the study area and responses
when attempts to contact them were made. The numbers that are found in the left column
correspond to those that accompany each of the green icons found on Figure 3. Each of the facilities
contacted during the course of the research were asked to provide information on the total number
of pupils they can facilitate and if they have further capacity to accommodate more. These details are
also provided in the table.
In total, 35 of the 41 facilities provided details of their existing capacity and pupil numbers. In total,
these 35 childcare facilities accommodate 1,642 pupils. Almost all of the 35 facilities claimed to be at
capacity currently, and for the foreseeable future, with waiting lists of prospective pupils extending to
September of 2022 in some cases. Four of the 35 facilities stated they had capacity to enrol additional
pupils, although they would not disclose how many additional pupils. Two facilities advised that they
are set to close in the coming months.
Taking into account the responses received and estimating figures for the facilities that did not provide
responses, it seems reasonable to suggest there are approximately 2,000 childcare spaces in the study
area. Two respondents claimed to have space currently available to enrol more pupils, they are St.
Brigid’s Parish Playschool and Kid’s Biz, however they did not provide details on the total number of
spaces that remain.
13Creche and School Demand Assessment
November 2019
Table 1: Existing Childcare Facilities and Capacities.
Map ID Childcare Facility Eircode No. of Pupils Further Capacity
1 Oatlands Before/After School & 136 No capacity until 2021
Montessori A94KW94
4 Rathdown Community Playgroup D16AX05 Undisclosed Set to close
5 Cocco’s Creche and Montessori A94WY28 42 No capacity until 2021
6 St. Brigid’s Parish Playschool A94P0K1 32 Yes
7 The Playroom Stillorgan 5 No capacity until 2020
9 The Park Academy Childcare Beacon South 130 No capacity until 2020
Quarter D18YV99
12 Narnia Nursery School D16R6V0 24 No capacity until 2020
13 Narnia Nursey School Ltd. D14KX09 22 No capacity until 2020
14 Mountainside Montessori D18YV91 22 No capacity until 2021
15 Roola Boola Creche & Montessori D18EY15 26 No capacity until 2021
16 Roola Boola Creche & Montessori D18EY15 22 No capacity until 2021
17, 18 The Children’s House Montessori Primary 44 No capacity
School A94P499
19 Ballinteer Pre-School D16WK27 22 No capacity until 2021
20 Fontanells Montessori A94R2Y4 22 No capacity
26 Glenalbyn Montessori School A94E7K8 22 No capacity until 2022
27 Knocklyon Lodge Crèche & Montessori Ltd D16FX25 100 No capacity until 2021
30 Giraffe Childcare Leopardstown D18E228 108 No capacity until 2020
32 Giraffe Childcare Central Park D18C432 70 No capacity until 2020
33 Beechwood Childcare N/A 75 No capacity until 2020
34 Cherry Blossom Crèche & Montessori 21 No capacity until 2020
School Ltd. D18P640
35 Clever Clogs D16P025 55 No capacity
36 Little Dale Academy A94K8W7 Undisclosed No capacity
37 Park Montessori School D18N265 17 No capacity until 2020
38, 39, 70 No capacity until 2021
40 Busy Bees Childcare Ltd A94W8C5
41 Carewell Day Nursery & Montessori D16V250 15 No capacity until 2021
42 Gallops Montessori School D18TW13 12 No capacity until 2021
44, 45 Star Tots Creche A94W6W8 94 No capacity until 2021
46 Lakelands Childcare A94HK38 38 No capacity until 2021
47 Cedar Montessori School D18N1N8 33 No capacity until 2021
48 Undisclosed No capacity, would not
The Park Academy Childcare Beacon Court D18V963 disclose pupil numbers
49 Giraffe Childcare Stepaside D18R202 130 No capacity until 2020
51 ABA Preschool Academy D16AX0 36 Spaces for 2019
52 Wise Little Owls Montessori A94CV63 77 No capacity until 2020
53 Kid's Biz D18WV56 36 Yes
54 Hope Montessori Autism Care Centre NA Undisclosed Set to close
4.3 Primary Schools
The DES provides details on enrolment figures for all primary schools on an annual basis. The DES have
also created their own units of analysis, ‘School Planning Areas’ (SPA), through which they compile
data on schools which informs decision-making. Figure 3, taken from the DES website, shows the
Goatstown-Stillorgan SPA which encompasses the subject site (highlighted in yellow). This SPA does
not directly correspond to the study area defined for the purpose of this report, however there is
significant overlap.
14Creche and School Demand Assessment
November 2019
Figure 4: Goatstown-Stillorgan SPA.
Returning to the 2km buffer zone that equates to this report’s study area, DES records show that there
is a total of ten primary schools in the area, five of which fall outside the Goatstown-Stillorgan SPA.
Information on each school for the 2016, 2017 and 2019 academic years is provided in the following
table. The ‘map ID’ refers to the ID number that accompanies the blue symbols in Figure 5.
Table 2: Primary School Enrolments.
Map School Name Eircode 2016-2017 2017-2018 2018-2019
ID Enrolment Enrolment Enrolment
1 St. Olaf’s N.S. D16E067 484 488 494
2 St. Mary’s N.S. D18XV90 264 263 263
3 St. Brigid’s N.S. A94X066 98 92 100
4 S.N. Naomh Lorcan A94KD62 439 448 450
5 St. Raphaela’s N.S. A94R7N8 458 461 456
6 Scoil Caoimhín Naofa A94KW94 443 459 438
7 S.N. Cnoc Anbhil A94E2N7 464 464 477
8 S.N. San Treasa A94EK75 459 452 452
9 Queen of Angels Primary School D16AX05 257 271 296
10 Ballinteer Educate Together N.S. D14Y563 234 274 331
Total 3,600 3,672 3,757
2018-2019 enrolment figures for the ten primary schools in the study area showed an increase on the
figures recorded in 2016-2017, growing by 157 pupils. However, an increase in enrolment numbers
was not recorded in every school, with four schools recording decreases over the three year period
(Map ID 2, 5, 6 and 8). This would indicate that although growth is occurring in overall pupil numbers,
there is still an existing capacity in the area. We also note the identification of a school site in the UAP
and the DES commitment to deliver two additional schools in the wider area.
15Creche and School Demand Assessment
November 2019
4.4 Post-Primary Schools
In terms of post-primary schools, or secondary schools, in the study area, the DES record there being
six facilities. These schools are a mix of fee-paying and public and cater for all genders. The following
table offers an overview of each school and provides the enrolment figures, as obtained from the DES
statistics, for the academic years 2016-2017, 2017-2018 and 2018-2019. It also presents the Map ID
that relates to the pink symbols on Figure 5.
Table 3: Post-Primary School Enrolments.
Map ID School Name Eircode 2016-2017 2017-2018 2018-2019
Enrolment Enrolment Enrolment
1 Oatlands College A94HX38 547 545 536
2 Mount Anville Secondary School D14A8P3 662 675 677
3 St Benildus College A94X886 809 795 783
4 St Raphaela’s Secondary School A94NT29 564 545 563
5 Wesley College D16NX73 930 907 914
6 St. Tiernan’s Community School D16KW26 346 356 343
Total 3,858 3,823 3,816
Enrolment figures for the 2016-2017 academic year indicated that there was a total of 3,858 students
across the six post-primary schools in the study area. This total figure decreased by 35 in the following
academic year (2017-2018) and again by seven the following academic year (2018-2019) with a
combined total of 3,816 pupils. Although it is difficult to discern a trend in enrolment figures through
a study of three consecutive years, it does offer some insight into the flexibility that these schools
have in terms of accepting new students.
Figure 5 highlights the locations of all primary and post-primary schools within the defined study area.
The red symbol corresponds to the location of a granted planning permission for a primary school
facility. The permitted application provides for:
• Planning Application Reg. Ref. D18A/1210: Permission for the change of use of the existing
building to a temporary two storey primary school (c. 822.10 sq.m) with required internal and
elevation modifications necessary to accommodate the proposed education use. Temporary
permission for a period no longer than five years is being sought while a new primary school
building is being developed.
16Creche and School Demand Assessment
November 2019
Figure 5: Location of Primary and Post-Primary Schools.
17Creche and School Demand Assessment
November 2019
5.0 Demand
5.1 Demographic Profile
The following section will outline the demographic profile of the study area in order to provide a
baseline that can be used to predict future demand. As previously stated, the study area was defined
through the selection of all relevant EDs that intersected with a 2km buffer created around the subject
site. In total, there are 11 EDs within this area. Table 4 provides an overview of each ED along with the
population of each as recorded in both the 2011 and 2016 Census. It also offers the percentage change
in population during this period as a means of highlighting growth patterns.
Table 4: Population Change 2011-2016.
ED Name Population Population Population Change Percentage Change
2011 2016 2011-2016 2011-2016
Blackrock-Carysfort 6,160 6,318 158 2.6%
Dundrum-Balally 7,049 8,035 986 14.0%
Dundrum-Kilmacud 3,196 3,274 78 2.4%
Dundrum-Sandyford 6,952 7,688 736 10.6%
Foxrock-Torquay 1,439 1,445 6 0.4%
Stillorgan-Deerpark 2,793 2,955 162 5.8%
Stillorgan-Kilmacud 3,828 3,973 145 3.8%
Stillorgan-Leopardstown 2,429 2,714 285 11.7%
Stillorgan-Merville 2,744 3,217 473 17.2%
Stillorgan-Mount Merrion 2,407 2,383 -24 -1.0%
Stillorgan-Priory 2,229 2,195 -34 -1.5%
Total 41,226 44,197 2971 7.2%
In total, there are 44,197 persons recorded as resident in the study area on the night of the 2016
Census. This amounts to an increase of 2,971 persons from the 2011 Census results, which is a 7.2%
increase. Considering the geographical location of the study area, which is a suburban district in South
Dublin, it is no surprise to see growth levels such as this, as they reflect the popularity of the city and
region.
Change that has already occurred is generally an accurate indicator of future trends, however it is
appropriate to undertake a more detailed analysis. FAC have employed a methodology for modelling
population projections which is termed ‘cohort component modelling’1. Table 5 utilises this method
and focuses on the existing population and the natural increases that will occur up to the year 2026
across the 11 EDs. This method discounts any potential population increase that may occur as a result
of the proposed development as it focuses on natural growth rather than speculative growth resulting
from potential residential developments.
1
FAC’s projection of population is underpinned by the application of the demographic cohort component methodology
(CCM); the same methodology as used by the Central Statistics Office in preparing the national projections. CCM is widely
used internationally as a best-in-class methodology. It provides a flexible and powerful approach to population projection by
using varying comparative scenarios, each tailored around the application of qualified assumptions in mortality, fertility and
migration (as aligned with the Central Statistics Office’s assessments).
18Creche and School Demand Assessment
November 2019
Table 5: Population Projections using Cohort Component Modelling.
ED Name Population Population Population Change Percentage Change
2016 2026 2016-2026 2016-2026
Blackrock-Carysfort 6,318 7,436 1,118 17.7%
Dundrum-Balally 8,035 10,018 1,983 24.7%
Dundrum-Kilmacud 3,274 4,017 743 22.7%
Dundrum-Sandyford 7,688 9,664 1,976 25.7%
Foxrock-Torquay 1,445 1,685 240 16.6%
Stillorgan-Deerpark 2,955 3,342 387 13.1%
Stillorgan-Kilmacud 3,973 4,495 522 13.1%
Stillorgan-Leopardstown 2,714 3,264 550 20.3%
Stillorgan-Merville 3,217 3,789 572 17.8%
Stillorgan-Mount Merrion 2,383 2,759 376 15.8%
Stillorgan-Priory 2,195 2,606 411 18.7%
Total 44,197 53,076 8,879 20.1%
As Table 5 shows, the population projections for the study area reinforce the existing trends that
indicate this area is a popular and attractive location for people to settle. An overall growth of 20.1%
of 2016 figures is predicted, which amounts to a total growth of 8,879 persons across all EDs. Clearly,
the likelihood is that the study area, as is the case with the wider Dublin region, will continue to
experience a strong growth in population over the coming years.
Of course, while the overall levels of population change can offer some insights into the required
amenities and infrastructure that a particular location needs, it is far more beneficial to understand
the changes occurring to specific cohorts, or age categories. Table 6 provides a breakdown of the
recorded population change and the projections made as part of this study, categorised by age. It
offers a breakdown of the area’s age profile that allows analysts a more detailed overview of the
specific cohorts that will experience the greatest change. Different cohorts of a population have
different requirements, with young families in need of childcare and education facilities, a strong
working population requiring employment opportunities, and those of retirement age possessing
alternative requirements.
Table 6: Age Cohort Breakdown by Year.
Age Cohort 2016 Population % of 2016 Total 2026 Population % of 2026 Total
0-4 2,778 6.3% 3,561 6.7%
5-9 2,584 5.8% 3,388 6.4%
10-14 2,297 5.2% 2,899 5.5%
15-19 2,474 5.6% 2,744 5.2%
20-24 3,204 7.2% 3,103 5.8%
25-29 3,717 8.4% 3,997 7.5%
30-34 4,045 9.2% 4,427 8.3%
35-39 3,868 8.8% 4,413 8.3%
40-44 2,916 6.6% 4,421 8.3%
45-49 2,568 5.8% 4,045 7.6%
50-54 2,605 5.9% 2,994 5.6%
55-59 2,402 5.4% 2,592 4.9%
60-64 2,215 5.0% 2,573 4.8%
65+ 6,524 14.8% 7,920 14.9%
Total 44,197 100% 53,076 100%
19Creche and School Demand Assessment
November 2019
Using Census 2016 data it is possible to establish the current population of persons aged 0 to 19 years.
It is found that this particular cohort amounts to 10,133 people. This is approximately 22.9% of the
overall total.
The age cohorts which are projected to record the largest percentage change over the projected 10-
year period are: the 20 to 24 group, which is anticipated to see a 1.4% reduction in its overall
proportion of the study area’s total population, reducing from 3,204 in 2016 to 3,103 in 2026; the 40
to 44 age cohort is projected to witness an increase from 2,916 in 2016 to 4,421 in 2026, which is
forecasted to see its proportion of the total grow by 1.7%; and the 45 to 49 age cohort, where a growth
rate of 1.8% is anticipated between 2016 to 2026, resulting in its population growing from 2,568 in
2016 to 4,045 in 2026.
The 0 to 4 age cohort is the most relevant to this study as it comprises the standard target age range
for childcare facility providers. In 2016 this cohort of the population amounted to 6.3% of the overall
total population. This is projected to increase to 6.7% of the total population in 2026, which in real
terms will see a total figure of 3,561. Although an increase occurs, it is not an overly significant rise
with an additional 783 children of this age category projected to reside in the study area.
It is also worth noting the proportion of the population that are of school-going age, which we will
consider to be those persons aged between 5 and 19. The datasets used for this study did not offer a
breakdown of age by each year and as a result it is difficult to split the population into primary and
post-primary school-goers. In 2016, approximately 16.6% (7,355) of the area’s population were aged
5 to 19 and, therefore, could be considered as the school-going population. The proportion of school-
goers to increase to 17.1% (9,031) of the total population in 2026.
5.2 Impact of the Proposed Development
The proposed development consists of a mix of residential apartments totalling 564 units. This total is
divided between the different apartment sizes as follows: 46 no. studio apartments; 205 no. one
bedroom apartments; 295 no. two bedroom apartments; and 18 no. three bedroom apartments. As
per the policy guidelines there is no requirement to include studio or one bedroom apartments in any
analysis of the likely generated demand on childcare facilities that may arise from a proposed new
development. This means that both the studio and one bedroom apartments can be excluded from
the analysis. A final count on the total number of two and three bed apartments in the scheme
amounts to 313 no. units. Two scenarios have been investigated in this regard.
Scenario A: Census 2016 statistics record Ireland’s average household size as being 2.73 persons per
unit, however the average household size for the study area is slightly less at 2.71 persons per unit2.
Taking the latter and applying the 2016 figure for the proportion of children aged 4 or under (6.3%),
it is possible to estimate the total number of residents that may reside in the future proposed
development. The projected figures for 2026 are also used in this scenario as they offer a comparison
between current and future potential demand. Table 7 provides an understanding of the method
through which a final total for pre-school children could be arrived at.
2
CSO statistics for the 11 EDs records a total of 44,197 residents found throughout 16,311 households.
20Creche and School Demand Assessment
November 2019
Table 7: Scenario A Methodology for Pre-School Children.
No. of Units Persons per Unit No. of Residents % 0-4 Population No. of 0-4
2016 Census Proportion
564 2.71 1,528 6.3% (2016) 96
313 2.71 848 6.3% (2016) 53
2026 Projection Proportion
564 2.71 1,528 6.7% (2026) 102
313 2.71 848 6.7% (2026) 57
Calculations were made using the average persons per unit figure and both the total unit count and
the reduced unit count (based on the childcare guidelines). Taking the reduced apartment figure of
313, which excludes all studio and one bed apartments, the total number of potential residents within
these units came to 848 persons. When the 2016 proportion of 0 to 4 year olds is applied to this figure
we get an approximate figure of 53 children of this age cohort who could be accommodated within
the development. Using the 2026 projections we see that 57 children aged 0 to 4 could be
accommodated in the scheme when the studio and one-bedroom apartments are discounted.
If we apply this methodology to the cohort of the population that are of school going age, we can
determine the approximate number that could reside in the proposed development. As highlighted in
a previous section the proportion of children aged between 5 and 19 found in the study area is
approximately 16.6% of the overall total, rising to 17.1% of the total under the 2026 projected
scenario. Table 8 offers an estimation of the total school-aged population for the proposed
development, once more including and excluding one-bedroom apartments.
Table 8: Scenario A Methodology for School-Aged Children.
No. of Units Persons per Unit No. of Residents % 5-19 Population No. of 5-19
2016 Census Proportion
564 2.71 1,528 16.6% (2016) 254
313 2.71 848 16.6% (2016) 141
2026 Projection Proportion
564 2.71 1,528 17.1% (2026) 261
313 2.71 848 17.1% (2026) 145
Scenario B: Another method of determining the approximate number of pre-school children that
could potentially reside in any future proposed development is through an analysis of the Census
household data. By analysing the household formations found in Dún Laoghaire-Rathdown it is
possible to estimate the proportion of households that contain children. The Census records private
households by type, with categories that range from a single occupant to married couples and
children. In Dún Laoghaire-Rathdown, it is found that approximately 46% of all households contain
children. This figure is an aggregate of all the categories that specifically refer to children being among
the inhabitants of a household.
Table 9 takes this figure and, through logical reasoning, applies it to the proposed development under
the full analysis scenario (with all units included) as well as the limited analysis scenario which removes
all single unit apartments. The population projections to 2026 are also utilised to offer alternative
options. Under the full unit scenario, a total of 44 children aged between 0 and 4 years is estimated,
while under the limited scenario there is a total of 25 in 2016. While under the full unit scenario, a
total of 47 children aged between 0 and 4 years is estimated and under the limited scenario total of
26 is estimated in 2026.
21Creche and School Demand Assessment
November 2019
Table 9: Scenario B Methodology for Pre-School Children.
Total Units Units with Persons/Unit Residents % 0-4 No. of 0-4
Children (46%)
2016 Census Proportion
564 259 2.71 703 6.3% (2016) 44
313 144 2.71 390 6.3% (2016) 25
2026 Projection Proportion
564 259 2.71 703 6.7% (2026) 47
313 144 2.71 390 6.7% (2026) 26
Once more, we apply the same methodological approach to determine the potential number of
children that are of school-going age, as outlined in Table 10 below. It takes the 16.6% figure from
2016 and applies this to both full unit count and reduced unit count, and also takes the 17.1% figure
from the 2026 projections and does the very same.
Table 10: Scenario B Methodology for School-Aged Children.
Total Units Units with Persons/Unit Residents % 5-19 No. of 5-19
Children (46%)
2016 Census Proportion
564 259 2.71 703 16.6% (2016) 117
313 144 2.71 390 16.6% (2016) 65
2026 Projection Proportion
564 259 2.71 703 17.1% (2026) 120
313 144 2.71 390 17.1% (2026) 67
It is worth noting that Census data (2011 and 2016) show that 60% of privately rented households
within DLR Council area do not have children. Applying this to the proposed development, this would
mean that 188 of the two and three bedroom dwellings would not include children.
To break this down further, we specifically examined the characteristics of typical renters in the area.
It was found that, 24.5% of current renters within DLR Council are married or cohabiting couples with
no children. 35.5% of privately rented households are occupied by single persons. The proposed
scheme will be a PRS Scheme. We can therefore apply these characteristics to the scheme which will
be wholly rented accommodation. Table 11 below provides a breakdown demonstrating that the
expected number children to occupy the scheme on this basis is 21.
Table 11: Projected Number of Pre-School Children Expected within a PRS Scheme.
Total Units Units with Persons/Unit Residents % 0-4 No. of 0-4
Children (40%)
2016 Census Proportion
564 226 2.71 611 6.3% (2016) 39
313 125 2.71 339 6.3% (2016) 21
2026 Projection Proportion
564 226 2.71 611 6.7% (2026) 41
313 125 2.71 339 6.7% (2026) 23
22Creche and School Demand Assessment
November 2019
The above analysis indicates that based on 2016 Census information and the characteristics of the
occupants of rented accommodation, the proposed PRS scheme will only accommodate 21 children
between the ages of 0 to 4 years. For completeness, the same scenario has been projected for 2026
which indicates that 23 children aged 0 to 4 years would be accommodated.
5.3 Further Analysis/Observations
Although the analysis performed on the study area initially indicates that there is an existing issue with
capacity in terms of childcare facilities, and that the projected population of the relevant age cohort
is set to grow in the coming decade, it does not offer a holistic view of the current conditions.
5.3.1 Accessibility
Firstly, this area of Dublin is one of the most accessible and well-connected locations in the country,
possessing a range of public transport options, along with an extensive road network. Parents of young
children tend to drive them to childcare facilities and school; therefore, it would be incorrect to
assume that parents will only select a childcare facility based upon its proximity to their home. Instead,
it is more likely the parents will choose to enrol their children in locations closer to where they work,
facilities that have been recommended, or in areas they have previous experiences with. In this regard,
it is useful to highlight the approximate distances that a person can travel by car from the study area.
Figure 6 is the visualisation of a drivetime analysis performed for this study which shows the extent to
which a person could travel by car in set times. This is useful as it showcases the geographical reach
that people living in the area and in possession of a private car have. The extent to which they can
travel in such short spaces of time provides even greater opportunity and choice when selecting a
childcare facility. As it shows, almost the entirety of Dún-Laoghaire Rathdown is accessible within 15
minutes, while parts of Dublin City, South Dublin Council and North Wicklow are also achievable in
this time. In other words, the range of childcare facilities and schools available to parents goes far
beyond the imposed limits of the study area.
5.3.2 Quarterly National Household Survey
While the drivetime analysis highlights the wide geographical extent within which parents of pre-
school children could feasibly seek out childcare facilities, it does not address the level of take-up that
occurs. The CSO’s Quarterly National Household Survey (QNHS) release produced a special study
specifically on childcare for Q3 of 20163. This release is especially relevant for the purposes of this
study as it indicates the extent to which childcare facilities are utilised by the general population. Table
12 is an adaption of a similar table found in the QNHS and it shows the range of methods parents
utilise for the purposes of caring for their pre-school children.
3
The QNHS is released by the CSO each quarter and surveys a random sample of the population. Percentage totals may
amount to over 100% due to some respondents providing multiple answers.
https://pdf.cso.ie/www/pdf/20170706100048_QNHS_Childcare_Quarter_3_2016_full.pdf
23Creche and School Demand Assessment
November 2019
Table 12: Type of Childcare Utilised.
Type of Childcare Dublin State
Parent/Partner 62% 62%
Unpaid Relative/Friend 16% 17%
Paid Relative/Friend 3% 3%
Childminder/Au-Pair/Nanny 8% 13%
Childcare Facility 25% 19%
Other 1% 1%
Interestingly, the vast majority of pre-school children are cared for by parents while a total of 25% of
respondents in Dublin stated that they use childcare facilities. The State average is even lower, with
approximately 19% of respondents claiming they use childcare facilities. It is reasonable to assume
that the CSO’s QNHS is an accurate and representative measure of the population, therefore, applying
it to the estimations previously made on total pre-school children is a logical step. Table 13 provides
the figures that were arrived at under both ‘Scenario A’ and ‘Scenario B’ under the 2016 Census figures
in Section 5.2. It uses these figures, for both total unit number and reduced unit number, and applies
the 25% figure of Dublin based respondents who stated they use childcare facilities.
Table 13: Scenarios A and B 2016.
# of Units # of 0-4 Year Olds Total @ 25%
Scenario A (2016) 564 96 24
313 53 13
Scenario B (2016) 564 44 11
313 25 6
As Table 13 shows there would be a significant reduction in the total amount of children that require
access to childcare facilities, under both scenarios and with both unit counts. The reduced unit count
in Scenario A would see approximately 13 children requiring facilities, whereas the reduced unit count
in Scenario B would leave only 6 children requiring such facilities. It is, therefore, entirely possible that
sufficient capacity currently exists to accommodate these children if the proposed development was
to take place. Table 14 applies the 2026 projections to the same methodology.
Table 14: Scenarios A and B 2026.
# of Units # of 0-4 Year Olds Total @ 25%
Scenario A (2026) 564 102 25
313 57 14
Scenario B (2026) 564 47 12
313 26 7
5.4 Recommendations
As the analysis shows, there is no definitive method of establishing the potential number of pre-school
children that may be resident in the proposed development. All methods are based upon various
assumptions and estimates, with the most logical methodology usually offering an appropriate
compromise. Of the multiple assumptions made it was decided that those made under Scenario A,
utilising the projections to 2026 and the reduced unit count (as per the Guidelines), offered the most
logical conclusion.
24You can also read