The Gendered Division of Paid and Domestic Work under Lockdown - IZA DP No. 13500 JULY 2020
←
→
Page content transcription
If your browser does not render page correctly, please read the page content below
DISCUSSION PAPER SERIES

IZA DP No. 13500

The Gendered Division of Paid and
Domestic Work under Lockdown

Alison Andrew             Angus Phimister
Sarah Cattan              Almudena Sevilla
Monica Costa Dias
Christine Farquharson
Lucy Kraftman
Sonya Krutikova

JULY 2020
DISCUSSION PAPER SERIES

IZA DP No. 13500

The Gendered Division of Paid and
Domestic Work under Lockdown

Alison Andrew                                                  Lucy Kraftman
IFS                                                            IFS
Sarah Cattan                                                   Sonya Krutikova
IFS and IZA                                                    IFS
Monica Costa Dias                                              Angus Phimister
IFS and IZA                                                    IFS
Christine Farquharson                                          Almudena Sevilla
IFS                                                            UCL and IZA

JULY 2020

Any opinions expressed in this paper are those of the author(s) and not those of IZA. Research published in this series may
include views on policy, but IZA takes no institutional policy positions. The IZA research network is committed to the IZA
Guiding Principles of Research Integrity.
The IZA Institute of Labor Economics is an independent economic research institute that conducts research in labor economics
and offers evidence-based policy advice on labor market issues. Supported by the Deutsche Post Foundation, IZA runs the
world’s largest network of economists, whose research aims to provide answers to the global labor market challenges of our
time. Our key objective is to build bridges between academic research, policymakers and society.
IZA Discussion Papers often represent preliminary work and are circulated to encourage discussion. Citation of such a paper
should account for its provisional character. A revised version may be available directly from the author.

                                                     ISSN: 2365-9793

                                           IZA – Institute of Labor Economics
Schaumburg-Lippe-Straße 5–9                      Phone: +49-228-3894-0
53113 Bonn, Germany                             Email: publications@iza.org                                    www.iza.org
IZA DP No. 13500 JULY 2020
ABSTRACT
The Gendered Division of Paid and
Domestic Work under Lockdown1
COVID-19 has uprooted many aspects of parents’ daily routines, from their jobs to their
childcare arrangements. In this paper, we provide a novel description of how parents
in England living in two-parent opposite-gender families are spending their time under
lockdown. We find that mothers’ paid work has taken a larger hit than that of fathers’, on
both the extensive and intensive margins. We find that mothers are spending substantially
longer in childcare and housework than their partners and that they are spending a larger
fraction of their paid work hours having to juggle work and childcare. Gender differences
in the allocation of domestic work cannot be straightforwardly explained by gender
differences in employment rates or earnings. Very large gender asymmetries emerge when
one partner has stopped working for pay during the crisis: mothers who have stopped
working for pay do far more domestic work than fathers in the equivalent situation do.
JEL Classification: J21, J22, J24, J33, J63
Keywords: COVID-19, gender, childcare, Coronavirus
Corresponding author:
Almudena Sevilla
University College London
55-59 Gordon Square
London WC1H 0NT
United Kingdom
E-mail: A.Sevilla@ucl.ac.uk
1
The authors are grateful to the Nuffield Foundation for funding this work (grant EDO/FR- 000022584). The
Nuffield Foundation is an independent charitable trust with a mission to advance educational opportunity and
social well-being. It funds research that informs social policy, primarily in Education, Welfare and Justice. It also
provides opportunities for young people to develop skills and confidence in science and research. The Foundation
is the founder and co-funder of the Nuffield Council on Bioethics, the Nuffield Family Justice Observatory and the
Ada Lovelace Institute. Almudena Sevilla thanks the European Research Council for funding her time through the
PARENTIME project. Co-funding from the ESRC-funded Centre for the Microeconomic Analysis of Public Policy (ES/
M010147/1) is gratefully acknowledged by IFS researchers. The authors are grateful for extremely useful comments
from Paul Johnson and Carl Emmerson, and for meticulous copy-editing by Judith Payne. The analysis in this paper
was previously published as an IFS briefing note: https://www.ifs.org.uk/publications/14860.1. Introduction
The COVID-19 crisis has caused drastic changes to the work and domestic lives of many
families around the world. In England, millions of adults have lost work either temporarily or
permanently, and many more are predicted to follow. Others are newly working from home,
while key workers are experiencing increased demand for work outside the home that carries
high health risks. Parents are facing especially challenging circumstances as schools and
childcare facilities closed down and they were left with the full responsibility of caring for and
educating their children from home.
In the early days of the crisis many hypothesised that COVID-19’s effects on work, both paid
and domestic, may differ starkly by gender in ways that earlier economic downturns did not
(Alon et al. 2020, Hupkau and Petrongolo 2020). However, the direction of these effects is still
ambiguous. For instance, back in February the locked-down sectors of the economy
disproportionately employed women, putting their jobs at particularly high risk (Joyce and Xu
2020). On the other hand, women were also more likely than men to be key workers or to work
in occupations that can be done from home, two traits that contribute to keeping their jobs safe
(Blundell et al. 2020). Among parents, mothers are traditionally the main providers of childcare
and accumulate a disproportionate amount of housework (Gimenez-Nadal and Sevilla, 2012). It
seems natural to assume that they will shoulder most of the additional domestic responsibilities
created by the pandemic crisis. But if fathers do take on some of the additional domestic
responsibilities, even if not to the same extent as mothers, it may help accelerate changes in
norms and attitudes towards more balanced gender roles.
This paper is one of the first to shed light on these effects. We use newly collected data to
describe, during the initial stages of COVID-19, how the crisis is affecting mothers and fathers in
two-parent opposite-gender families. We describe how the labour market outcomes of mothers
and fathers are responding to the crisis as well as how parents are dividing their time between
childcare, housework and paid work during the lockdown. Where possible, we use the 2014/15
UK Time Use Survey to provide comparable pre-crisis estimates. We go onto examine gender
asymmetries in responses to the crisis, using the shock to examine whether gender gaps in the
allocation of domestic and paid work responsibilities can be explained by comparative
advantage in the labour market. To investigate this hypothesis we study heterogeneity in the
division of household responsibilities by both partners’ labour-market circumstances, both in
terms of the relative earnings of partners prior to the crisis and in terms of shocks related to
COVID-19.2
We find that hours of paid work have fallen dramatically during the lockdown period for both
mothers and fathers. The average parent in our sample (including those not working for pay) is
now working for pay during just three hours a day; in 2014/15 the comparable figure was 6 ½
hours. However, mothers’ paid work has shrunk proportionally more than fathers’, both in terms
of working status and hours of work among those actively in work. In 2014/15, mothers were in
paid work at 80% of the rate of fathers; the comparable figure has now dropped to 70%.
Mothers in paid work used to work an average of 73% of the hours that fathers worked; this has
fallen to 68%. Moreover, the quality of time at work matters for productivity and learning, which
in turn may impact future earnings and career progression. Multi-tasking and interruptions are
key deterrents of productivity during time at work. Indeed recent evidence suggests that task
juggling can result in losses of productivity and earnings (Adams-Prassl 2020; Coviello et al.
2014). To gain insight into how the crisis is affecting the productivity of parents at work, we
measure how much uninterrupted paid work they do. We find that mothers and fathers doing
paid work used to be interrupted during the same proportion of their work hours before the
crisis; now mothers are interrupted over 50% more often.
2
Single parents face different challenges around how to meet, often on their own, the increased childcare and
housework responsibilities the crisis has created. Studying single parents raises specific issues that we do not
address in this report.
2 © Institute for Fiscal StudiesThis adds up to a particularly bleak picture of how mothers’ work has held up. Overall, in
2014/15, the average mother (including those who did not work for pay) was doing nearly 60% of the
number of uninterrupted work hours that the average father did; now she is doing only 35%. Past
research shows that the time women take off when having a child, and the reduction in hours
once they return to work, have long-term effects, reducing their future hourly wages (Blundell et
al. 2016). There is a risk, therefore, that the differences we find in how the work hours of fathers
and mothers are being affected by this crisis will contribute to accentuating gender gaps in
career progression and earnings.
The gender differences in paid work during this crisis are counterbalanced by unequal gender
responses in domestic responsibilities to the large shock to childcare provision due to school
and childcare closures. Mothers are doing a greater share of housework and childcare than
fathers are, coming to around 2 hours more per day of each.3 However, these gaps between
mothers and fathers time-use are not straightforwardly explained by mothers’ lower employment
rates or lower earnings. Indeed, gender gaps in time use remain even when comparing mothers
and fathers currently working for pay, or mothers and fathers not currently in paid work.
We exploit the variation across couples in terms of asymmetric labour market shocks to check
whether the division of domestic work are driven by relative opportunity costs of partners as
economic household models would predict (Chiappori 1988; Chiappori 1992; Becker 1965). If
specialization in the family is a response to the economic incentives that couples face, then we
would expect that fathers assume the primary role at home in couples where the mother is the
main earner or where only her job remains active.
We examine whether this is the case in two ways. First, by comparing the division of domestic
and paid work in families where either the mother or the father are the primary earners prior to
the crisis and both remain in work during lockdown; and second, by looking at the allocation of
domestic work between partners when one partner stopped working, depending on the gender
of that partner. We find that mothers still do more childcare and the same amount of housework
as their partner even when they were the primary earner in the family prior to the crisis.
Moreover, mothers who have stopped working for pay during lockdown while their partner
continues to work do twice as much childcare and housework as their partner. But in families
where the father has stopped working, the parents share childcare and housework equally,
while the mother also does an average of 5 hours of paid work a day. We conclude that
evidence from this shock does not support the hypothesis that comparative advantage in the
labour market explains why mothers do so much more domestic chores than fathers.
While the average gender-disparity in domestic work remains large, we find that fathers’
participation in childcare has seen a huge proportional increase from its pre-crisis levels.
Whereas, on an average school day in 2014/15, the average father in two-parent opposite-
gender households did some childcare during 4 hours of the day, this has doubled under
lockdown to 8 hours. To what extent this increase persists as lockdown comes to an end is
perhaps the biggest unknown in what the long-run effects of COVID-19 on gender equality in
the labour market will be.
Our paper contributes to the recent literature using real-time data to document that women do
more childcare and housework than men during the COVID19 pandemic. Adams-Prassl et al.
(2020a) asked men and women to report hours spent looking after children and home-schooling
during lockdown in the UK. They find that women do approximately an hour and a half more
childcare per workday than men, but there is no analysis of the relationship with employment.
Sevilla and Smith (forthcoming) directly compare the allocation of childcare within the same
household before and after lockdown, and show that women who do a greater share of home
childcare pre-COVID-19 are more likely not to be working during COVID-19. Farre and
Gonzalez (2020) use a self-selected sample of Spanish households to show that there has
been a shift to a more equal distribution of housework (driven mainly by men taking
3
Our results are consistent with what Adams-Prassl et al. 2020a and Sevilla and Smith (2020) found for the UK, and
with similar estimates for Spain by Farre and Gonzalez (2020) and for Italy by Del Boca et al. (2020).
© Institute for Fiscal Studies 3responsibility for shopping) and childcare. Daniela Del Boca, Noemi Oggero, Paola Profeta, Mariacristina Rossi (2020) use data on a representative sample of 800 Italian working women collected before and during the emergency to compare the number of hours spent at work, on housework and childcare before the emergency (April and July 2019) to the hours spent during the first three months of the emergency (April 2020). They find that most of the additional responsibilities have fallen to women, though childcare activities are shared more equally than housework. Compared to previous studies, we analyse time- use data for each hour slot in the day and find that women are doing childcare during more hours of the day than men (during ten of the hour-long slots compared to eight). We also look at how childcare relates to employment and find that men’s childcare is more sensitive to their employment. The paper proceeds as follows. In the next section, we discuss our survey, sample and methods of analysis. In section 3 we provide descriptives of parents’ paid work before moving onto descriptives of timeuse in section 4. In section 5, we examine the extent to which the patterns we find can be straightforwardly explained by gender differences in employment rates and pre-crisis earnings. Section 6 concludes. 4 © Institute for Fiscal Studies
2. Sample, Survey and Analysis
Sample

We surveyed 4,915 parents in England who lived with their children between 29 April and 15
May 2020. In particular, to be eligible for inclusion, parents had to be living with (at least one)
child in one of eight different school years.4 These school years corresponded (roughly) to
having a child aged between 4 and 15.

Our sample is limited to opposite-gender two-parent households, of which we have 3,591 in the
data. While this group include the majority of parents, this work is not necessarily representative
of how parents as a whole are experiencing lockdown. The analysis does not include single
parents, who make up 14.8% of families in England.5 Single parents are likely to face particular
challenges due to even more-exacerbated time pressures (Cattan et al. 2020). Since most
single-parent households are headed by women, this is particularly important for how the crisis
will affect mothers and fathers differently. Likewise, the analysis does not include households
with two parents of the same gender, who typically divide up responsibilities differently from
opposite-gender parents (Andresen and Nix 2019). Both groups merit specific and careful
analysis.6

Survey

Participants were recruited through a well-reputed online survey company and received a small
payment in compensation for their time. We ensured that respondents were diverse in terms of
their gender, education, region, marital status, work status and the job they did.

The main aim of our survey was to collect detailed information on how families and children
spend their time on a term-time weekday. We asked the surveyed parent and their partner to fill
in an online time-use diary, telling us what activities they did during each hour of the day. We
also asked the surveyed parent to fill in a similar diary about their child’s time use (selecting one
child at random in multi-child families), and asked who the child was with during each time slot.
Finally, we collected information about the types of home learning activities children are doing,
what resources have been provided by the school and what resources are available at home for
learning.

In order to keep the survey a manageable length for families, we asked about time use in one-
hour slots. Since these are wider than the 10-minute intervals used in the most detailed time-
use surveys, such as the 2015 UK Time Use Survey, we cannot say precisely how long
respondents spent on a particular activity; respondents could report multiple activities during the
hour, so the apparent number of hours might overstate how long the respondent spent on the
activities in that category. Instead, we comment on the number of one-hour slots during which
doing at least some of a particular activity is reported.

4
    We interviewed parents with children entering Reception next year and those with children in school in Reception
    and in Years 1, 4, 5, 8, 9 and 10.
5
    https://www.ons.gov.uk/peoplepopulationandcommunity/birthsdeathsandmarriages/families/bulletins/
    familiesandhouseholds/2019.
6
    While the size of this data set is sufficient to carry out a detailed analysis of how opposite-gender two-parent
    households (the majority group) are experiencing the crisis, the size limits our ability to conduct specific analysis of
    these two important groups that addresses the particular challenges each may be facing. As larger data sets
    collected during the crisis are released (for example, the Understanding Society panel), more analysis of these
    groups will be possible.

© Institute for Fiscal Studies                                                                                                 5
Analysis
While we comment at points on the ways in which our data appear consistent, or inconsistent,
with theoretical ideas and past empirical evidence on household organisation, all analysis we
present in this paper is descriptive. We present average time use across mothers and fathers
and, at various points, also split by other dimensions of heterogeneity (for example, past relative
earnings or which partner experienced job loss during the crisis).
Table 1 presents basic descriptives of the prior economic situation of the families in our sample.
To examine the representativeness of our sample across these characteristics, we constructed
a sample of respondents from the nationally representative 2019 Labour Force Survey (LFS)
who were roughly equivalent to our population of interest: parents with at least one child
between the ages of 2 and 15.7 Columns 1 and 2 of Table 1 show means for this nationally
representative sample and for our sample. We see that our sample systematically contains
larger proportions of higher earners and more-educated individuals than does the LFS.
Importantly, we also see that our unweighted sample contains a higher proportion of individuals
who work in industries that have been locked down during the crisis.
Therefore, so that our analysis is representative of the situation in England as a whole, we
reweight our sample by key characteristics to ensure that it better matches the distribution of
characteristics observed in the LFS. In particular, we reweight on: family structure, women’s
education, men’s education, prior (pre-pandemic) employment, women’s 2019 pre-tax earnings,
men’s 2019 pre-tax earnings, women’s industry ( particularly whether they work in an industry
where more than 50% of jobs have been locked down), men’s industry (ditto), women’s
occupation (particularly whether working from home is possible), men’s occupation (ditto), and
geographic region.8 To do this, we pool our data with the LFS sample and use regression
th th
analysis to calculate appropriate weights. We truncate our weights at the 10 and 90
percentiles to prevent our analysis being overly sensitive to a few observations.
Column 3 of the table shows means for the reweighted sample. We see that the average
characteristics of this reweighted sample are now very similar to the nationally representative
LFS sample. Reassuringly, the reweighted sample also matches various moments well that we
didn’t directly reweight on.
Table 1. Means for our survey sample (weighted and unweighted) compared with
nationally representative LFS sample
(1) (2) (3)
Comparable Our sample, Our sample,
LFS sample unweighted reweighted
Characteristics reweighted on
Women’s education
GCSEs or less 0.367 0.256 0.336
A levels 0.249 0.276 0.256
University degree 0.384 0.469 0.408
Men’s education
GCSEs or less 0.416 0.299 0.377
A levels 0.229 0.238 0.237
University degree 0.354 0.463 0.386
7
The LFS only has information on children’s ages in groups, meaning that we were not able to select households with
children of the exact ages that would make them eligible for our survey.
8
The share of jobs in an industry subject to the lockdown and the share of jobs in each occupation that can be done
from home are calculated using the methods set out in Costa-Dias et al. (2020)
6 © Institute for Fiscal Studies(1) (2) (3)
Comparable Our sample, Our sample,
LFS sample unweighted reweighted
Prior employment
Women’s pre-crisis employment 0.745 0.732 0.753
Men’s pre-crisis employment 0.935 0.879 0.917
Women’s pre-crisis earnings
£0–£9,999 0.476 0.303 0.448
£10,000–£24,999 0.285 0.422 0.300
£25,000–£39,999 0.151 0.131 0.149
£40,000+ 0.089 0.144 0.103
Men’s pre-crisis earnings
£0–£9,999 0.131 0.090 0.142
£10,000–£24,999 0.206 0.330 0.214
£25,000–£39,999 0.301 0.255 0.303
£40,000–£59,999 0.188 0.166 0.186
£60,000+ 0.174 0.159 0.154
Pre-crisis industry
Proportion working in industry
where 50%+ of jobs have been
locked down
Women 0.231 0.322 0.260
Men 0.264 0.325 0.286
Pre-crisis occupation
Proportion working in occupation
where home working is possible
in 0–15% of jobs
Women 0.327 0.313 0.322
Men 0.362 0.346 0.355
Proportion working in occupation
where home working is possible
in 15.1–75% of jobs
Women 0.237 0.210 0.213
Men 0.192 0.270 0.209
Proportion working in occupation
where home working is possible
in 75.1–100% of jobs
Women 0.436 0.477 0.465
Men 0.445 0.385 0.436
Region
Greater London 0.118 0.174 0.120
South East 0.235 0.152 0.214
South West 0.097 0.103 0.103
West Midlands 0.107 0.112 0.108
North West 0.136 0.143 0.142
© Institute for Fiscal Studies 7(1) (2) (3)
Comparable Our sample, Our sample,
LFS sample unweighted reweighted
North East 0.061 0.071 0.065
Yorkshire and the Humber 0.113 0.096 0.103
East Midlands 0.092 0.077 0.094
East of England 0.041 0.073 0.049
Characteristics not reweighted on
Education
Neither partner university 0.470 0.394 0.467
One partner university 0.265 0.255 0.247
Both partners university 0.265 0.350 0.286
Employment
Neither partner employed 0.028 0.060 0.039
One partner employed 0.235 0.270 0.259
Both partners employed 0.737 0.670 0.702
8 © Institute for Fiscal Studies3. Parents’ paid work under lockdown
We begin by examining some basic descriptives of parents’ paid work by gender during the
lockdown. COVID-19 has brought an unprecedented disruption to working patterns, changing
who is in paid work and where, when and how they are working. Of the parents in our
(reweighted) sample who were doing some paid work during February 2020, only 54% were still
engaging in paid work at the time of the survey. 13% were no longer working for pay due to
having lost their job permanently (through being laid off, being fired or quitting), while another
32% of parents were no longer working for pay due to having been furloughed through the UK
government’s Coronavirus Job Retention Scheme.
So far, there are no conclusive statistics on the rate of furloughing or of job loss and the
statistics that do exist vary widely. Official estimates for the UK suggest that 23% of those who
were working for pay (employed or self-employed) before the crisis had been furloughed by mid
May.9 However, a recent online survey of the labour market suggested a much higher figure of
43%.b In all, the proportion of parents in opposite-gender partnerships who were previously
working that we estimate to have stopped working due to having been furloughed (32%) lies
between official figures and those from recent labour market surveys.
Official information about how many people have lost their job is more scarce.10 Data scarcity,
differences in reference periods and the fact that we look at all those who have stopped working
for pay (due to being laid off, being fired or having quit) whereas the government figures that are
available so far only relate to those claiming benefits due to unemployment (a narrower group)
make it difficult to make comparisons with official figures at this stage. Our estimate of the
proportion of parents no longer working for pay (13% of those who were previously working) is
similar to, but slightly lower than, in a recent labour market survey which estimated a figure of
15% (Adams-Prassl et al. 2020).
Importantly, our estimates of the prevalence of both furlough and stopping work for other
reasons are not directly comparable to either official statistics or recent labour market surveys:
we focus on opposite-gender, dual-parent households with dependent children in England,
rather than all workers in the UK. This could be particularly important since parents are able to
ask to be furloughed because of pandemic-related caring responsibilities, including childcare
while schools are closed. Since our figures apply only to parents with dependent children, they
are less useful as indicators of the health (or lack thereof) of the UK labour market as a whole.
9
1 Official estimates report that 7.5 million (employee) jobs had been furloughed by 12 May
(https://www.gov.uk/government/news/chancellor-extends-furlough-scheme-until-october). This compares with Office
for National Statistics (ONS) estimates, based on the Labour Force Survey, that there were 33.1 million in paid work
in the UK between December 2019 and February 2020 (ONS Dataset EMP01 SA, release date 19 May 2020).
10
A huge increase in the volume of claims made for benefits related to unemployment and financial hardship indicate
the unprecedented scale of the financial challenges facing households. During the first eight weeks after social
distancing was announced (on 16 March), there were 2.6 million individual ‘declarations’ from people applying for
universal credit benefits.c Not all these claims will, however, relate to new job loss. The government estimates that
as of 9 April, three weeks into social distancing, 856,000 more people than one month earlier were claiming benefits
principally for the reason of unemployment;d these numbers are likely to increase substantially as they are updated
to cover a greater period of the lockdown. They are also likely to underestimate the true extent of job losses as not
all job losses will have resulted in new benefit claims: some newly unemployed workers will already have been
claiming universal credit so will not have needed to make a new claim, others will not have met the eligibility criteria,
while still more will have been entitled to claim but will not have actually done so. The difference in reference period
(our data capture those who have stopped working for pay up until mid May, a month later than the official estimates
of new benefit claims for the principal reason of unemployment) makes it difficult to compare our estimates with
these official statistics.
c Department for Work and Pensions, ‘Universal Credit declarations (claims) and advances: management information’,
released 19 May 2020, https://www.gov.uk/government/publications/universal-credit-declarations-claims-and-
advances-management-information#history.
d Office for National Statistics, ‘Employment in the UK: May 2020’, released 19 May 2020,
https://www.ons.gov.uk/employmentandlabourmarket/peopleinwork/employmentandemployeetypes/bulletins/employ
mentintheuk/may2020.
© Institute for Fiscal Studies 9However, they do clearly indicate that parents with dependent children have seen enormous
disruption to their working patterns.
While it is early to say whether our figures on job loss and furlough among parents are precise
estimates of what is happening in the wider economy, in this report we focus on the differences
in employment and time use between fathers and mothers and across families, which are likely
to be less sensitive to potential sampling bias.
Differences by parents’ gender
We find important differences in the rates of job loss and of furloughing between mothers and
fathers. We see in Figure 1 that, among parents who were working in February 2020, mothers
are indeed 9 percentage points more likely to have stopped working for pay than fathers. 16%
of mothers are no longer doing paid work due to having lost their work permanently (whether
they were laid off, were fired or quit), compared with 11% of fathers. Mothers are also
somewhat more likely to not be doing paid work due to having been furloughed through the
Coronavirus Job Retention Scheme (34%, compared with 30% of fathers). These effects
compound the already unequal employment rates of mothers and fathers, which in our data
were respectively 75% and 92% in February 2020 (very close to the 75% and 93% in nationally
representative data for April to June 2019).11 So, while prior to the crisis mothers were in paid
work at 80% of the rate that fathers were, now they are in paid work at only 70% of the rate.
These differences may arise through one of two channels, or a combination of the two. First,
mothers are more likely than fathers to work in the sectors that are taking the biggest hit from
the lockdown (Alon et al. 2020; Joyce and Xu 2020). This aspect is different from in previous
recessions, in which male-dominated sectors suffered the most (Doepke and Tertilt 2016).
Second, the COVID-19 crisis has been distinguished by the sudden, near-total loss of access to
schools and childcare, leaving parents with enormous additional responsibilities for childcare
and education. Since mothers already spent more time on childcare and other unpaid work
(Cattan et al. 2020), and since in many couples the woman is the lower earner, it is possible
that these additional responsibilities are being disproportionately shouldered by mothers.
11
See ONS, ‘Families and the labour market, UK: 2019’,
https://www.ons.gov.uk/employmentandlabourmarket/peopleinwork/employmentandemployeetypes/articles/familiesa
ndthelabourmarketengland/2019. These employment rates are also consistent with findings from other surveys
recently collected for the UK (e.g. (Adams-Prassl et al. 2020; Sevilla and Smith 2020))
10 © Institute for Fiscal StudiesFigure 1. Current engagement in paid work by gender for parents who were in paid work
in February 2020
Mothers
Fathers
0% 20% 40% 60% 80% 100%
Working outside the home Working from home
Not working: furloughed Not working: laid off, fired or quit
If those who have stopped paid work during the crisis find it difficult to return in the short term,
either because low labour demand coupled with high overall levels of unemployment makes it
hard to find a job or because their other commitments remain incompatible with paid work,
these initial inequalities could persist beyond this crisis through the loss of skills and labour
market attachment leading to long-term increases in gender inequalities.
Differences by parents’ education qualifications
The lockdown has also opened up inequalities between education groups, as Figure 2
highlights. Amongst both mothers and fathers, individuals with fewer qualifications are more
likely to have stopped paid work since the start of the crisis. As has been discussed elsewhere
(Costa-Dias et al. 2020), this may well be because more-skilled jobs can be done from home
more easily. For example, over three-quarters of university-educated parents in our data who
are currently working are working from home, compared with well under half of those with
GCSE qualifications or below.
The gender inequalities in who has stopped working are clear within all three education groups:
mothers are always more likely to have stopped working than fathers, independent of their
qualifications. Strikingly, the gender gap is similar at the top and the bottom of the distribution of
education: among degree-educated parents, mothers are 9.2 percentage points more likely to
have stopped work, while the gap is 8.8 percentage points among those educated to GCSE
level or below. The gap for the group with A-level qualifications is around two-thirds as big
again.
© Institute for Fiscal Studies 11Figure 2. Current work status by gender and education for parents who were in paid work
in February 2020
GCSE or below
Mothers
A Levels
Degree
GCSE or below
Fathers
A Levels
Degree
0% 10% 20% 30% 40% 50% 60% 70% 80% 90% 100%
Working outside the home Working from home
Not working: furloughed Not working: laid off, fired or quit
12 © Institute for Fiscal Studies4. Time Use under Lockdown
Changes in employment patterns are not the only way in which the lockdown is impacting how
families spend their time; most children now rely on their parents as their sole childcare and
chief education providers. In this section, we document how mothers and fathers are spending
their time during lockdown and who is shouldering these additional responsibilities.
In our survey, we asked the main respondent what activities they, their partner and one of their
children were doing during each hour of the previous weekday (the survey was paused over
weekends and Bank Holidays). The respondent could include more than one activity in each
hour slot. For parents, the activities we asked about were paid work, housework, leisure,
exercise, personal care, ‘active’ childcare (such as playing with a child or doing educational
activities), ‘passive’ childcare (keeping an eye on a child), caring for others (not children) and
sleep.12 In this analysis, we combine active and passive childcare into one childcare category,
we combine ‘exercise’ and ‘leisure’ to create one exercise category and we drop ‘caring for
others’ due to the rarity with which this activity was selected. For children, in addition to age-
appropriate activities, we asked who was supervising them during each hour and we use this
information to cross-check the hours in which parents were doing passive childcare. This leaves
us with six different categories of activities during waking hours. In this section, we describe
how, on average, all mothers and fathers (regardless of whether they worked prior to the crisis
and whether they are working now) have been spending their time.
How are mothers and fathers spending their weekdays?
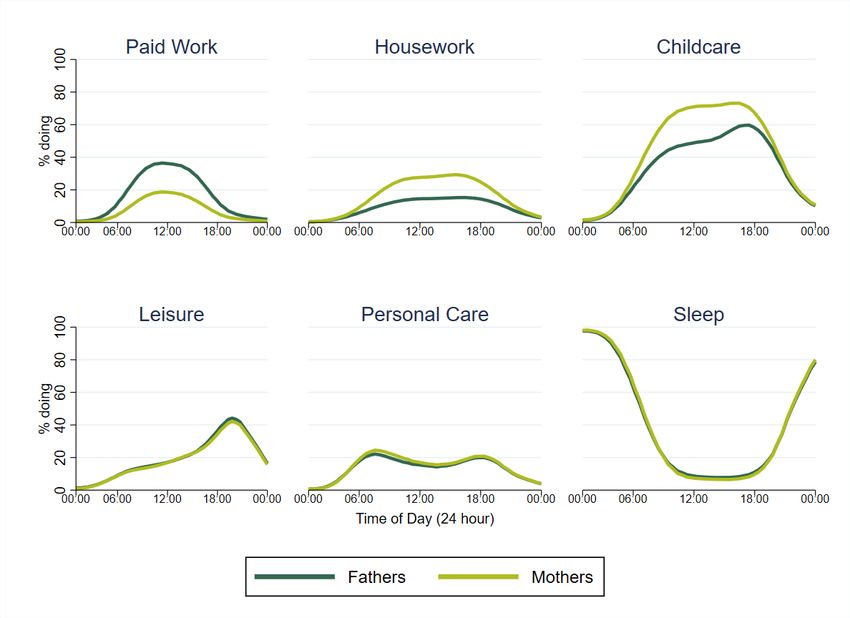
For each hour of the day, Figure 3 shows the share of mothers and fathers taking part in each
of these six categories of activity. In some cases, Figure 3 shows few differences between men
and women: their sleeping patterns, time spent on personal care and leisure time look nearly
identical.
But there are stark differences in time spent on paid work, housework and childcare. At all
points in the day, more men than women are doing paid work. For example, while around a fifth
of mothers report doing paid work between noon and 1pm, nearly two-fifths of fathers say they
are working then. The reverse is true for housework, with more women doing housework during
every hour of the day. In childcare too, the gender difference is striking, particularly during core
working hours; at noon, for example, around 70% of mothers were doing childcare compared
with 50% of fathers.
These differences mean that mothers report spending at least some of their time on housework
and childcare in more hour-long slots during the day than their partners do. Figure 4
summarises these findings, showing the total number of one-hour slots in which mothers and
fathers report doing childcare, housework and paid work.
12
In addition to respondents’ reports of passive childcare done by them and their partner, we also include hours in
which the respondent reported through the child time-use diary that they or their partner was supervising their child.
© Institute for Fiscal Studies 13Figure 3. Mothers’ and fathers’ time use over the course of the day
Figure 4. Total one-hour time slots reported by mothers and fathers
Childcare
Housework
Paid work
0 1 2 3 4 5 6 7 8 9 10 11
One-hour time slots per day
Fathers Mothers
Averaging across those currently doing paid work and those who are not, Figure 4 shows that,
on average, fathers report doing some paid work in four one-hour slots, two more than the
average for mothers. On the other hand, fathers report doing housework in just over two time
slots, compared with nearly four for mothers. There is a similar story for childcare, where
mothers report doing childcare in over ten one-hour slots and fathers do so in eight. Of course,
one reason for these gender differences is that – as Section 2 shows – men are more likely to
14 © Institute for Fiscal Studiesremain in paid work during the crisis and, indeed, are more likely to have been working for pay,
particularly in full-time work, prior to the crisis. We return to this in further detail below.
Gender differences in childcare
The differences in time spent on childcare, shown in Figure 4, are stark: on average, mothers
are engaged in some childcare – whether active or passive – in over 25% more hour-long slots
than fathers. But even for fathers, childcare is the activity that is most frequently reported during
waking hours (see Figure 3).13 This means that parents, especially mothers, are doing some
childcare throughout the great majority of their day.
To put these patterns into context, we now look at how these figures compare with the amount
of childcare that parents were doing prior to the crisis, using data from the UK Time Use Survey
(UKTUS), a nationally representative time-use survey carried out in 2014/15.14
Figure 5 shows that, on an average school day in 2014/15, fathers were engaged in childcare
during 4.2 one-hour slots and mothers during 6.7 slots; the 8.0 and 10.3 one-hour slots in
which, on average, fathers and mothers report doing childcare over the last few weeks are thus
very substantial increases. The increase is particularly large for fathers, who have nearly
doubled the number of slots in which they engage in childcare. Such a sudden and significant
change may have longer-run effects on how parents share childcare going forward, even after
lockdown, and on how employers view male employees’ childcare responsibilities.
Of course, not all childcare requires the same level of effort from the parent; it could be much
easier to combine cooking with keeping an eye on a child while they watch TV than it is to
combine writing work reports with playing Lego. Figure 5 therefore also breaks our measure of
childcare into ‘active’ and ‘passive’ care. It shows that more than half (56% for mothers and
61% for fathers) of the time spent looking after children is taken up with ‘passive childcare’ –
keeping an eye on the children or watching TV together, for example – rather than ‘active
childcare’, such as doing schoolwork or playing together.
13
This is consistent with other recent surveys which also find large differences in the time spent on childcare by
mothers and fathers during the current crisis (e.g. Adams-Prassl et al. 2020; Sevilla and Smith 2020)
14
We run this analysis on a subsample of households with children of similar ages to those in our survey (focusing on
children from age 8, when child time-use diaries are first available, to age 15). We also recode data from the UKTUS
to make them as comparable as possible to ours by recoding the survey’s 10-minute intervals into hour-long intervals
and recoding whether the respondent did any childcare during that hour. Our measure of doing childcare in the
UKTUS is based on cross-checking the reports of when children say they were with parents against their parents’
diaries.
© Institute for Fiscal Studies 15Figure 5. Active versus passive childcare and comparison with pre-lockdown time use
2014/15
Mothers
2020 April
2014/15
Fathers
2020 April
0 1 2 3 4 5 6 7 8 9 10 11
One-hour time slots per day
Active Passive Total
Note: 2014/15 figures use the UK Time Use Survey. This data set contains activity information down to 10-minute slots
of the day. We create a data set from this that indicates whether a parent did any childcare within a given hour, to best
mimic the methodology in our survey.
Quantity versus quality of work time
The amount of paid work that parents can do depends not just on how long they spend working,
but also on how productive they are during that time. Indeed, previous research has shown that
the total amount of working time and the total amount of focused, uninterrupted working time
are both important determinants of workers’ productivity and learning (Blundell et al. 2016;
Coviello et al. 2015; Coviello et al. 2014; Adams-Prassl 2020).
However, for parents working from home, working time – and especially focused working time –
can be hard to come by. Parents, who are now largely responsible for both childcare and
education around the clock, are contending with more demands from their families on their time.
And childcare, particularly for younger children, is often not an activity that can be rigorously
scheduled in focused blocks of time.
In this section, we explore what the lockdown has meant for parents’ working patterns. Since we
asked respondents to list all of the activities they did in each one-hour slot, our data give us a
clear picture of the extent to which parents’ hours of paid work are being shared with – or
interrupted by – other responsibilities. To understand how this crisis is changing the quantity of
working time, we compare current figures with what similar parents used to do before the
lockdown using the UK Time Use Survey.
Figure 6 illustrates how much working patterns have changed for fathers and mothers. The top
panel shows the average number of hour-long slots dedicated to paid work before and during
the crisis, for all mothers and all fathers taken together. Overall, we find that fathers are doing
paid work in fewer than half the number of hours that average fathers used to work before the
crisis. For mothers, the drop is even more staggering; they are currently working in less than
two-fifths of the number of hours that similar mothers reported prior to the lockdown. In all, while
16 © Institute for Fiscal Studiesin 2014/15 mothers who were doing paid work were working 73% of the number of hours of fathers in paid work, now mothers are working only 68% of fathers’ hours. Of course, these figures are partly driven by the large changes in employment status that we reported in Section 2. Panel B in Figure 6 shows how working hours among the subgroup of parents who are working for pay during the lockdown period compared with pre-lockdown figures for working parents. It shows that substantial gender differences persist: while the working hours of fathers dropped by about 16%, those of mothers dropped by 22%. © Institute for Fiscal Studies 17
Figure 6. Working hours before and during the lockdown
Panel A. Average working hours: all parents

                 2014/15
     Mothers

                2020 April

                 2014/15
     Fathers

                2020 April

                             0   1      2         3         4         5         6        7           8             9
                                                 One-hour time slots per day

                                                 Uninterrupted             Interrupted

Panel B. Average working hours: working parents

                  2014/15
      Mothers

                2020 April

                  2014/15
      Fathers

                2020 April

                             0   1       2         3         4         5         6        7           8             9
                                                 One-hour time slots per day

                                                   Uninterrupted           Interrupted

Note: 2014/15 figures use the UK Time Use Survey. This data set contains data down to 10-minute slots of the day. We
create a data set from this that indicates whether a parent did any paid work within a given hour, to best mimic the
methodology in our survey.

18                                                                                             © Institute for Fiscal Studies
Figure 6 also shows the amount of parents’ paid work hours that are multitasking (or are
interrupted), defined as doing at least one work and one non-work activity during the hour-long
slot. We see that, before the crisis, parents typically did non-work activities during a quarter of
the hours in which they were also doing paid work. Such hours most typically occurred at the
start and end of their workdays, as they transitioned to and from work.15 We see that now,
overall, parents who are currently working for pay (Figure 6B) have a higher number of
interrupted hours, both in absolute terms and as a fraction of their total work hours. The nature
of the interruptions is also different; during the lockdown, in roughly 90% of interrupted work
hours the parent is also doing childcare alongside his or her paid work. Working time before the
crisis was mostly spent in the workplace, where interruptions are likely to be less frequent and
less disturbing for the workflow. The increase in interruptions is therefore unsurprising given
many parents’ transition to doing their job from home with children out of school. The reduction
in the proportion of hours that parents work uninterrupted implies that the drop in the amount of
work that parents are able to do may be even more pronounced than suggested by the drop in
working hours. Our data confirm that indeed multitasking is less frequent among those parents
working outside the home, in which case it happens in 18% of work hours, compared with 49%
for those working from home.
Moreover, the extent of multitasking during work time is more prevalent among women than
men. While 70% of fathers’ work hours are spent exclusively doing work, this is the case for
only 53% of mothers’ work hours.16 In other words, mothers are being interrupted during 57%
more of their paid work hours than fathers. This was not the case before the crisis: then,
mothers and fathers were interrupted during the same proportion of their work hours. Combined
with the gaps in hours spent doing paid work, this amounts to the average father who is
currently working for pay having nearly twice as many uninterrupted work hours as the average
mother who is currently working for pay (5.1 hours versus 2.6 hours). This is a bigger gap in
uninterrupted hours than we saw before the crisis (6.6 hours for fathers versus 4.7 hours for
mothers). Combined too with the fact that mothers are more likely to have stopped working for
pay since the lockdown and that they were already less likely to be doing so before the crisis,
mothers overall (including those not working for pay at all) are working just over a third of the
number of uninterrupted hours that fathers are.
Taken together, we find that not only are mothers less likely to work during the lockdown, but
also, even if they are working, they spend fewer hours on paid work and the time they do spend
working is likely to be less productive than fathers’ work time because of interruptions. Lower
productivity during the time mothers spend on paid work – and being paid – could itself impact
their career prospects, making them seem less committed to their jobs or less able to cope with
their workloads than their male colleagues.
15
Commuting to and from paid work is included in our definition of hours spent doing some paid work.
16
These findings are unlikely to be driven by differences in reporting behaviour between men and women (e.g. women
being more likely to tick multiple boxes). Our analysis includes both the main respondent’s and his/her partner’s time
use. Since our main respondents are a mix of men and women, we have some mothers responding about fathers
and some fathers responding about mothers. We did not find systematic differences in gender gaps for reported time
use by gender of the main respondent.
© Institute for Fiscal Studies 195. What drives differences in how
mothers and fathers spend their time?
So far, we have seen that mothers and fathers are spending their time very differently in the
lockdown. While men have significantly increased the time they spend on childcare, it is still
mothers who are taking on the bulk of childcare and housework responsibilities, often at the
same time as they complete other tasks. By contrast, fathers are doing much more paid work
than mothers during the lockdown. These results suggest that the adults in two-parent families
are continuing – or intensifying – the specialisation they had already developed before the
pandemic, with one partner focusing more on paid work while the other takes more
responsibility for unpaid work at home.
Notably, this specialisation has been incentivised by policy during the pandemic: the
Coronavirus Job Retention Scheme means that couples where one parent stops doing paid
work entirely and is furloughed, while the other continues to work their regular hours, are
financially much better off than those where both partners reduce their working hours to
accommodate their new domestic responsibilities. But noting that there are incentives in favour
of specialisation within couples does not answer why, on average, specialisation during the
lockdown seems to split along gender lines, with mothers spending more time on domestic
responsibilities while fathers do more paid work. There could be a number of reasons for this
gendered division of labour, including:
! Employment rates: As we have shown, fathers are more likely to be in paid employment
than mothers. This was already true before the crisis – 75% of mothers were working
between April and June 2019, compared with 93% of fathers17 – but the differences are now
even more pronounced.
! Hourly earnings: On average, fathers earn more than mothers; before the crisis, mothers
whose first child was 5 years old earned more than 15% less per hour than fathers with a first
child the same age, and the gender wage gap continued to grow as the child got older (Costa
Dias et al. 2018). This means that an extra hour that a father spends doing paid work is, on
average, more financially valuable for the household.
! Productivity in domestic work: Similarly, if women are more capable or productive at
housework or childcare – for example, because they did more of it before the crisis and so
are more experienced – the household might benefit more from an extra hour of a mother’s
domestic work than it would from a father’s.
! Preferences: The way in which partners share responsibility for childcare and housework
could also be influenced by partners’ preferences, habits or beliefs about who ‘should’ take
responsibility for these activities.
These are, of course, not the only reasons that could affect how mothers and fathers choose to
divide their tasks; other influences, such as different accommodations from employers, could
also play a role. Disentangling all of the different factors at play, and the extent to which each
could influence how couples divide their responsibilities, is a complicated question and outside
the scope of this paper. But in this section, we explore what our descriptives can suggest about
the extent to which some of these causes appear to be at play in driving the gendered division
of labour during lockdown.
17
ONS, ‘Families and the labour market, UK: 2019’,
https://www.ons.gov.uk/employmentandlabourmarket/peopleinwork/employmentandemployeetypes/articles/familiesa
ndthelabourmarketengland/2019 (accessed 21 May 2020).
20 © Institute for Fiscal StudiesAre gender gaps explained by mothers being less likely to be employed? Even prior to the current crisis, mothers were less likely to be in paid work than fathers. On top of that, in this report we document that the lockdown has caused mothers to stop working for pay at higher rates than fathers. For efficiency and financial reasons, a spouse who is not working for pay may accumulate most of the domestic responsibilities within the family. Therefore, one explanation for the gender gaps we see in childcare and housework is simply that mothers are more likely to be not currently doing paid work. If this explanation were sufficient to explain the gender gaps we see, we would expect that mothers who are currently not doing paid work spend their time in the same ways as fathers who are not doing paid work. Panel A of Figure 7 shows that this is not the case. It graphs the number of one-hour slots in which parents report doing paid work, housework, and childcare (of any type), splitting between those who are currently working for pay and those – including furloughed employees – who are not. Panel B compares those who report they are working from home and those who report working outside of the home. In Figure 7A, we see large gender gaps even between mothers who are working for pay and fathers who are working for pay, and between mothers who are not currently working for pay and fathers who are not currently working for pay. Mothers spend more time than fathers on housework and childcare, regardless of working status. This tells us that the overall gender differences we observe in time spent on domestic activities are not entirely driven by fewer mothers currently doing paid work. Indeed, mothers who are working for pay spend roughly the same amount of time on these activities as do fathers who are not working for pay. Fathers’ time use is particularly sensitive to whether or not they are in paid work: fathers who are not working for pay report spending more than twice as many time slots on housework as those who are, and three more one-hour time slots on childcare. Interestingly, the amount of time that mothers spend on childcare is far less responsive to whether or not they work for pay. Indeed, mothers who are not working for pay do childcare in only one-and-a-half more one-hour time slots than those who are. Altogether this means that mothers who are working for pay have an especially heavy load. While they do 2.3 fewer one-hour time slots in paid work than working fathers, they more than compensate for the difference by putting in an additional 2.7 one-hour time slots of childcare and 1.5 one-hour time slots of housework compared with fathers in paid work. © Institute for Fiscal Studies 21
Figure 7. Time use by current work status
Panel A. By working status
     Not working

                    Childcare

                   Housework

                    Childcare
     Working

                   Housework

                    Paid work

                                0   1   2   3      4       5     6    7       8   9        10          11
                                                One-hour time slots per day

                                                       Fathers   Mothers

Panel B. Among those working, by whether works at home or outside the home

                    Childcare
     Outside

                   Housework

                    Paid work

                    Childcare
     Home

                   Housework

                    Paid work

                                0   1   2   3      4       5     6    7       8   9        10          11
                                                One-hour time slots per day

                                                       Fathers   Mothers

22                                                                                © Institute for Fiscal Studies
The large differences in time use we see between working mothers and fathers could be driven
by the type of paid work different genders are doing, which may or may not be compatible with
more time for domestic responsibilities. In particular, work outside the home is better insulated
from domestic responsibilities during working hours and, after factoring in commuting time, it
may also leave fewer hours available for these activities.18 To shed some light on the extent to
which gender differences in domestic responsibilities among working parents can be explained
by the nature of their jobs, we split time use by whether working parents work from home or
outside of the home. Although both mothers and fathers do more childcare if they are working
from home, Figure 7B shows that there are gender gaps both between mothers and fathers who
work from home (with mothers doing childcare during 2.4 more hours than men) and between
parents working outside the home (where the gap is even larger, at 3.2 one-hour slots).
Are gender gaps explained by mothers having lower earnings?
Before the pandemic, mothers earned less per hour on average than fathers. There is evidence
that they were more willing to sacrifice higher earnings in favour of, for example, more flexible
working or a shorter commute (Joyce and Norris Keiller 2018; Mas and Pallais 2017). This
means that, in strict economic terms, families on average benefit financially more from an extra
hour of paid work done by a man, even if it means his partner has to reduce her paid working
hours to pick up more of the responsibilities at home. We look now at whether the lower
average earnings of mothers relative to fathers can explain the overall gender gaps we see.
If this were the main explanation for the overall gender gaps, we would expect to see that
parents behave symmetrically. That is to say, we would expect that couples usually prioritise the
(paid) work of the higher-earning parent, regardless of whether that parent is the mother or the
father. This would imply that, on average, higher-earning partners do the same amount of
childcare, housework and paid work whether they are male or female, and lower-earning fathers
do the same amount as lower-earning mothers.
Again, this is not what we find. Figure 8 shows how partners who are both currently in paid work
are organising their time depending on who earned more before the crisis. It shows clearly that
couples where the father earned more do not organise their time in the opposite way to which
couples where the mother earned more do. Indeed, it shows that regardless of who was the
higher earner in the couple, the father always does more uninterrupted work (2.8 hours if he
earned more and 0.6 hours if the mother earned more). Likewise, even when the mother earned
more than her partner, she does 1.6 more hours of childcare and about the same amount of
housework.
18
Commuting to and from paid work is included in our definition of hours spent doing some paid work.
© Institute for Fiscal Studies 23You can also read


