Recreational Carrying Capacity Assessment - Grant PUD
←
→
Page content transcription
If your browser does not render page correctly, please read the page content below
Recreational Carrying
Capacity Assessment
Priest Rapids Hydroelectric Project
Prepared for:
Public Utility District No. 2 of Grant County    2016
Ephrata, Washington                              2016

Prepared by:
Jeffrey Hallo, Ph.D. (Principal Investigator),
Geoffrey Riungu, Garret Stone, Jessica Fefer,
Devyani Singh, Sarah Wilcer, Emma Pappas
© 2016, PUBLIC UTILITY DISTRICT NO.
2 OF GRANT COUNTY, WASHINGTON.
ALL RIGHTS RESERVED UNDER U.S.
AND FOREIGN LAW, TREATIES AND
CONVENTIONS. THE ATTACHED
WORK WAS SPECIFICALLY ORDERED
UNDER AN AGREEMENT WITH
PUBLIC UTILITY DISTRICT NO. 2 OF
GRANT COUNTY, WASHINGTON, FOR
USE AS A CONTRIBUTION TO A
COLLECTION OF WORK RELATING TO
THE RELICENSING OF THE PRIEST
RAPIDS HYDROELECTRIC PROJECT,
FERC LICENSE NO. 2114. ALL RIGHTS
IN THE VARIOUS WORK PRODUCED
FOR OR UNDER THIS AGREEMENT,
INCLUDING BUT NOT LIMITED TO
STUDY PLANS AND STUDY RESULTS,
DRAFTS, CHARTS, GRAPHS AND
OTHER FORMS OF PRESENTATION,
SUMMARIES AND FINAL WORK
PRODUCTS, ARE THE EXCLUSIVE
PROPERTY OF THE DISTRICT.
EXECUTIVE SUMMARY

Public Utility District No. 2 of Grant County (Grant PUD) commissioned this recreational
carrying capacity study to assist in reporting recreation usage in the Priest Rapids
Hydroelectric Project (Project) as required by the Federal Energy Regulatory Commission
(FERC), as well as to inform Grant PUD’s future recreation-related management decisions.
This report presents the results of a capacity analysis of recreational resources and related
use of the Project and is intended to assess the overall recreation capacity of the Project in
relationship to its current recreational use level. This report specifically supports
development of the FERC Form 80 requirement to report the capacity utilization of
amenities on the Project, and informs a 2016 update to the Recreation Resource
Management Plan for the Priest Rapids Project.

This analysis is based on the primary types of recreation capacity and the methods for
measuring that capacity as recognized in the scientific literature (Manning, 2007). Findings
from a separate Recreation Site and Facility Inventory (Grant PUD, 2015) suggest that
environmental and managerial conditions are not limiting factors for the recreational
carrying capacity of the Project. Experiential considerations (including boat launch parking
and campsite availability) are therefore the focus of the recreational carrying capacity
assessment presented in this report.

Survey data collected during the peak recreation use season in 2015 serve as the primary
basis for most capacity analyses presented. These data were collected using rigorous,
science-based procedures that reflect the most widely applied approach to assessing
recreational carrying capacity – an indicators and standards-based approach integrating
norms. At certain amenities, such as dispersed/lower use sites, or privately operated sites, the
institutional knowledge of Grant PUD staff was relied upon as the most accurate and
practical way to determine recreational carrying capacity

The analyses presented in this report generally show that peak season recreation use at the
Project is well below its potential capacity. Recreation capacity utilization at the various
FERC-defined amenity types is between 5% and 66%. However, some specific amenities
had higher capacity utilizations. In particular, the boat launch areas at Vantage and Crescent
Bar (Off-Island) were utilized at 75.2% and 76.3 % of their capacity, respectively, and the
campgrounds at Ginkgo Petrified Forest State Park and Crescent Bar (Off-Island) were
utilized at 86.2% and 78.6% of their capacity, respectively. The Priest Rapids and
Wanapum Reservoirs, while not an amenity themselves, are below their recreational
carrying capacity for boating. The reservoirs are utilized for boating, on average, at 42.2 %
and 70.4% of their capacity during the peak use season.

Based on the results from the capacity analyses, further near-term monitoring of recreation
capacity seems unwarranted. The analysis does not indicate a near-term need to continue to
add or modify recreational amenities on the Project to increase capacity. However, it should
be noted that user responses in surveys conducted for a related recreation use assessment
indicated some potential site or service improvements that would enhance visitor
experiences, but these are not capacity-related. While specific issues and challenges related
to capacity may emerge if use levels or types change, the capacity of the Project’s amenities
will not likely be exceeded prior to the next FERC Form 80 reporting in 2021. This report
recommends continuing routine monitoring of recreation-related environmental impacts at
dispersed sites, and seeking informal public input on recreation experiences and
management at developed facilities to identify any emerging or site-specific capacity-related
issues.
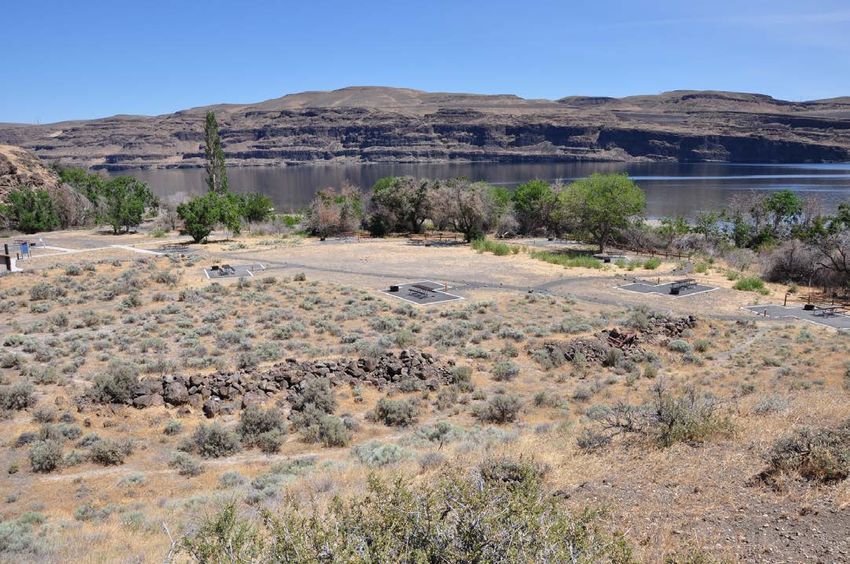
TABLE OF CONTENTS

                                                                                                                                     Page

EXECUTIVE SUMMARY .......................................................................................................i
LIST OF TABLES ..................................................................................................................iv
LIST OF FIGURES .................................................................................................................. v

A.   INTRODUCTION.............................................................................................................. 1
B.   STUDY GOALS ................................................................................................................ 1
C.   STUDY AREA................................................................................................................... 2
D.   RECREATIONAL CARRYING CAPACITY REVIEWED ............................................ 6
     The Concept ....................................................................................................................... 6
     Frameworks and Approaches ............................................................................................. 7

E. METHODS......................................................................................................................... 9

F. RESULTS......................................................................................................................... 10
   Boat Launch Areas ........................................................................................................... 10
   Access Areas .................................................................................................................... 12
   Informal Use Areas........................................................................................................... 13
   Hunting Areas................................................................................................................... 13
   Overlook Vistas ................................................................................................................ 14
   Picnic Areas ...................................................................................................................... 14
   Reservoir Fishing Platform ............................................................................................... 15
   Tailwater Fishing Access.................................................................................................. 15
   Trails................................................................................................................................. 15
   Active Recreation Areas ................................................................................................... 16
   Campgrounds and Campsites ........................................................................................... 17
   Dispersed Camping Areas ................................................................................................ 18
   Marinas ............................................................................................................................. 18
   Visitor Centers .................................................................................................................. 19
   Swimming Areas .............................................................................................................. 19
   Other Project Amenities ................................................................................................... 20
   Recreation Capacity of the Reservoirs.............................................................................. 20

G. CONCLUSIONS AND RECOMMENDATIONS ............................................................ 28

H. REFERENCES ................................................................................................................. 31

Appendix A - 2015 Recreation User Survey .......................................................................... 33
Appendix B - Site-Specific Study Photos Referenced in the Survey...................................... 41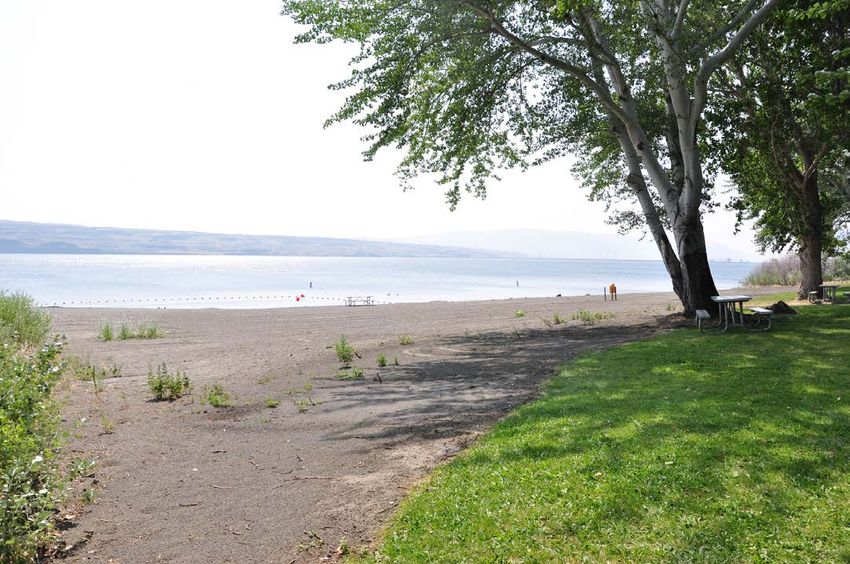
LIST OF TABLES

Table #                                                                                                                         Page

F.1 Response to the question “Did you have to wait to use a boat launch today?” ............... 10
F.2 Response to the question “If you waited, how long did you wait to use a boat
           launch today?” ...................................................................................................... 10
F.3 Response to the question “How long of a wait to launch your boat is
           acceptable to you?” ............................................................................................. 11
F.4 Percentage of boat launch parking occupied on weekends ........................................... 12
F.5 Capacity assessment for overlook vistas ....................................................................... 14
F.6 Capacity assessment for picnic areas ............................................................................ 14
F.7 Capacity assessment for trail areas................................................................................ 16
F.8 Capacity assessment for active recreation areas ........................................................... 16
F.9 Capacity assessment for campgrounds and campsites .................................................. 17
F.10 Capacity assessment for dispersed camping areas ........................................................ 18
F.11 Capacity assessment for marinas................................................................................... 19
F.12 Capacity assessment for swimming areas ..................................................................... 19
F.13 Existing standards for boating capacities on reservoirs ................................................ 20
F.14 Norm curve data for Priest Rapids Reservoir................................................................ 25
F.15 Norm curve data for Wanapum Reservoir .................................................................... 26
F.16 Highest number of boats to be allowed on the reservoir segment ................................ 26
F.17 Agreement that none of the photos show a high enough number of boats
           to restrict use ........................................................................................................ 27
F.18 Number of boats typically seen on the reservoir ........................................................... 27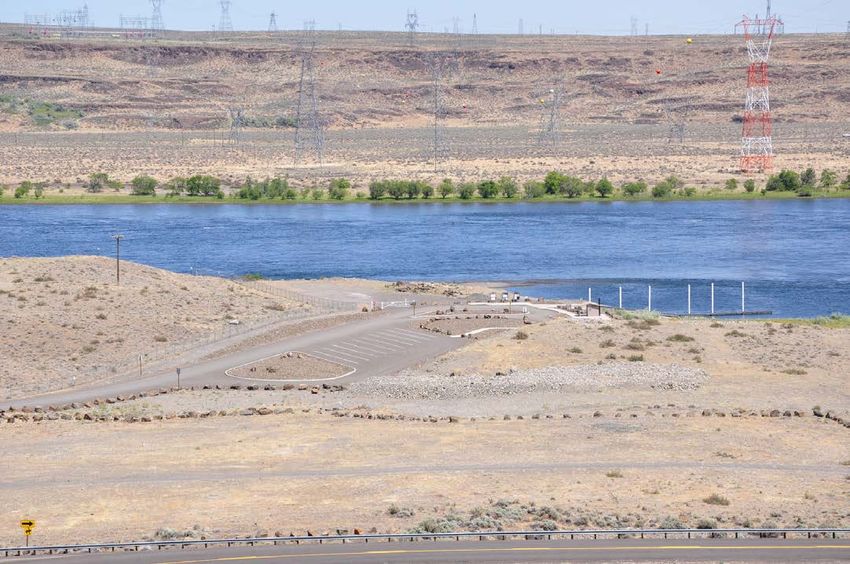
LIST OF FIGURES

Figure #                                                                                                                         Page

C.1 Project map showing the recreation areas on Priest Rapids and Wanapum
      Reservoirs ..................................................................................................................... 3
C.2 Aerial photo of The Gorge Amphitheater taken on a Labor Day concert weekend
      in 2011 ......................................................................................................................... 5

F.1 Study Photos of Boat Density ......................................................................................... 22
F.2 Social norm curve for the acceptability of number of boats without feeling
       too crowded and unsafe at Priest Rapids Reservoir ................................................... 25
F.3 Social norm curve for the acceptability of number of boats without feeling
       too crowded and unsafe at Wanapum Reservoir ........................................................ 26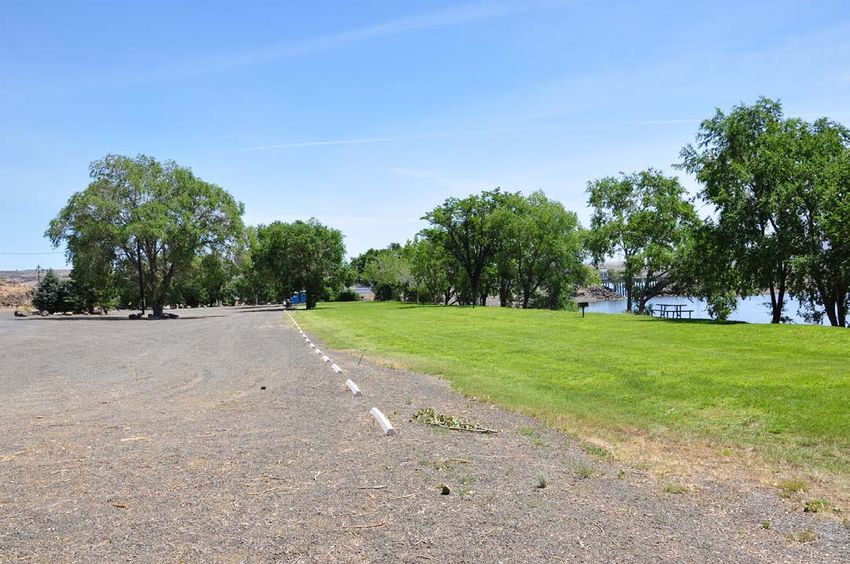
This page intentionally left blank
A. INTRODUCTION

Public Utility District No. 2 of Grant County (Grant PUD) commissioned this study per
Article 418 of its license requirements, as amended in September 2012, from the Federal
Energy Regulatory Commission (FERC) for the Priest Rapids Hydroelectric Project
(Project) (FERC Project No. 2114). A series of inter-related studies were conducted to
assess and evaluate recreation resources and recreation use associated with the Project. This
report presents the results of a capacity analysis of recreational resources and related use of
the Priest Rapids Project. The intent of the study is to assess the overall recreation capacity
of the Project in relationship to its current recreational use level. This analysis is based on
the primary types of recreation capacity and the methods for measuring that capacity as
recognized in the scientific literature (Manning, 2007).

Grant PUD received a new license in 2008 for continued operation of the Priest Rapids
Hydroelectric Project, located on the mid-Columbia River in central Washington State. As a
part of their relicensing agreement, Grant PUD was required to implement a number of
substantial capital improvements to enhance recreation access and quality (see the 2015
Recreation Site and Facility Inventory conducted by Grant PUD for details). Most of the
capital improvements were completed between 2011 and 2015. Use levels at these sites may
have changed substantially from the past and may change substantially in the future.
Likewise, many of the capital improvements were implemented to enhance recreation
facilities at the Project. All of these changes directly influence the recreation capacity of the
Project and its individual recreation sites.

As part of its FERC license, Grant PUD is required to revise and file an update to the Priest
Rapids Recreation Resource Management Plan (RRMP) in 2016. This report is one of several
empirical sources of data to inform the revised RRMP. The approach applied in developing
the current report has been updated from the 2000 Recreation Capacity Analysis (EDAW,
1999) to reflect substantial changes in methods for assessing recreation capacity.
Specifically, it applies an indicator and standard-based approach that is at the heart of
contemporary and well-accepted carrying capacity frameworks. Finally, the results provide a
means to meet the capacity reporting requirements associated with FERC Form 80, due in
spring 2016.

B. STUDY GOALS

Several goals have been identified for this study, all of which focus on recreation use and
capacity at facilities and sites in the study area:

   •   Assess the recreational carrying capacity of the study area for each of the amenity
       types defined by FERC and for boating on the Priest Rapids and Wanapum
       Reservoirs.

   •   Assess the overall recreational capacity of FERC-defined amenities by considering
       three different capacity dimensions – resources, facilities/management, and
       experiences – using empirical data collected in a rigorous, science-based manner.

                                                1
•   Identify which of the three capacity dimensions is the limiting factor for overall
       recreation carrying capacity.

   •   Summarize this analysis by determining to what degree the identifying recreation
       amenities and reservoirs have reached their overall recreational carrying capacity.

C. STUDY AREA

The Project is located on the mid-Columbia River in central Washington and includes
Wanapum and Priest Rapids Reservoirs (see Figure C.1). The lower-most portion of the
Project is the free-flowing Hanford Reach of the Columbia River. The study area includes
all waters and adjacent lands within the FERC Project boundary. It includes all sites
commonly utilized for public recreation, both developed and undeveloped. Two privately
operated recreation areas – Crescent Bar Resort and Riverstone Resort – are included in the
study area. The Project boundary includes 58 miles of the Columbia River from River Mile
395, approximately 2 miles downstream of the Priest Rapids Dam, upstream to a point
approximately 0.5 mile downstream of Chelan County PUD’s Rock Island Dam at River
Mile 453 (see Figure C.1).

                                              2
Figure C.1 Project map showing the recreation areas on Priest Rapids and Wanapum
Reservoirs
3The Wanapum development is characterized by a mix of features, which includes publicly
accessible lands, steep topography, highway access, private ownership and other restricted
access, agricultural activity, and park development. Wanapum Reservoir is approximately
38 miles long and runs through spectacular canyons with magnificent basalt cliffs and
alluvial sand deposits. The reservoir is over 1 mile wide in some locations. Vantage is the
largest town (unincorporated area) on the reservoir with a population of about 177 people.
There are two residential/resort communities (much larger than Vantage) on the reservoir:
Crescent Bar Resort and Sunland Estates.
Much of the undeveloped western shore of the reservoir, and portions of the eastern
shoreline, are wildlife and waterfowl habitat lands managed by the Washington Department
of Fish and Wildlife (WDFW). A vast majority of recreational access to and use of the
reservoir is concentrated in the Interstate 90 (I-90) corridor/Vantage area and at Crescent
Bar Resort and Sunland Estates. Recreation providers include Grant PUD, Washington State
Parks and Recreation Commission, WDFW, Kittitas County, and private commercial
interests such as the Riverstone Resort.
The downstream Priest Rapids development is characteristically different from the
Wanapum development because of the shorter length of the reservoir (approximately 18
miles), lack of wide basins and sandy beaches open to public recreation use. It does not
receive the same high volumes of recreational use as Wanapum Reservoir due largely to
being farther away from concerts at The Gorge Amphitheater and I-90. A few miles below
Wanapum Dam, the river passes through Sentinel Gap, a geologic landmark. Downstream of
Sentinel Gap, the river valley opens up into wide slopes where private ownership and
agricultural activity dominate the eastern shore. Highway 243 closely parallels the eastern
shoreline in this area. Much of the western shoreline is part of the Yakima Training Center
Military Reservation, which has highly restricted public access.
Public recreational access to Project lands and waters is widely available and dispersed.
Since its construction in the late 1950s and early 1960s, the Project has provided the region
with a variety of developed and dispersed recreation opportunities, including fishing, flat-
water boating, camping, sightseeing, swimming, picnicking, waterskiing, personal
watercraft (PWC) use, and other recreational activities. The sites and facilities at the Project
have become an important centerpiece of the outdoor recreation opportunities in the central
Washington region, attracting a substantial number of users. Like many other recreation
facilities in the Pacific Northwest, recreation use is typically high during the summer peak
season (Memorial Day to Labor Day) and is much lower during the remainder of the year.
There are small, short-term increases in off-season recreational use associated with accessing
Project lands and waters during various salmon runs and waterfowl hunting. As with most
recreation sites, use is typically highest on weekends, and peaks on weekends associated
with Memorial Day, Labor Day, and the July 4th Independence Day holiday, as well as
scheduled concerts at The Gorge Amphitheater.
Much has changed with recreation to the Project since the last use carrying capacity analysis
was conducted in 2000 (EDAW, 1999). As mentioned in the introduction, substantial capital
improvements, including the addition of new recreation sites and facilities, have occurred on
the Project within recent years. Demand for recreation resources and activities in the region
4has grown and changed significantly over the years. Likewise, recreation activities (both
societally and regionally) have evolved or changed in substantial ways. New forms of
recreation, such as geocaching, wakeboarding, wake surfing, and stand-up paddle boarding,
have even emerged in the last decade.
Outside the study area is The Gorge Amphitheater located on a high bluff above Wanapum
Reservoir northwest of George, Washington. The Gorge Amphitheater draws large crowds
(up to 40,000 visitors) from the Central Puget Sound area and elsewhere in the Pacific
Northwest. Nine concerts, over 17 days, were held in 2015. Extended weekend use in the
study area related to these concerts was documented in the 1996 and 1999 surveys and was
found to be substantial (DE&S, 1997; EDAW, 2000). Since 1999, the Gorge Amphitheater
has increased on site primitive camping opportunities (see Figure C.2).
Figure C.2 Aerial photo of The Gorge Amphitheater taken on a Labor Day Concert
weekend in 2011. The circle in the upper right is ½ mile diameter camping
area.
5The study area includes a total of 130 recreation amenities located at 49 recreation sites.
Most amenities (77) are on Wanapum Reservoir, while 53 are on Priest Rapids Reservoir.
These sites and their associated amenities are detailed in a 2015 Recreation Site and Facility
Inventory (Grant PUD, 2015). To understand the overall recreation capacity of FERC-
defined amenities and the Project, empirical data were collected in 2015, where applicable
and feasible, at all FERC-defined amenities and for boating on each reservoir. At amenities
where recreation use is low and dispersed (i.e., hunting areas, informal use areas, and access
points), privately managed, or was otherwise deemed inappropriate for conducting a survey,
the institutional knowledge of Grant PUD staff was relied upon to assess recreational
capacity.
D. RECREATIONAL CARRYING CAPACITY REVIEWED
The Concept
The concept of carrying capacity in recreation areas has received much attention in the
scientific literature (for details see Manning, 2007). As applied to recreation areas, carrying
capacity may be generally defined as “the amount and type of use that can be accommodated
in a particular area while sustaining desired biophysical resources and opportunities for
quality visitor experiences” (Lime, Anderson, & Thompson, 2004). The current model of
carrying capacity is comprised of managerial, environmental, and experiential dimensions
(Manning, 2007). These three dimensions are themselves types of carrying capacities for an
area. The overall recreational carrying capacity for a site or area is determined by identifying
the most limiting of these dimensions.
The managerial dimension is often concerned with the use of facilities as compared to the
level of use a recreation provider plans for and is capable of accommodating. For this
reason, it is sometimes termed a ‘facility capacity.’ It includes considerations of the designed
specifications of each site, safety, available staffing, maintenance needs/requirements, and
other management concerns. Managerial capacity is often assessed by engineers and staff
working for the organization providing the recreation opportunities or access. However, for
most recreation sites, times or places typically exist when more people could use the site or
its facilities, so other dimensions of recreation carrying capacity (i.e., resource or
experiential) become the limiting factor and the focus of attention for capacity
determinations.
The environmental (i.e., resource) dimension is primarily concerned with recreational use
and its potential impacts to ecosystem components such as wildlife, waters, vegetation, and
soils (Hammitt & Cole, 1998). However, historic and cultural resources such as
archeological sites and scenic views might be included as a resource. Expert opinion and
assessments are often used for developing resource-related standards. In the case of resource
impacts, experts provide the most valid judgment about what types and amounts of impacts
are of concern, and when a recreational carrying capacity has been reached.
6The experiential dimension is concerned with providing recreational opportunities that are of
high quality and that are appropriate for a site. Most research and work on the carrying
capacity of parks and other recreation sites has focused on this dimension (Manning, 2007).
A benefit of this is that visitor experiences inherently include some related consideration of
resource and management conditions.
The Recreation Site and Facility Inventory (Grant PUD, 2015) serves as the basis for
assessing the managerial and environmental dimensions of recreational carrying capacity.
This inventory found no serious or frequent issues suggesting resource conditions are being
substantially impacted by recreation. Also, the condition of facilities was generally found to
be either like-new or in need of routine maintenance. Five exceptions to this were found
where renovations were needed to facilities; three of these are currently in some stage of
being addressed. Overall, the findings from this inventory suggest that environmental and
managerial conditions are not limiting factors for the recreational carrying capacity of the
Project. Experiential considerations are therefore the focus of the recreational carrying
capacity assessment in the remainder of this report.
Frameworks and Approaches
Several contemporary planning and management frameworks aid in establishing carrying
capacities for recreation areas. These frameworks include Visitor Experience and Resource
Protection (VERP) (NPS, 1997) and Limits of Acceptable Change (LAC) (Stankey et al.,
1985). VERP was developed to address the need of national parks for “identification of and
implementation commitments for visitor carrying capacities for all areas of the unit” as
mandated by the National Parks and Recreation Act of 1978 (P.L. 95-625). As the name
suggests, this planning framework is aimed at maintaining the quality of the visitor
experience and protecting natural and cultural resources in the face of increasing visitor use.
Similarly, LAC was developed for use by the U.S. Forest Service to help set recreation
carrying capacities and address growing recreation impacts in a documented, logical manner
(Stankey et al., 1985). Both of these frameworks have, since their inception, been widely
applied, tested, and accepted as a best practice for establishing recreation carrying capacities.
Furthermore, by following these frameworks the decisions that recreation site managers
make regarding carrying capacity are documented, empirically derived, publicly informed,
science-based, thoughtful, deliberate, and defensible.
These frameworks share the same basic approach for determining recreational carrying
capacity. They begin by directing managers to set objectives for desired resource and
experiential conditions. These objectives then must be expressed quantitatively in the form
of indicators and standards. Indicators are measurable, manageable variables that act as
representations of desired conditions. Standards define the minimum acceptable condition of
indicator variables. Next, the frameworks require that indicator variables be monitored. If
monitoring suggests that standards are in danger of being violated, then a carrying capacity
has been reached. According to these frameworks, a recreation carrying capacity has been
reached when the condition of an indicator violates the standard set for that indicator.
7Finally, if a carrying capacity has been reached then management action is required to
ensure existing conditions are changed so that they do not violate standards. Management
actions are context-specific but generally can include use limits, spatial or temporal
redistribution of use, protection of the site from further impacts (e.g., site hardening),
educating visitors in an attempt to reduce impacts, direct mitigation (e.g., picking up litter
and replanting areas with impacted vegetation), or increasing the supply of recreation
opportunities by building or redeveloping facilities.
To be most effective, indicators should meet several criteria. Two primary criteria are noted
in the above definition of indicators: measurable and manageable. Indicators must be
measurable to objectively determine their condition. Moreover, if indicators are outside the
scope of managers’ control then there may be little reason to focus on them in the context of
management planning. Also, indicators should be significant to either recreation user and/or
managers. Additional criteria for good indicators include being objective, specific, reliable,
repeatable, related to visitor use, sensitive, efficient to measure, and integrative. All of these
characteristics must be considered in combination with the context of application –
specifically policy, political, resource, and managerial constraints – when choosing
indicators. Ultimately, the weighing of these additional characteristics for the selection of a
final list of indicators requires the informed judgment of recreation site managers.
Standards are a quantitative limit that may be used to determine what conditions are
acceptable or unacceptable. Standards may be set by policy, law, facility design for safety
and risk management, expert opinion, or normative research. Experiential carrying capacity
assessments and the standards used for them have most often been based on normative
theory and related empirical methods (Shelby & Heberlein, 1986; Vaske & Whittaker,
2004). Normative theory suggests that visitors may have shared beliefs about important
aspects of their experiences, and standards for what constitutes acceptable or unacceptable
conditions. These shared beliefs may be termed norms. Norms are typically identified by
asking visitors to rate or identify acceptable conditions for a particular aspect of their
experience. Photographs are often used to help visitors in their assessment of these
conditions. The resulting norm may be used as a sound basis for experiential standards and
carrying capacity assessments. Most research on experiential carrying capacity has focused
on and supports the use of crowding-related aspects of a site visit – such as people at one
time (PAOT) or the number of boats within view at one time.
In considering recreation capacity, it is important to note that capacity evaluations typically
consider the peak use season. Recreation sites are often designed to accommodate use levels
representative of typical peak use season and during the general times when visitors want to
use these sites. Experiential standards and capacities are therefore based on a site’s ability to
accommodate this typical peak use demand. However, capacity determinations and
recreation management (specifically facility development) should not be based solely on
accommodating just a few of the highest use days of the year. For example, it is often not
practical or possible to design and operate recreation sites for the extreme peaking of use
during holidays. This is acknowledged by FERC on Form 80, in defining peak weekends
(i.e., holidays) as times when capacity may typically be exceeded.
8E. METHODS
This report assesses the experiential dimension of recreation capacity for the sites/amenities
and each reservoir at the Project. ‘People at one time at recreation sites,’ ‘number of boats at
one time,’ and ‘waiting times to launch a boat,’ serve as the indicators of focus for most
amenities and for the reservoirs. Standards are derived based on the normative approach,
which is described further below. Data used to analyze and assess the recreational carrying
capacity at the Project were collected in a 2015 visitor survey. Survey data were collected
based on recreation sites, since it was deemed impractical to survey users of individual
amenities. These site-level data are then used as a basis for amenity-level capacity
assessments presented later in this report. The methods for conducting this survey and the
results of it are fully reported in the Recreation Use Assessment Report (Hallo et al., 2016).
Appendix A shows the survey itself, and Appendix B shows all of the site-level photos
referenced for use in the survey.
Following a normative approach to experiential standards, several questions were asked in
the aforementioned survey about the use conditions that visitors found acceptable and the
use conditions they typically saw while recreating. Specifically, these survey questions
pertained to the number of boats seen on the reservoir (if they boated), the waiting time to
launch a boat (if they boated), and the number of people encountered at the recreation site
they were using when sampled. Photos of a boating area (presented in report Section F) and
the recreation site (Appendix B) were presented with survey questions to help provide a
basis for and more validity to respondents’ answers. Responses to the questions regarding
acceptable conditions represent an experiential standard based on social norms. Because
they represent empirical findings, these standards are presented in the results section of this
report. By comparing the use conditions reported as typically seen to these standards, the
experiential carrying capacity was assessed.
As mentioned, experiential carrying capacities are often based on perceptions of crowding,
so determining capacities at low-use dispersed areas (i.e., access points, hunting areas, and
informal use areas) is problematic. Likewise, capacity assessments should be based on
empirical data, but in some places, either practicality or ownership may preclude collection
of such data. For example, it was impractical to collect use data associated with hunting in
this report because it occurs at a distinctly different time of year than other recreation
activities. Also, the collection of use data at marinas, campgrounds, and the Crescent Bar
golf course was not feasible because of the private ownership and/or operation of these
facilities. In some cases, secondary data from the recreation provider was available for use,
but this was often incomplete or difficult to interpret. In cases where collection of use data
was not feasible or possible, an expert-based assessment represents the best available
approach for capacity determinations. Grant PUD staff’s institutional knowledge is used to
estimate the capacity of these amenities.
A recreational capacity assessment was conducted for all amenities on the Project and for
boating on both the Priest Rapids and Wanapum Reservoirs. The list of amenities where
capacity was considered is provided in the Recreation Site and Facility Inventory report
(Grant PUD, 2015). The results reported in the following section used the best available
data and science-based techniques.
9F. RESULTS
Results of the carrying capacity analysis are presented for each amenity type on the Project,
which is the unit of reporting for FERC Form 80. How the capacity was assessed at each
amenity type and the basis of each assessment are also detailed. Where possible, these
results are based on the 2015 visitor surveys described in the preceding section and detailed
in the Recreation Use Assessment Report (Hallo et al., 2016), and any exceptions are noted
and explained. All capacities refer to peak season use times of June through mid-September.
Boat Launch Areas
Seventeen boat launches are located on the Project. Waiting times (in minutes) to launch a
boat and percentage of parking occupied on weekends were considered the two primary
indicators for the carrying capacity of these amenities. For waiting times to launch a boat,
survey respondents were asked several questions related to this indicator. Data were
collected and analyzed at the reservoir and Project level for boat launches. The results
associated with questions related to boat launch waiting times are shown in Tables F.1
through F.3.
Table F.1 Response to the question “Did you have to wait to use a
boat launch today?”
Yes No N
Priest Rapids
3.2% 96.8% 31
Reservoir
Wanapum Reservoir 17.6% 82.4% 216
Entire Project 15.8% 84.2% 247
Table F.2 Responses to the question “If you waited, how long did you wait to use a boat
launch today?”
Wait Time (in minutes)
1 5 10 15 16 20 Mean SD Min Max N
Priest Rapids
- - 50.0% 50.0% - - 12.5 3.5 10 15 2
Reservoir
Wanapum
2.6% 36.8% 47.4% 2.6% 2.6% 7.9% 6.8 5.5 0 20 38
Reservoir
Entire Project 2.5% 35.0% 47.5% 5.0% 2.5% 7.5% 6.7 7.8 1 20 40
Note: Mean waiting times for all people who reported launching a boat was 1.4 minutes. This accounts for the
large percentage of people who reported not having to wait to launch a boat.
10Table F.3 Responses to the question “How long of a wait to launch your boat is acceptable
to you?”
Acceptable waiting times (in minutes)
0 1-5 6-10 11-15 16-20 21-25 >25 Mean SD Min Max N
Priest
Rapids 22.2% 33.3% 11.1% 27.8% - - 5.6% 9.3 10.7 0 45 18
Reservoir
Wanapum
12.4% 20.7% 33.7% 20.1% 7.1% 0.6% 5.3% 11.4 12.5 0 120 169
Reservoir
Entire
13.4% 21.9% 31.6% 20.9% 6.4% .5% 5.3% 11.2 12.3 0 120 187
Project
Responses to the visitor survey showed that, on average, visitors felt waiting 11.2 minutes to
launch a boat was acceptable. This value represents an experiential standard for boat launch
use. Boat launch users reported having to wait 1.4 minutes, on average, to launch their boat.
By comparing the conditions reported to this standard, it can be suggested that boat launch
amenities on the Project are, on average, utilized at 12.5% of their capacity based on
wait times to launch a boat.
The percentage of parking occupied on weekends at boat launches was the second indicator
considered. Field cameras were used to collect photo-based data on the number of vehicles
and boat trailers in boat launch parking areas (Hallo et al., 2016). These data were then
compared to the number of available parking spots in that area to determine, on average,
what percentage of parking spots were occupied at boat launches (Table F.4). It should be
noted that only 15 of the boat launch areas are considered. This is because no parking is
associated with The Cove boat/hand launch or the Crescent Bar On-Island boat launch
(Grant PUD, 2015).
It was necessary to make two adjustments to improve the accuracy of parking capacity
utilization estimates based on vehicle/trailer photo-based count data. First, an adjustment
was needed to account for the number of vehicles and trailers that generally occupy one
parking spot; a parking spot could be occupied by a vehicle, a trailer, or in many cases both
a vehicle and a trailer. This was done by taking a subsample of photos and examining them
in detail to determine an adjustment factor to apply to the counts from the field cameras.
This adjustment value was site specific, but it ranged from 1.09 at Frenchman Coulee to
1.92 at Priest Rapids Recreation Area (PRRA). These values suggest that most parking
spots at Frenchman Coulee are occupied by a single vehicle or trailer, while at PRRA most
parking spots are occupied by a vehicle and a trailer.
Second, an adjustment to the total number of parking spots at a few boat launches was
needed. At a few sites the field cameras could not capture the entire boat launch parking
area (e.g., Wanapum Recreation Area Boat Launch), or counts of vehicles and trailers could
be not accurately conducted on the field camera photos because some of the parking areas
were so distant (e.g., Crescent Bar Off-Island Boat Launch). At these sites the number of
11parking spots available was adjusted to correspond to the field camera viewshed. At all
other boat launch areas the total number of parking spots listed in the Recreation Site and
Facility Inventory report (Grant PUD, 2015), or otherwise provided by Grant PUD staff,
was used.
Table F.4 Percentage of boat launch parking occupied on weekends
Average non-Peak Weekend
Parking Capacity Utilization
Buckshot Boat Launch 1.0%
Crescent Bar Off-Island Boat Launch 76.3%
Frenchman Coulee Boat Launch 66.5%
Huntzinger Boat Launch 12.7%
Priest Rapids Recreation Area
23.2%
– consisting of four boat launches
Sunland Boat Launch 37.8%
Vantage Boat Launch 75.2%
Wanapum Lower Boat Launch 5.1%
Wanapum Recreation Area Boat Launch
27.3%
(Ginkgo Petrified Forest State Park)
Wanapum Upper Boat Launch 24.7%
Yo Yo Rock Boat Launch 16.2%
Total Average 33.3%
Based on the results in Table F.4, it can be suggested that boat launch amenities on the
Project are, on average, utilized at 33.3% of their capacity based on the percentage of
parking occupied on weekends. Since this capacity utilization is higher than the one
reported for waiting times above, it is likely the limiting factor in recreational use and
capacity determinations. It is therefore recommended that capacity based on parking
occupancy be used in FERC Form 80 reporting.
Access Areas
Twelve access areas are located on the Project. These are very low-use-level sites and are
characterized by dispersed spatial and temporal use patterns. Data on use levels at these
sites were collected and reported in the Recreation Use Assessment Report (Hallo et al.,
2016). However, it was not practical or possible to collect survey data for these access areas
because of their low use levels. Instead, capacity estimates are most accurately determined
based on Grant PUD institutional knowledge. Based on this knowledge, the aforementioned
use level data, and the general sensitivity of these areas from both environmental and
cultural perspectives, these informal use areas are utilized, on average, at 50% of their
capacity.
12Informal Use Areas
Nine informal use areas are located on the Project. Eight of these are very low-use-level
sites and are characterized by dispersed spatial and temporal use patterns. Data on use
levels at these sites were collected and reported in the Recreation Use Assessment Report
(Hallo et al., 2016). However, it was not practical or possible to collect survey data for
these informal use areas because of their low use levels. Instead, capacity estimates are
most accurately determined based on Grant PUD institutional knowledge. Based on this
knowledge and the aforementioned use level data these informal use areas are utilized, on
average, at 50% of their capacity. This capacity utilization reflects the institutional
knowledge and judgment that these informal use areas are both environmentally and
culturally sensitive to impacts from recreation, even at the current low levels of use.
At the Quilomene Dune and Bay informal use area, the amount of use is much higher and
this area is much more resistant to recreational impacts. This suggests that the visitor
experience at this site should be the predominate focus of carrying capacity. Therefore, a
survey was administered there to measure both a standard for people at one time at this site
and the use current conditions. Survey results there showed that, on average, visitors felt
that 637.0 people at one time was acceptable, yet they typically experienced 266.9 people at
one time at the site. This suggest that use at Quilomene Dune and Bay is at 41.9% of its
capacity.
The site-level capacity utilizations indicate that informal use areas on the Project are
currently utilized, on average, at 49.1% of their capacity.
Hunting Areas
Ten hunting areas are located on the Project. All of these are characterized by very low use
levels and dispersed spatial and temporal use patterns. Also, use occurs at a distinctly
different time of year (e.g., the fall season) than most other recreation. Because of this, it
was not practical or possible to collect data for these hunting areas. Instead, capacity
estimates are best (i.e., most accurately) determined based on Grant PUD institutional
knowledge. In applying this, Grant PUD staff considered that hunters, including the
waterfowl hunters who are frequent of these areas, typically desire a relatively greater
amount of space than other recreation user types. This space is needed from both
experience (i.e., seeing/harvesting game) and safety perspectives. Also, the satisfaction of
hunters was thought to likely decline if use were to increase three-fold from current levels.
Based on this, hunting areas are utilized, on average, at 33% of their capacity.
13Overlook Vistas
Four overlook vistas are located on the Project. The number of people at one time (PAOT)
was considered the primary indicator for the carrying capacity of these amenities. A survey
was administered at these sites to measure both a standard for PAOT at each site and the
current use conditions. The results associated with questions related to PAOT at overlook
vista sites are shown in the Table F.5. When considered together, it suggests that overlook
vista sites are utilized, on average, at 19.8 % of their capacity.
Table F.5 Capacity assessment for overlook vistas.
Standard for Current Capacity
Acceptable Conditions for Utilization
PAOT PAOT
Burkett Lake Recreation Area 5.7 2.3 40.4%
Wanapum Dam Overlook 37.3 5.4 14.5%
Wanapum Turbine Park 41.4 1.9 4.6%
Entire Project - - 19.8%
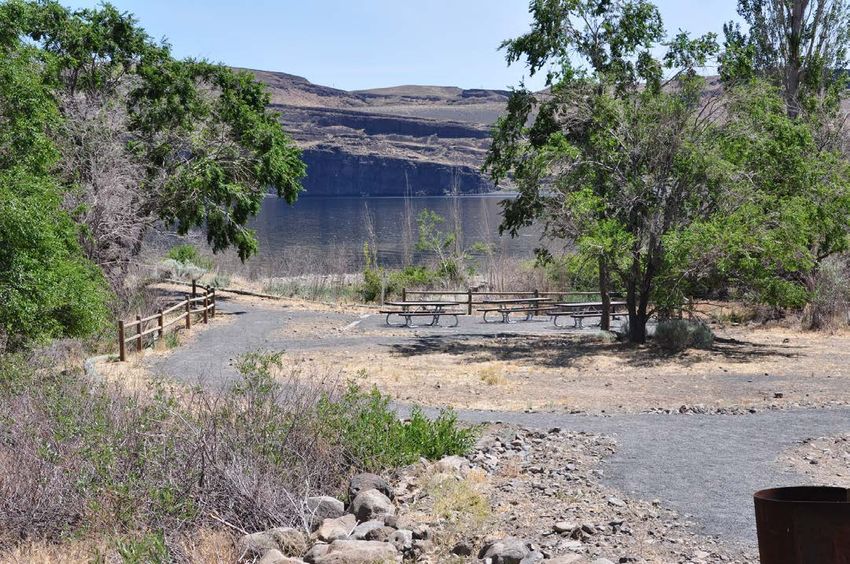
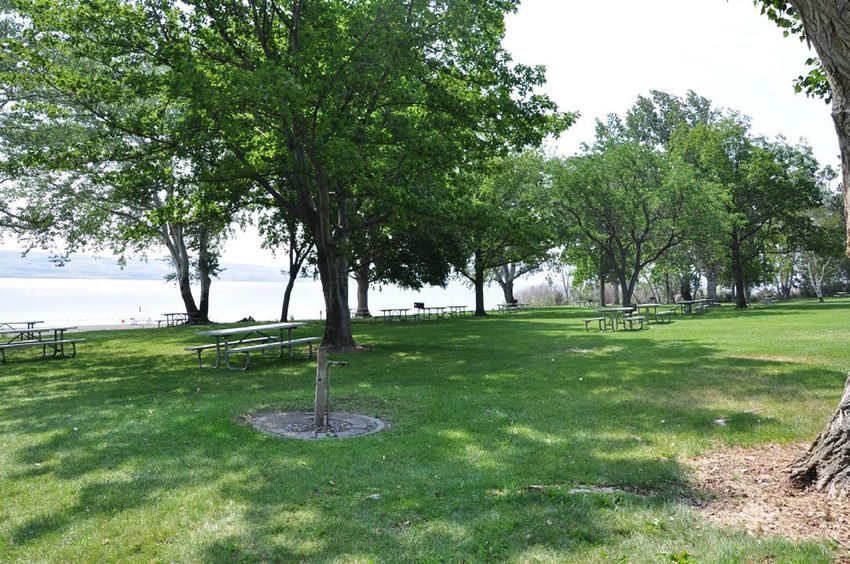
Picnic Areas
Fourteen picnic areas are located on the Project. The number of people at one time (PAOT)
was considered the primary indicator for the carrying capacity of these amenities. A survey
was administered at these sites to measure both a standard for PAOT at each site and the
current use conditions. The results associated with questions related to PAOT at picnic area
sites are shown in the Table F.6. When considered together, it suggests that picnic area
sites are utilized, on average, at 29.5% of their capacity.
Table F.6 Capacity assessment for picnic areas.
Standard for Current Capacity
Acceptable Conditions Utilization
PAOT for PAOT
Crescent Bar Recreation Area
128.2 82.4 64.3%
(CBRA) On-Island
Frenchman Coulee Recreation Area 51.4 6.2 12.1%
Priest Rapids Recreation Area
41.3 11.4 27.6%
(PRRA)
PRRA (North Picnic Area) 41.3 11.4 27.6%
Rattlesnake Cove 55.2 16.2 29.3%
Rocky Coulee 35.4 4.8 13.6%
Sand Hollow 59.8 31.5 52.7%
Sand Hollow 59.8 31.5 52.7%
Sunland Estates Park 98.3 18.9 19.2%
continued…/
14Standard for Current Capacity
Acceptable Conditions Utilization
PAOT for PAOT
The Cove 75.8 1.5 2.0%
Vantage Boat Launch 73.4 18 24.5%
Wanapum Dam Overlook 37.3 5.4 14.5%
Wanapum Recreation Area (Ginkgo
116.3 52.3 45.0%
Petrified Forest State Park)
Wanapum Turbine Park 41.4 1.9 4.6%
Entire Project - - 27.8%
Reservoir Fishing Platform
The only reservoir fishing amenity located on the Project is the Huntzinger Fishing Pier. The
number of people at one time (PAOT) was considered the primary indicator for the carrying
capacity of this site. A survey was administered there to measure both a standard for PAOT
and the current use conditions. Survey results showed that, on average, visitors felt that 5.7
people at one time was acceptable, yet they typically experienced 2.0 people at one time at
the site. This suggests that Huntzinger Fishing Pier, and the reservoir fishing platforms on
the project are utilized, on average, at 35.1% of their capacity.
Tailwater Fishing Access
One tailwater fishing access is located on the Project, the Jackson Creek Fish Camp. The
number of people at one time (PAOT) was considered the primary indicator for the carrying
capacity of this site. A survey was administered there to measure both a standard for PAOT
and the current use conditions. Survey results there showed that, on average, visitors felt that
14.7 people at one time was acceptable, yet they typically experienced 1.0 people at one
time at the site. This suggests that Jackson Creek Fish Camp, and tailwater fishing access
sites on the project are utilized, on average, at 6.8% of their capacity.
Trails
Three designated trails are located on the Project. The number of people at one time (PAOT)
was considered the primary indicator for the carrying capacity of these amenities. Trail
encounters was not used as an indicator because survey data, as previously mentioned, was
collected at the site level and used as a proxy for amenity-level analyses. A survey was
administered at the three trail sites to measure both a standard for PAOT at each site and the
current use conditions. Results associated with questions related to PAOT at trail sites are
shown in the Table F.7. These results are used to calculate capacity utilization of trails at
both Frenchman Coulee and PRRA. However, a calculated capacity utilization of 40.4%
from survey results at Burkett Lake Recreation Area seems suspect, where only six (6)
15people total were counted during the 2015 season (Hallo, et al. 2016). For this trail the
report’s PI (Dr. Jeffrey Hallo) opted, with Grant PUD input, to adjust the capacity utilization
to 10% in the table below based on empirical use counts. When considered together, it
suggests that trail sites are utilized, on average, at 16.6% of their capacity.
Table F.7 Capacity assessment for trail areas.
Standard for Current Capacity
Acceptable Conditions for Utilization
PAOT PAOT
Burkett Lake Recreation Area 5.7 2.3 10.0%*
Frenchman Coulee Recreation
51.4 6.2 12.1%
Area
PRRA 41.3 11.4 27.6%
Entire Project - - 16.6%
*Adjusted
Active Recreation Areas
Two active recreation areas are located on the Project, both within the Crescent Bar
Recreation Area. The number of people at one time (PAOT) was considered the primary
indicator for the carrying capacity at one of these, while playable rounds of golf played was
the indictor at the other. For the former, a survey was administered to measure both a
standard for PAOT and the current use conditions. For the latter, two Professional Golf
Association faculty at Clemson University estimated what percent of potential playable
rounds of golf were actually played, based on secondary data provided by the staff at the
golf course. These secondary data reported that 3,299 rounds of golf (9-holes) were played
in August and September 2015. The results associated these active recreation areas are
shown in the Table F.8. When considered together, it suggests that active recreation areas
are utilized, on average, at 49.7% of their capacity.
Table F.8 Capacity assessment for active recreation areas.
Standard for Current Capacity
Acceptable Conditions for Utilization
PAOT PAOT
CBRA On-Island 128.2 82.4 64.3%
CBRA On-Island (Golf
- - 35.0%
Course)
Entire Project - - 49.7%
16Campgrounds and Campsites
Five campgrounds with a total of 211 campsites are located in the Project. The number of
campsites occupied on weekends was considered the primary indicator for the carrying
capacity of these campgrounds and campsites. Reservation records were used to determine
the number of weekend nights that campsites were occupied during peak season, June
through mid-September (Table F.9). At PRRA and Sand Hollow this number of reserved
nights was increased by 25% to account for ‘drop-in’ (i.e., unreserved) camping. To
determine capacity utilization the number of weekend nights that campsites were occupied
was compared to the total number of weekend nights available for the campsites during peak
season. At Jackson Creek Fish Camp and Rocky Coulee limited records of ‘drop-in’
camping were used to estimate the capacity utilization. The results associated with these
campgrounds and campsites are shown in Table F.9. When considered together, it suggests
that campgrounds and campsites are utilized, on average, at 33.3% of their capacity.
Table F.9 Capacity assessment for campgrounds and campsites.
Total Total Capacity
Number of Number of Utilization
Weekend Weekend
Nights Nights
Available Occupied
CBRA Off-Is. 1,770 1391 78.6%
PRRA 392 216 55.1%
Sand Hollow 1,120 198 17.7%
Jackson Creek Fish Camp - - 5.0%
Rocky Coulee - - 10.0%
Wanapum Recreation Area
(Ginkgo Petrified Forest State 1,700 1,465 86.2%
Park)
Entire Project - - 33.3%*
*The campground and the 50 campsites at Wanapum Recreation Area (Ginkgo Petrified Forest State Park) was
excluded from this calculation because it technically lies outside the Priest Rapids Project even though large
portions of the picnic area and boat launch, and all of the swim area are within the Project. The campground
was utilized on average 86.2% in 2015. Since the visitors fluidly use the park, which influences the amount of
recreational use within the Priest Rapids Project, it should be noted that when the utilization of the
campground is included in the Project-level calculation for campgrounds, they are utilized, on average 42.1%
of their capacity.
17Dispersed Camping Areas
Three dispersed camping areas are located on the Project. Since no established campsites
exist there are no reservation records available, the number of people at one time (PAOT)
was considered the primary indicator of carrying capacity. A survey was administered at
these sites to measure both a standard for PAOT at each site and the current use conditions.
Results associated with questions related to PAOT at dispersed camping areas are shown in
the Table F.10. These results are used to calculate capacity utilization at both Buckshot
Recreation Area and Beverly Sand Dunes ORV Park. However, a calculated capacity
utilization of 41.9% from survey results at Quilomene Dune and Bay seems high, where
only 91 people total were estimated to use the site during the 2015 season (Hallo et al.,
2016). Also, this use estimate likely represents approximately 30 camping groups. For this
area the report’s PI opted, with Grant PUD staff input, to adjust the capacity utilization to
25% in the table below based on empirical use counts. When all results are considered
together, it suggests that dispersed camping area sites are utilized, on average, at 11.4%
of their capacity.
Table F.10 Capacity assessment for dispersed camping areas.
Standard for Current Capacity
Acceptable Conditions for Utilization
PAOT PAOT
Beverly Sand Dunes ORV Park 51.2 4.3 8.4%
Buckshot Recreation Area 503 3 0.6%
Quilomene Dune and Bay 637.0 266.9 25.0%*
Entire Project - - 11.4%
*Adjusted
Marinas
Two marinas are located on the Project, both of which are privately operated. The number of
weekend days that boat slips were occupied was considered the primary indicator for the
carrying capacity of these marinas. Reservation records were used to determine the number
of weekend nights that marina slips were occupied at the CBRA off-island marina. Data
from the marina at Riverstone Resort were unavailable at the time of this report because it
was not in operation. The results associated with marinas are shown in Table F.11. These
results suggest that the CBRA off-island marina and marinas on the Project are utilized,
on average, at 66.2% of their capacity.
18Table F.11 Capacity assessment for marinas.
Total Number of Total Number of Capacity
Weekend Days Weekend Days Utilization
Available Occupied
CBRA Off-Is. 600 397 66.2%
Riverstone Resort Data unavailable – Not in operation in 2015
Entire Project - - 66.2%
Visitor Centers
At the time of data collection for this report (Summer 2015), both the Wanapum Heritage
Center and the Grant PUD Visitor Center were under construction and not open to the
public. Both facilities opened in the fall/winter of 2015. Based on this, the visitor centers’
capacity utilization during the time of reporting was 0.0%.
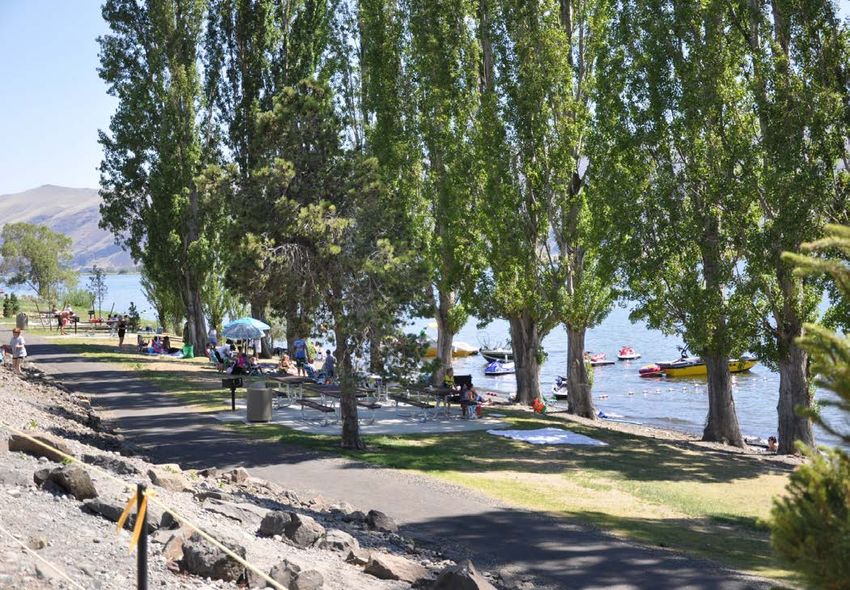
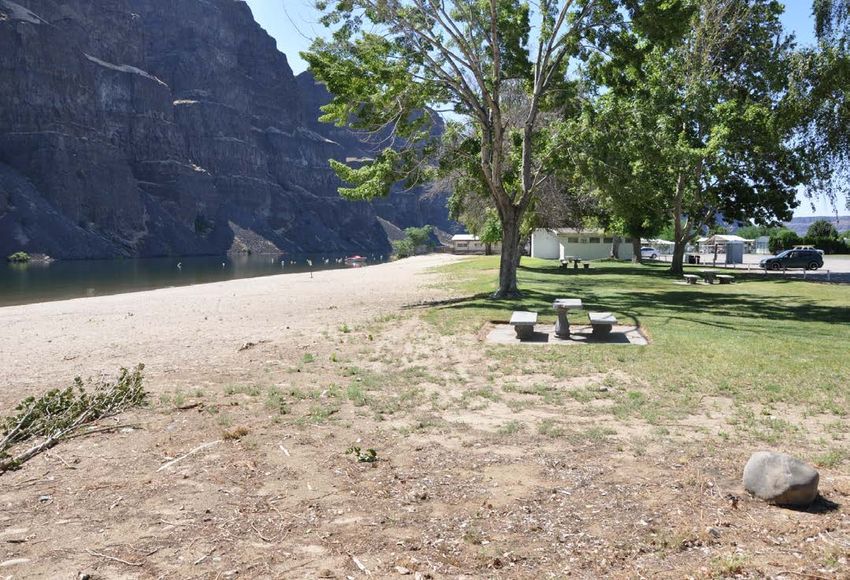
Swimming Areas
Four swimming areas are located on the Project. The number of people at one time (PAOT)
was considered the primary indicator of carrying capacity at these sites. A survey was
administered at these sites to measure both a standard for PAOT at each site and the current
use conditions. The results associated with questions related to PAOT at swimming area
sites is shown in Table F.12. When considered together, it suggests that swimming area
sites are utilized, on average, at 38.7% of their capacity.
Table F.12 Capacity assessment for swimming areas.
Standard for Current Capacity
Acceptable Conditions Utilization
PAOT for PAOT
PRRA 41.3 11.4 27.6%
Rattlesnake Cove 55.2 16.2 29.3%
Sand Hollow 59.8 31.5 52.7%
Wanapum Recreation Area
(Ginkgo Petrified Forest State 116.3 52.3 45.0%
Park)
Entire Project - - 38.7%
19Other Project Amenities
One other amenity is located on the Project that is uncategorized by FERC: the Beverly
Sand Dunes ORV Park. The number of people at one time (PAOT) was considered the
primary indicator for the carrying capacity of this site. A survey was administered there to
measure both a standard for PAOT and the current use conditions. Survey results there
showed that, on average, visitors felt that 51.2 people at one time was acceptable, yet they
typically experienced 4.3 people at one time at the site. This suggests that Beverly Sand
Dunes ORV Park, the only amenity listed under the ‘other’ category on FERC Form
80, is utilized, on average, at 8.4% of its capacity.
Recreation Capacity of the Reservoirs
Standards exist for safe and effective boating capacities on reservoirs (Table F.13).
Standards are expressed in surface acres of water per boat, which is the indicator for
carrying capacity on a waterbody. Most of these standards are generalized, and many
depend on the type of recreation being conducted and the actual context of application.
These standards are intended for application to boats on the water actively engaged in
recreation, not boats docked, moored, or beached on land.
Table F.13 Existing standards for boating capacities on reservoirs.
Standard for
Source
Acres/Boat
National Recreation and Parks Association 4
Bureau of Outdoor Recreation 3-18
Arizona Outdoor Recreation Coordinating 10-20
Commission
Wisconsin Comprehensive Plan 20
Louisiana Parks and Recreation Commission 20
Cascade Reservoir Resource Management Plan 25
Haas et al. (2011) – Bureau of Reclamation
(for suburban and rural developed waters) 10-50
(for Rural Natural) 50-110
Warren and Rea (1989) 1.3-12
Sources if not marked above - NRPA (1981); EDAW (1981, 1990); BOR, USDI (1970); URDC (1977).
20You can also read