Multi Q 2 software facilitates isobaric labeling quantitation analysis with improved accuracy and coverage - Nature
←
→
Page content transcription
If your browser does not render page correctly, please read the page content below
www.nature.com/scientificreports
OPEN Multi‑Q 2 software facilitates
isobaric labeling quantitation
analysis with improved accuracy
and coverage
Ching‑Tai Chen1*, Jen‑Hung Wang1,2,3, Cheng‑Wei Cheng4, Wei‑Che Hsu1, Chu‑Ling Ko5,
Wai‑Kok Choong1 & Ting‑Yi Sung1*
Mass spectrometry-based proteomics using isobaric labeling for multiplex quantitation has become
a popular approach for proteomic studies. We present Multi-Q 2, an isobaric-labeling quantitation
tool which can yield the largest quantitation coverage and improved quantitation accuracy compared
to three state-of-the-art methods. Multi-Q 2 supports identification results from several popular
proteomic data analysis platforms for quantitation, offering up to 12% improvement in quantitation
coverage for accepting identification results from multiple search engines when compared with
MaxQuant and PatternLab. It is equipped with various quantitation algorithms, including a ratio
compression correction algorithm, and results in up to 336 algorithmic combinations. Systematic
evaluation shows different algorithmic combinations have different strengths and are suitable for
different situations. We also demonstrate that the flexibility of Multi-Q 2 in customizing algorithmic
combination can lead to improved quantitation accuracy over existing tools. Moreover, the use of
complementary algorithmic combinations can be an effective strategy to enhance sensitivity when
searching for biomarkers from differentially expressed proteins in proteomic experiments. Multi-Q
2 provides interactive graphical interfaces to process quantitation and to display ratios at protein,
peptide, and spectrum levels. It also supports a heatmap module, enabling users to cluster proteins
based on their abundance ratios and to visualize the clustering results. Multi-Q 2 executable files,
sample data sets, and user manual are freely available at http://ms.iis.sinica.edu.tw/COmics/Softw
are_Multi-Q2.html.
Mass spectrometry-based proteomics has become a dominating approach for identification and quantitation
of proteins from complex biological s amples1. Among several quantitation techniques, isobaric labeling-based
quantitative proteomics has gained increasing attention because of its multiplexed capability, allowing for absolute
and relative protein quantitation in multiple samples within a single r un2,3. For example, a number of research
groups in CPTAC (Clinical Proteomic Tumor Analysis Consortium)4,5 use isobaric labeling experiments, such as
iTRAQ (isobaric Tags for Relative and Absolute Quantitation) or TMT (Tandem Mass Tag), to quantify thousands
of proteins for cancer tissue samples from hundreds of patients.
Two major objectives of bioinformatics analysis of isobaric labeling experiments are enlarging quantitation
coverage (i.e., the number of quantified proteins) and improving quantitation accuracy. Enlarging quantitation
coverage increases the likelihood of finding important biomarkers. To date, a number of isobaric-labeling quanti-
tation software tools support identification results from only a single database search engine for quantitation. For
example, IsobariQ6 and j TraqX7 exclusively support Mascot; M axQuant8, PatternLab9, and O CAP10 exclusively
11 12 13
support Andromeda , Comet , and X!Tandem , respectively. The quantitation coverage for these tools could be
limited because it has been reported that combining multiple search engines can markedly increase the numbers
of identified peptides and p roteins14.
1
Institute of Information Science, Academia Sinica, 128 Academia Road, Section 2, Nankang, Taipei 115,
Taiwan. 2Bioinformatics Program, Taiwan International Graduate Program, Academia Sinica, Taipei 115,
Taiwan. 3Institute of Biomedical Informatics, National Yang-Ming University, Taipei 112, Taiwan. 4Genomics
Research Center, Academia Sinica, Taipei 115, Taiwan. 5Department of Computer Science and Engineering,
University of California San Diego, La Jolla, CA 92093, USA. *email: ctchen@iis.sinica.edu.tw; tsung@
iis.sinica.edu.tw
Scientific Reports | (2021) 11:2233 | https://doi.org/10.1038/s41598-021-81740-4 1
Vol.:(0123456789)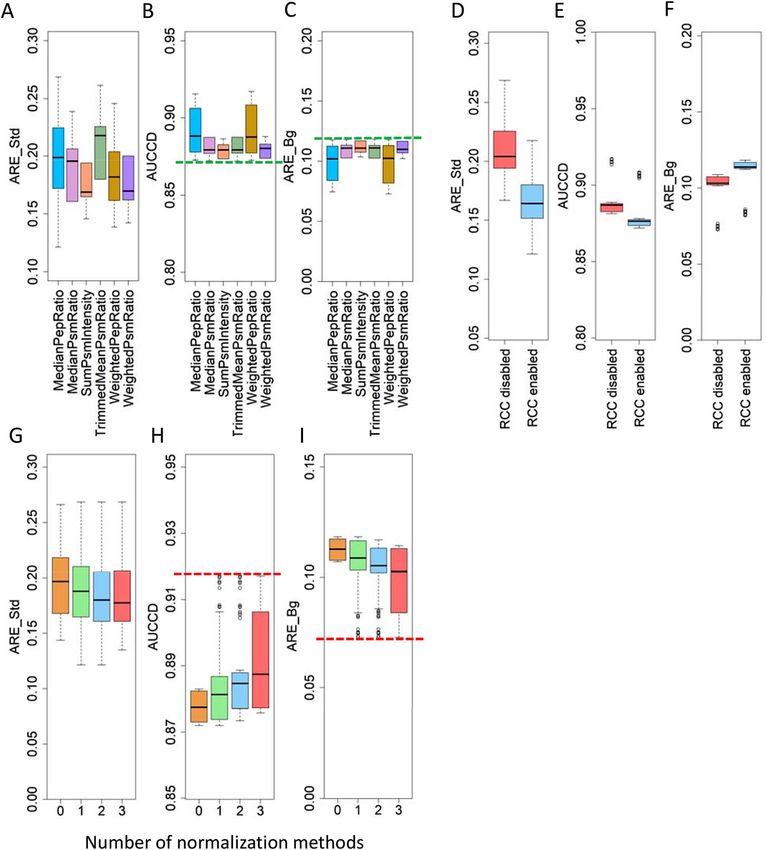
www.nature.com/scientificreports/
For proteomics experiments in search of biomarkers, improving quantitation accuracy decreases the possi-
bilities of false positives (misclassification of proteins with insignificant fold changes as differentially expressed)
and false negatives (misclassification of differentially expressed proteins as having insignificant fold changes).
Isobaric-labeling quantitation workflow usually consists of three major components: calculation of ratio of
protein abundances in two samples (termed protein ratio), normalization, and reducing the effect of ratio
compression15,16 on quantitation accuracy. Protein ratio calculation takes a set of identified PSMs as input to
infer protein ratios. Common approaches include the use of mean17, median7,17,18, weighted average19–21, and 20%
trimmed mean16,17 of the ratios at the spectrum level (PSM ratios) to determine protein ratios. Another common
approach aggregates or sums the reporter ion intensities (usually after normalization) across different PSMs, and
then infers protein ratios based on the aggregate values22. Instead of deriving protein ratios directly from PSMs,
some other methods adopt a hierarchical two-stage procedure, i.e., PSM ratios to infer peptide ratios (stage one),
and peptide ratios to infer protein ratios (stage two). Commonly used two-stage quantitation algorithms adopt
weighted average23 and median6,24 for both stages.
Normalization is usually applied at reporter ion level, in which reporter ion intensity of each channel is nor-
malized according to its m ean17, median6,17,19,20, or s ummation6,17 of intensities across all the spectra. Normaliza-
tion can also be applied at the level of peptide or protein ratio based on the assumption that the median of log
transformed peptide or protein ratios is zero6,7,23. Variance stabilizing normalization is also proposed to address
the issue of heterogeneity of variance among peaks of varying intensities6,16,17,25. Ratio compression arises from
the presence of coeluting peptides within a precursor isolation window, resulting in systematic underestimation
of actual protein and peptide abundance variations16,26–29. Using triple-stage mass spectrometry (MS3)30,31 or
dual isolation width acquisition32 can mitigate the negative impact of these interfering signals, but they require
modifications in the experimental settings or the instrument control code and are not applicable to the majority
of existing isobaric labeling data sets. On the other hand, an algorithm that corrects compressed ratios based on
calculated signal-to-interference ratios has been p roposed33, offering an attractive solution to ratio compression.
Quantitation results depend on the combination of algorithms for protein ratio calculation, normalization,
and correction of ratio compression. In spite of great efforts being made to devise the above-mentioned algo-
rithms, there is a lack of systematic evaluation of all the algorithmic combinations with various scoring functions.
In light of the situation, we develop a standalone and installation-free software tool, Multi-Q 2, which is equipped
with six protein ratio calculation algorithms, four peptide ratio calculation algorithms, three normalization algo-
rithms, and the ratio compression correction (RCC) algorithm. With Multi-Q 2, we generate up to 336 algorith-
mic combinations and systematically evaluate them with standard data sets using various evaluation measures.
Our analyses reveal that different algorithmic combinations have different strengths and are suitable in different
scenarios. To be specific, algorithmic combinations that better quantify proteins of larger fold changes tend to
sacrifice the accuracy for proteins of smaller fold changes, and vice versa. Thus, it is preferable that a software tool
provides the flexibility of customizing quantitation algorithms for different purposes. With proper selection of
algorithmic combinations, Multi-Q 2 can achieve better quantitation accuracy than MaxQuant, PatternLab, and
Libra34,35. We further demonstrate that while searching for differentially expressed proteins, a set of six selected
algorithmic combinations produce 70% to 90% common candidate proteins, suggesting that using algorithmic
combinations of complementary rationale simultaneously in search of differentially expressed proteins can be a
reasonable strategy to increase either sensitivity or precision.
Multi-Q 2 is a Windows-based software tool designed with great flexibility. It supports identification results
from Trans-Proteomic Pipeline (TPP)34,35, PeptideShaker36, and the commercial Proteome Discoverer, offering
up to 12% improvement in coverage compared with MaxQuant and PatternLab, both of which are limited to
identification results of a single database search engine. Multi-Q 2 provides interactive graphical user interfaces
to perform quantitation and to display protein, peptide, PSM ratios as well as raw and processed reporter ion
intensities. Moreover, a heatmap module is implemented to cluster proteins based on the calculated ratios using
hierarchical clustering, K-means, and fuzzy C-means, facilitating users to perform further investigations.
Methods and data sets
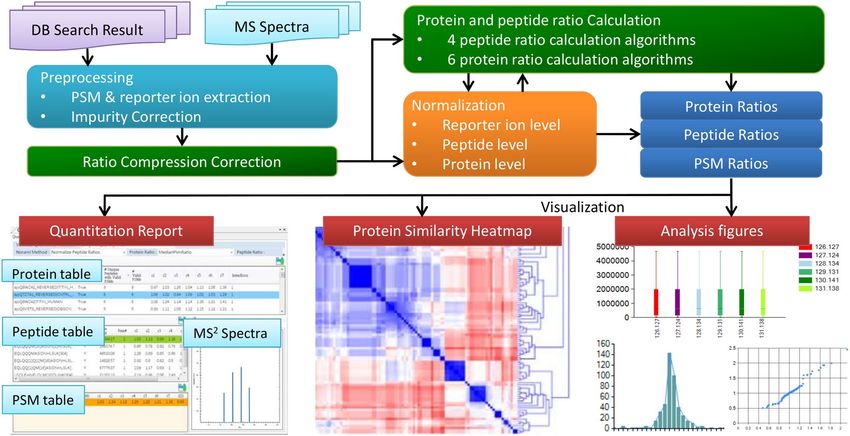
Multi‑Q 2 for isobaric‑labeling quantitation analysis. Overview of Multi‑Q 2. As illustrated in
Fig. 1, Multi-Q 2 takes database search results and MS spectra files as input, and then performs standard pre-
processing steps, including reporter ion extraction and isotope impurity correction. A ratio compression correc-
tion (RCC) algorithm is implemented to resolve the isobaric interference problem caused by co-eluting peptide
ions in the precursor isolation window. Multi-Q 2 supports various commonly used algorithms to calculate
protein and peptide ratios, and normalization algorithms applied at reporter ion, peptide, and protein levels.
Quantitation results in terms of protein, peptide, and PSM ratios can be visualized through interactive graphi-
cal user interfaces. A heatmap as well as a dendrogram can be generated with unsupervised learning on protein
ratios to characterize similarities among proteins.
Input format and preprocessing of Multi‑Q 2. Multi-Q 2 accepts MS spectra files in mzML or mzXML format.
It accepts statistically validated search results from three popular proteomics data analysis systems: (1) pep.xml
and prot.xml files from TPP, (2) xls files from PeptideShaker, and (3) pep.xml and prot.xml files from Proteome
Discoverer. Statistical validation is usually performed with a target-decoy search strategy which provides estima-
tion of false discovery rate (FDR) for given PSMs and thus can distinguish correct PSMs from incorrect PSMs
under a specified FDR37. To ensure correct PSMs for further quantitation, Multi-Q 2 takes the spectra satisfying
an FDR of 1% at peptide and protein levels by default and extracts their reporter ions. Isotope impurity correc-
tion on reporter ions is then performed based on the correction matrices provided by reagents’ manufacturers23.
Scientific Reports | (2021) 11:2233 | https://doi.org/10.1038/s41598-021-81740-4 2
Vol:.(1234567890)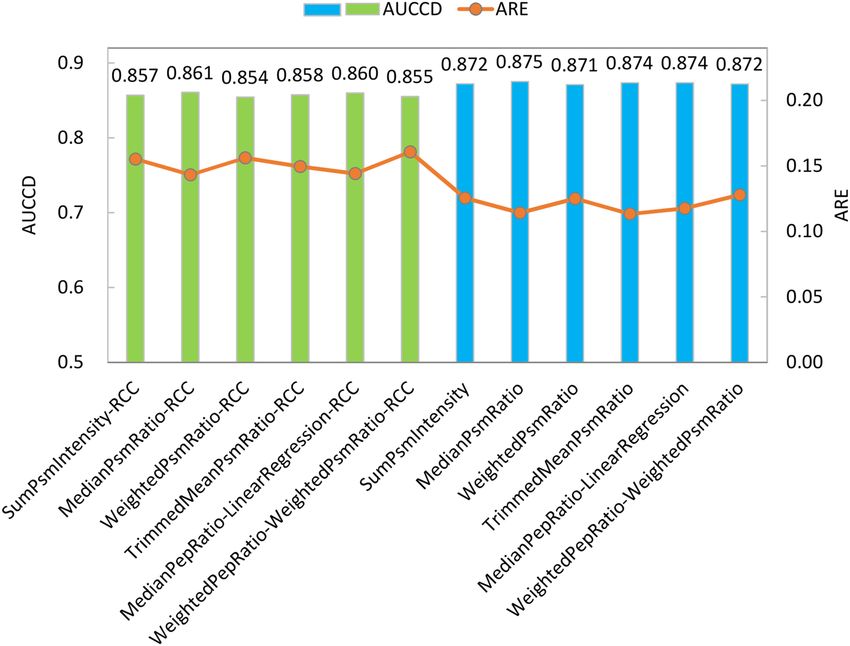
www.nature.com/scientificreports/
Figure 1. Overview of Multi-Q 2.
Multi-Q 2 includes preset matrices for iTRAQ-4, iTRAQ-8, TMT-6, TMT-8, and TMT-10. User-defined correc-
tion matrix is also supported.
Ratio compression correction. An algorithmic solution to the ratio compression issue has been proposed in
Savitski et al.33 and is shown to improve quantitation accuracy without sacrificing quantitation coverage as spec-
tra filtering approach d oes33. This RCC algorithm is implemented in Multi-Q 2. The assumption of the RCC
algorithm is that the total percentage of noise from co-eluting interferences in the reporter ions of an M S2 scan
is consistent with the percentage of noise of co-eluting interferences versus the total ion signals in its precursor
isolation window. The authors calculate the signal-to-interference (S2I) measure as the abundance of a precur-
sor and its isotope cluster divided by the sum of all ion signals observed within the isolation window. S2I ranges
from zero to one and a smaller value indicates a higher degree of interferences caused by co-fragmented peptide
ions. RCC calculates the total amount of noise in reporter ions as the product of 1-S2I and the summation of all
the reporter ion intensities, thereby inferring putative noise for each channel. The putative noise is then deducted
from the raw reporter ion intensity of the corresponding channel, and the resulting corrected intensity is used
for quantitation in Multi-Q 2.
Protein and peptide ratio calculation. Multi-Q 2 calculates PSM, peptide and protein ratios between two
selected channels in an experiment at PSM, peptide, and protein levels, respectively. Given a PSM, the corrected
reporter ion intensities of the two channels in the spectrum are used to calculate the PSM ratio. Multi-Q 2 sup-
ports the following four different approaches to calculate peptide ratios from PSMs: (1) LinearRegression: collect
paired reporter ion intensities of two selected channels across all PSMs of a peptide, and use the slope of the
linear regression model as the peptide ratio; (2) SumPsmIntensity: sum up the reporter ion intensities across all
PSMs of a peptide, and use these aggregate values to derive peptide ratios; (3) MedianPsmRatio: use the median
of PSM ratios as the peptide ratio; (4) WeightedPsmRatio: use the weighted average of PSM ratios to derive pep-
tide ratios, in which the weight of a PSM ratio is proportional to the summation of its reporter ion intensities.
To calculate protein ratios, the following six algorithms are supported: (1) SumPsmIntensity: sum up the
reporter ion intensities across all PSMs assigned to the protein, and use these aggregate values to derive protein
ratios; (2) MedianPsmRatio: use the median of the PSM ratios as the protein ratio; (3) WeightedPsmRatio: same
as the WeightedPsmRatio approach for peptide ratio calculation except for the use of all the PSMs assigned to
the protein; (4) TrimmedMeanPsmRatio: remove 20% of the largest and the smallest PSM ratios, respectively,
and calculate the mean of the remaining PSM ratios as the protein ratio; (5) MedianPepRatio: use the median
of the calculated peptide ratios as the protein ratio; (6) WeightedPepRatio: use the weighted average of peptide
ratios to derive protein ratios, in which the weight of a peptide ratio is defined as the median of the weights of
PSM corresponding to the peptide.
Normalization. Multi-Q 2 supports three different levels of normalizations. Normalization at the reporter ion
level adjusts reporter ion intensities of respective channels so that their median intensities are identical based
on the assumption that the sample amounts across different channels remain constant. Based on the assump-
tion that the amounts of most of peptides (proteins) across different channels, e.g., channels corresponding to
Scientific Reports | (2021) 11:2233 | https://doi.org/10.1038/s41598-021-81740-4 3
Vol.:(0123456789)
www.nature.com/scientificreports/
samples of patients with different states of a disease, remain the same, normalization of peptide (protein) ratios
is to multiply the ratios by the reciprocal of the median peptide (protein) ratio so that the normalized peptide
(protein) ratios have a median of 1.
Data sets. Four data sets were obtained from public domain to evaluate various ratio calculation algorithms
and normalization approaches of Multi-Q 2. These are (1) Gatto-TMT638, a data set of Erwinia carotovora lysate
with four standard proteins at varying ratios, (2) Hultin-iTRAQ839, a standard data set of human A549 cell lysate
with known abundance ratios at 2:2:1:1:2:2:1:1, (3) NCI-740, a TMT-10 data set from seven cancer cell lines, and
(4) Chen-iTRAQ841, a data set of samples from anaerobic thermophilic eubacterium. Detailed descriptions of the
data sets can be found in Supplementary Text S1.
Protein and peptide identification of data sets for further quantitation. Gatto-TMT6 and Hul-
tin-iTRAQ8 were processed by nine different database search methods and statistical validation tools in order to
investigate the coverage of the identified proteome. The first eight methods used search engines in S earchGUI42
for searches, followed by statistical validation using PeptideShaker, where the first seven methods used a sin-
gle search engine, including M yriMatch43, Andromeda, OMSSA44, Tide45, Comet, X!Tandem and MSGF+46,
and the eighth method adopted combined searches using Comet, X!Tandem, and MSGF+. The ninth method
used Comet and X!Tandem searches in TPP followed by PeptideProphet47, iProphet48, and Mayu49 for statistical
validation. NCI-7 was processed by Comet and X!Tandem searches using SearchGUI and statistical validation
using PeptideShaker for protein identification. Chen-iTRAQ8 was processed by Comet, X!Tandem, and MSGF+
searches in TPP followed by PeptideProphet, iProphet, and Mayu. All of the operations in TPP were performed
via WinProphet50, a software system for proteomic pipeline creation and management. All of the database search
parameters were identical to the settings reported in their original papers. Identified proteins and peptides were
validated with FDR no greater than 1%.
Evaluation measures for quantitation results. The coverage of ratios at protein level under a deviation
of a certain amount from the ideal value has been used to evaluate the accuracy of quantitation results. Previous
studies compare the coverage at 10%, 20%, and 30% deviation for different quantitation tools17,20,21. To general-
ize the concept, we devise a measure called area under the curve of coverage vs deviation (AUCCD), in which a
curve is generated on a 2D plane with x-axis denoting deviation of protein ratios, ranging from 0 to 100% to
the ideal values, and y-axis denoting coverage of protein ratios within the deviation. A large AUCCD indicates
larger coverage of protein ratios within the specific range (0–100% in our design) of deviation and implies
higher accuracy of quantitation. We also use two additional measures: average relative error (ARE), defined as
the average of |xi−yi|/yi over all the protein ratios, and root mean square error (RMSE), defined as the square root
of Σi(xi−yi)2/m, where xi and yi denote calculated and ideal ratios at protein level, respectively, and m is the total
number of ratios at protein level. Particularly for ARE, since one of our data sets, i.e., Gatto-TMT6, contains
standard proteins and background proteins, we further distinguish ARE_Std and ARE_Bg to denote the ARE
of ratios for all standard proteins and for all background proteins, respectively. AUCCD focuses on the percent-
age of protein ratios within a specific range of deviation to their ideal values and ignores the ratios far from the
ideal values. RMSE, in contrast, produces much larger penalties for protein ratios of the latter case. ARE assigns
larger (smaller) tolerance for protein ratios of larger (smaller) ideal values so that ratios at different scales can be
considered on the same basis. The three evaluation measures are designed based on different rationale and are
used integrally to provide a more comprehensive understanding for quantitation results.
Results and discussion
Comparison of identification results from different database search and validation tools. Since
quantitation tools accept identification results for further quantitation, we first compared identification results of
two standard data sets, Gatto-TMT6 and Hultin-iTRAQ8, from using a single search engine or multiple search
engines, followed by validation using different tools. Supplementary Figs. S1 and S2 show the numbers of identi-
fied proteins from the nine proteomic identification approaches for Gatto-TMT6 and Hultin-iTRAQ8, respec-
tively. It can be observed that identification approaches based on a single database search tool generate varying
numbers of identified proteins (386–449 proteins for Gatto-TMT6 and 2018–2305 proteins for Hultin-iTRAQ8),
and in general are outnumbered by identification approaches based on multiple database search tools (452–460
proteins for Gatto-TMT6 and 2378–2555 proteins for Hultin-iTRAQ8). For both data sets, the last search result
(Comet and X!Tandem searches in TPP followed by PeptideProphet, iProphet, and Mayu) generates the highest
number of proteins, even higher than combined searches using Comet, X!Tandem, and MSGF+46 and validated
by PeptideShaker; notably, Hultin-iTRAQ8 shows an increase of 7.4% or 177 proteins (from 2378 to 2555 pro-
teins) being identified. The results suggest validation tools can be a significant factor affecting the coverage of the
identified proteome. This phenomenon highlights an advantage of Multi-Q 2—the capability of accepting multi-
ple database search results from several popular proteomic data analysis systems including TPP, PeptideShaker,
and Proteome Discoverer. Because of the largest coverage, the identification results based on TPP were used by
Multi-Q 2 to perform quantitation for further benchmark analysis.
Comprehensive comparison of different algorithmic combinations used in Multi‑Q 2 for quan-
titation. Overview of the comparison. To evaluate different algorithmic combinations of Multi-Q 2, we used
the standard data sets Gatto-TMT6 and Hultin-iTRAQ8 since the ideal protein ratios are known and can be used
as the ground truth. There are various algorithms in the workflow of Multi-Q 2, including four algorithms for
peptide ratio calculation, six algorithms for protein ratio calculation, and two possibilities of RCC (enabled or
Scientific Reports | (2021) 11:2233 | https://doi.org/10.1038/s41598-021-81740-4 4
Vol:.(1234567890)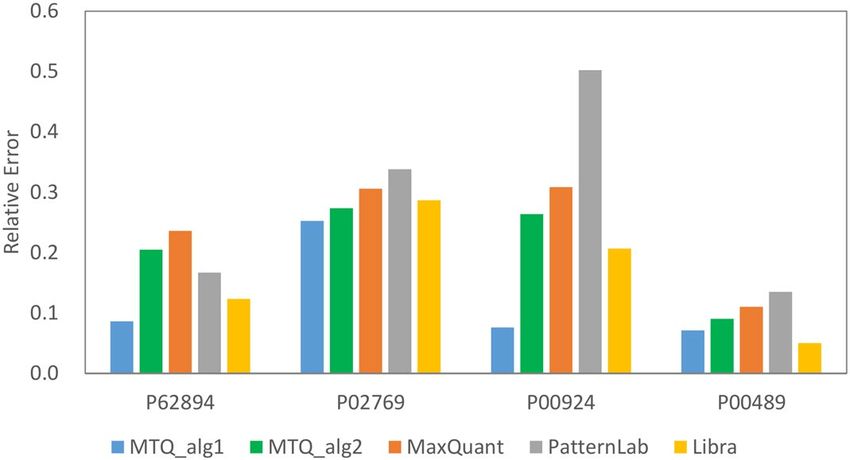
www.nature.com/scientificreports/

                                  disabled). In addition, we used seven different normalization approaches: no normalization, reporter ion level
                                  normalization only, peptide level normalization only, protein level normalization only, reporter ion plus peptide
                                  level normalization, reporter ion plus protein level normalization, and all three levels of normalization.
                                      A large-scale systematic benchmark experiment was conducted on Gatto-TMT6 by exhaustively generating
                                  all 336 (4 × 6 × 7 × 2) possible combinations of different quantitation and normalization algorithms. Similarly,
                                  on Hultin-iTRAQ8 48 (4 × 6 × 2) algorithmic combinations were exhaustively generated with no normalization
                                  because the sample proportions across different channels in this data set are not of equal amount. Note that
                                  some of the combinations can have identical quantitation results at protein level regardless of any peptide ratio
                                  calculation method used. For example, if protein ratios are directly derived from PSM ratios, altering peptide
                                  ratio calculation algorithm does not change protein ratios.

                                  Comparison of all possible algorithmic combinations in Multi‑Q 2 on Gatto‑TMT6. Benchmark results of 336
                                  algorithmic combinations on Gatto-TMT6 are shown in Supplementary Table S1. It can be observed that the top
                                  20 algorithmic combinations evaluated by AUCCD and ARE have very close performances, suggesting that there
                                  are a group of algorithmic combinations rather than a single one capable of generating accurate quantitation
                                  results. We summarize the information in Supplementary Table S1 to compare the six protein ratio calculation
                                  algorithms, RCC enabled and disabled, and the number of normalization algorithms being used in Fig. 2. Fig-
                                  ure 2A shows that algorithmic combinations using MedianPepRatio for protein ratio calculation have the lowest
                                  ARE_Std as evidenced by its lowest whisker. From Fig. 2B,C it is obvious the worst case of the six algorithms
                                  in terms of AUCCD and ARE_Bg are comparable, as indicated by the green dashed lines. Algorithmic combi-
                                  nations using MedianPepRatio and WeightedPepRatio have significantly larger interquartile range, leading to
                                  the best AUCCD and ARE_Bg. Interestingly, these are the only two methods that derive protein ratios from
                                  peptide ratios. The situation suggests an additional stage at peptide level can provide useful information which
                                  can increase the protein-level quantitation accuracy of background proteins. Enabling RCC produces consider-
                                  able improvement (by 0.05, from 0.2 down to 0.15) in ARE_Std (Fig. 2D), but inevitably deteriorates AUCCD
                                  (Fig. 2E) and ARE_Bg (Fig. 2F) by 0.01–0.02 because RCC tends to pull protein ratios away from one. It can
                                  also be seen that algorithmic combinations with normalization achieve better AUCCD, ARE_Bg, and ARE_Std,
                                  compared to those without normalization. Using more normalization approaches (applied at different levels)
                                  in general improve AUCCD (Fig. 2H) and ARE_Bg (Fig. 2I) of different algorithmic combinations. However,
                                  the combinations with the lowest ARE_Bg and the highest AUCCD seem to be comparable for using one, two,
                                  and three normalization methods, as indicated by the red dashed lines in Fig. 2H,I. Applying any number of
                                  normalization methods creates a slight improvement in ARE_Std over the case without normalization, as shown
                                  in Fig. 2G.
                                      When sorting Supplementary Table S1 by ARE_Std in ascending order, the method of using MedianPep-
                                  Ratio for protein ratio and LinearRegression for peptide ratio with RCC enabled (denoted as MedianPepRa-
                                  tio-LinearRegression-enRCC) yields the best performance, with an ARE_Std of 0.122 among 336 algorithmic
                                  combinations. Incorporating this method with different normalization strategies does not significantly affect
                                  the performance as long as normalization is enabled, as evidenced by the top five algorithmic combinations in
                                  the sorted table (with ARE ranging from 0.122 to 0.135). When sorting Supplementary Table S1 by AUCCD in
                                  descending order or by ARE_Bg in ascending order, the method of using WeightedPepRatio for protein ratio
                                  and WeightedPsmRatio for peptide ratio with RCC disabled (denoted as WeightedPepRatio-WeightedPsmRatio-
                                  disRCC) is one of the best algorithmic combinations, generating an AUCCD of 0.917 and an ARE_Bg of 0.073.
                                  Again, these measures are insensitive to different normalization strategies as long as normalization is enabled,
                                  as evidenced by the top three algorithmic combinations in the sorted table. The results reveal MedianPepRatio-
                                  LinearRegression-enRCC better fits protein ratios of significant fold changes (the four standard proteins’ ratios
                                  ranging from 0.1 to 10) while it inevitably sacrifices the accuracy for protein ratios with an ideal value of one.
                                  WeightedPepRatio-WeightedPsmRatio-disRCC tends to compress protein ratios towards one and better fits the
                                  ratios of background proteins (yielding higher AUCCD and lower ARE_Bg) while sacrificing the accuracy for
                                  proteins with significant fold changes (yielding higher ARE_Std).

                                  Comparison of all possible algorithmic combinations in Multi‑Q 2 on Hultin‑iTRAQ8. Benchmark results of the
                                  48 algorithmic combinations on Hultin-iTRAQ8 are reported in Supplementary Table S2. It can be observed the
                                  best algorithmic combination for background proteins of Gatto-TMT6, WeightedPepRatio-WeightedPsmRatio-
                                  disRCC, yields an AUCCD of 0.945 and an ARE of 0.091 on Hultin-iTRAQ8 and is among one of the best
                                  algorithmic combinations evaluated by both measures. The algorithmic combination of MedianPepRatio-Line-
                                  arRegression-enRCC yields an AUCCD of 0.934 (rank 33/48) and an ARE of 0.113 (rank 32/48). The relatively
                                  worse performance can be anticipated because MedianPepRatio-LinearRegression-enRCC performs better for
                                  protein ratios with significant fold changes, which are not present in this data set. To further summarize the
                                  information in Supplementary Table S2, boxplots are generated and reported in Supplementary Figs. S3 and
                                  S4. Supplementary Fig. S3 indicates that all the six algorithms for protein ratio calculation have similar boxplot
                                  ranges for both AUCCD and ARE. That being said, the highest AUCCD and the lowest ARE are achieved by
                                  methods based on MedianPepRatio, WeightedPepRatio, and WeightedPsmRatio, as illustrated by the red dashed
                                  lines in Supplementary Fig. S3A and B. Supplementary Fig. S4 shows that enabling RCC results in slightly lower
                                  AUCCD and higher ARE, which is in good agreement with the observations from Gatto-TMT6, as shown in
                                  Fig. 2E,F. As the ideal protein ratios in this data set are either 1 or 2 (smaller fold changes), we can therefore
                                  conclude that RCC slightly deteriorates ARE for proteins of smaller fold changes, despite its improved accuracy
                                  for proteins of larger fold changes.

Scientific Reports |   (2021) 11:2233 |                https://doi.org/10.1038/s41598-021-81740-4                                                 5

                                                                                                                                             Vol.:(0123456789)
www.nature.com/scientificreports/
Figure 2. Summarizations of evaluation on algorithmic combinations for (A–C) different protein ratio
calculation algorithms, (D–F) RCC enabled and disabled, and (G–I) the number of normalization methods
based on Gatto-TMT6. Evaluation measures include average relative error of standard proteins (ARE_Std), area
under the curve of coverage vs. deviation (AUCCD), and average relative error of background proteins (ARE_
Bg). Each boxplot in panels A–C and D–F represents a summarization of 56 and 168 algorithmic combinations,
respectively. Boxplots of 0, 1, 2, and 3 normalization methods in panels G-I correspond to summarizations of 48,
144, 96, and 48 algorithmic combinations, respectively.
Comparison of 12 algorithmic combinations on NCI‑7. We used Multi-Q 2 to quantify a total of 10,524 pro-
teins (with no missing value in any reporter ion) in NCI-7. Six protein ratio calculation methods were used
for benchmark analysis, where the two methods based on peptide ratios are particularly chosen to be Medi-
Scientific Reports | (2021) 11:2233 | https://doi.org/10.1038/s41598-021-81740-4 6
Vol:.(1234567890)www.nature.com/scientificreports/
Figure 3. Area under the curve of coverage vs deviation (AUCCD, primary y-axis) and average relative error
(ARE, secondary y-axis) of the 12 algorithmic combinations for NCI-7. The green and blue bars correspond to
methods with RCC enabled and disabled, respectively.
anPepRatio-LinearRegression and WeightedPepRatio-WeightedPsmRatio based on our previous analyses on
Gatto-TMT6 and Hultin-iTRAQ8. For all the six methods, RCC can be enabled or disabled, resulting in 12
different algorithmic combinations. Normalization was disabled because of the unequal abundance ratios (i.e.,
1:1:0.5:1:1:0.5:1:1:0.5:1) among channels. Performance evaluation of the quantitation results from the 12 algo-
rithmic combinations is illustrated in Fig. 3. It can be seen different protein ratio calculation algorithms produce
slight differences in terms of AUCCD and ARE, whereas enabling RCC (green bars in Fig. 3) leads to a decrease
of AUCCD ranging from 0.014 to 0.017 and an increase of ARE ranging from 0.026 to 0.037 (for the same pro-
tein ratio calculation algorithm). This phenomenon is consistent to the observations from Hultin-iTRAQ8 and
from background proteins of Gatto-TMT6: enabling RCC alleviates ratio compression problem at the cost of
lowering the quantitation accuracy for background proteins with fold changes close to 1. Nevertheless, switch-
ing protein ratio calculation algorithms has relatively smaller impact to overall performance for NCI-7 possibly
because (1) wet-lab experimental procedures were rigorously performed, (2) the acquired MS spectra have good
signal-to-noise ratio and are of high quality, and (3) the data set does not have proteins of large fold changes for
which different algorithms can sometimes produce quite different estimated protein ratios.
Summary of performance evaluation based on different algorithmic combinations. The experiment results show
that several algorithmic combinations, instead of a single combination, can achieve the best performance. In
general, the algorithmic combination most suitable for quantifying proteins of significant fold changes (i.e., dif-
ferentially expressed proteins) sacrifices its accuracy for proteins of insignificant fold changes (i.e., background
proteins). Enabling RCC does to some extent remedy ratio compression, but inevitably decreases the quanti-
tation accuracy for background proteins because it tends to pull protein ratios away from one. To quantify a
data set with equal amounts of samples across different channels, algorithmic combinations with normalization
achieve better AUCCD, ARE_Bg, and ARE_Std compared to those without normalization, as shown in the
results of Gatto-TMT6. Using one, two, and three different normalization methods can all achieve the lowest
ARE_Bg and the highest AUCCD. For NCI-7, altering protein ratio calculation algorithm has marginal impact
on AUCCD and ARE. Enabling RCC does lead to a slight decrease in AUCCD and a slight increase in ARE, both
are in good agreement with the observations of background proteins from Gatto-TMT6 and Hultin-iTRAQ8.
Performance comparison of Multi‑Q 2 and existing tools using Gatto‑TMT6. To evaluate the
performance of Multi-Q 2, we compared its performance with those of PatternLab, MaxQuant, and Libra on
Gatto-TMT6. In addition to AUCCD and ARE, we use root mean square error (RMSE), mean, and standard
deviation (SD) to evaluate protein ratios of background proteins.
For quantitation, Libra uses the same identification results as Multi-Q 2 (i.e., Comet and X!Tandem searches
on TPP followed by PeptideProphet, iProphet and Mayu), and PatternLab and MaxQuant use their built-in
Comet and Andromeda, respectively, for database searches, followed by their own statistical validation algo-
rithms. The numbers of quantifiable proteins of Multi-Q 2, PatternLab, MaxQuant, and Libra are 456, 406, 418,
Scientific Reports | (2021) 11:2233 | https://doi.org/10.1038/s41598-021-81740-4 7
Vol.:(0123456789)www.nature.com/scientificreports/
Figure 4. Comparison of relative errors of the four standard proteins of Gatto-TMT6 among different software
tools.
MTQ_alg1 MTQ_alg2 MaxQuant PatternLab Libra
AUCCD 0.886 0.928* 0.895 0.909 0.902
ARE_Bg 0.105 0.062 0.095 0.081 0.088
RMSE 0.139 0.105 0.145 0.131 0.125
Mean 0.934 1.006 1.055 1.037 0.972
SD 0.122 0.105 0.135 0.126 0.122
Table 1. Performance comparison of the four software tools on the 372 commonly quantifiable background
proteins of Gatto-TMT6. *Boldface indicates the best measure among the four tools.
and 440, respectively. Multi-Q 2 has the largest coverage because it benefits from the use of multiple database
search engines and its flexibility in supporting various protein and peptide validation systems, as mentioned
earlier.
No single algorithmic combination is the best for all situations under all evaluation measures according to
the previous analyses. For the purpose of performance comparison, two algorithmic combinations of Multi-Q 2
were selected. The first, denoted by MTQ_alg1, stands for MedianPepRatio-LinearRegression with normaliza-
tion at reporter ion level and RCC enabled (one of the best algorithmic combinations for standard proteins in
Gatto-TMT6). The second, denoted by MTQ_alg2, stands for WeightedPepRatio-WeightedPsmRatio with nor-
malization at peptide level and RCC disabled (one of the best algorithmic combinations for background proteins
in Gatto-TMT6). Relative errors of the four standard proteins for the compared tools are illustrated in Fig. 4,
and ARE_Std for MTQ_alg1, MTQ_alg2, MaxQuant, PatternLab, and Libra are 0.122, 0.208, 0.240, 0.286, and
0.167, respectively. It is evident that our systematic evaluation of quantitation algorithms for quantifying stand-
ard proteins leads to significant improvement of MTQ_alg1 over the compared tools. Interestingly, MTQ_alg2,
the one more suitable for quantifying background proteins according to our analysis, compares favorably over
MaxQuant and PatternLab in terms of ARE_Std as well. It is worth noting that the improvement of ARE_Std in
Multi-Q 2 comes partly from the use of RCC, since disabling it leads to an overall increase of 0.056 in ARE_Std, as
shown in Supplementary Fig. S5. We further evaluated the four tools on the 372 background proteins commonly
quantifiable by all of them, and the results are summarized in Table 1. MTQ_alg2 yields the highest AUCCD
and the lowest ARE_Bg and RMSE among all the compared software tools; its mean of protein ratios is closest
to the theoretical value of 1, and its standard deviation (SD) is the smallest. It is obvious that MTQ_alg1 does
not perform as well as MTQ_alg2 in this evaluation. The results on MTQ_alg1 and MTQ_alg2 again highlight
an important fact: the quantitation algorithms that better fit significant fold changes could have lower accuracy
for fitting insignificant fold changes (i.e., without differential expression), and vice versa. It is thus beneficial
for a software tool to provide the flexibility of customizing the quantitation algorithms for different purposes.
Performance comparison of Multi‑Q 2 and existing tools using Hultin‑iTRAQ8. Multi-Q 2, Pat-
ternLab, MaxQuant, and Libra quantified 2528, 2285, 2315, and 2486 proteins, respectively. Again, Multi-Q 2
has significantly larger coverage in quantifiable proteins than MaxQuant and PatternLab because it benefits from
the use of multiple search engines (Comet and X!Tandem searches in TPP followed by PeptideProphet, iProphet,
and Mayu). We then evaluated the four tools on the 2023 commonly quantifiable proteins, and the results are
summarized in Table 2. MTQ_alg2 yields an AUCCD of 0.905, an ARE of 0.086, and a RMSE of 0.218, all of
which are the best among all the tools; MTQ_alg1 achieves the second best in terms of these three measures.
MTQ_alg1 yields the smallest standard deviation for protein ratios with ideal values of 2 (SD2). Libra gener-
ates protein ratios with their mean closest to the theoretical value of either 1 (Mean1) or 2 (Mean2). PatternLab
generates the smallest standard deviation for protein ratios with ideal values of 1 (SD1). We further performed
pairwise comparisons of protein fold changes calculated by MTQ_alg2 and the other three tools (MaxQuant,
Scientific Reports | (2021) 11:2233 | https://doi.org/10.1038/s41598-021-81740-4 8
Vol:.(1234567890)www.nature.com/scientificreports/
MTQ_alg1 MTQ_alg2 MaxQuant Libra PatternLab
AUCCD 0.901 0.905* 0.889 0.894 0.899
ARE 0.090 0.086 0.102 0.094 0.091
RMSE 0.220 0.218 0.243 0.228 0.226
Mean1# 0.955 0.964 1.102 0.989 0.966
Mean2 1.964 1.981 2.099 1.993 1.970
SD1 0.155 0.148 0.148 0.156 0.136
SD2 0.253 0.256 0.263 0.269 0.271
Table 2. Evaluation measures for 2023 commonly quantifiable proteins of the four software tools on Hultin-
iTRAQ8. *Boldface indicates the best measure among the tools. # Since this standard data set has an ideal
protein ratio of either 1 or 2, we use Mean1 and SD1 to represent mean and standard deviation of protein
ratios with an ideal value of 1, and use Mean2 and SD2 to represent mean and standard deviation of protein
ratios with an ideal value of 2.
PatternLab, and Libra); the results are shown in Supplementary Fig. S6. All of them show very high correlation
(R2 between 0.93 and 0.96; slope between 0.88 and 0.96) though a small portion of protein ratios are distant to
the diagonal.
Remarks on algorithmic combinations. It is evident no single algorithmic combination can be claimed
to be the best for all the situations. Even though the two algorithmic combinations, MTQ_alg1 and MTQ_alg2,
were selected from rigorous experiments using various evaluation measures, there is no guarantee the two are
the best for other data sets. The best algorithmic combination of a given data set can be dependent on a number
of factors including instrument, spectrum quality, the complexity of samples, the definition of ratios (numera-
tors and denominators), and evaluation measures. Optimization of algorithmic combinations or providing
guidelines for the selection of quantitation algorithms for a given data set is a complicated issue and is beyond
the scope of this study. Nevertheless, compared to other tools mostly based on a fixed quantitation method, the
flexibility of Multi-Q 2 provides clear advantage in quantitation accuracy. The previous benchmark analyses
demonstrate that Multi-Q 2 can outperform existing tools with proper selection of algorithmic combinations.
Further evaluation of Multi‑Q 2 on differentially expressed proteins of Chen‑iTRAQ8. When
proteins are differentially expressed in different states, e.g., tumor vs. normal tissue samples, acquiring a list of
candidate biomarkers, namely, proteins of high fold changes across different states, is usually crucial for further
biological discovery. Thus in this subsection, we further use Chen-iTRAQ8 to evaluate different algorithmic
combinations of Multi-Q 2 in search of differentially expressed (temperature-dependent) proteins, which are
defined as proteins with at least a ratio above 1.5 (see Supplementary Text S1 for more details).
A total of 1,064 proteins are quantifiable (without missing value in any reporter ion) by Multi-Q 2. Twelve
algorithmic combinations of six protein ratio calculation methods used for NCI-7 with RCC enabled and disa-
bled are used to analyze Chen-iTRAQ8 for finding temperature-dependent proteins. Normalization is applied
at reporter ion level. The number of temperature-dependent proteins of these methods are shown in Supple-
mentary Fig. S7. It can be seen that enabling RCC increases the number of temperature-dependent proteins
regardless of the quantitation algorithms, since more protein ratios are pulled away from 1 and more proteins
satisfy the criterion of temperature-dependent protein. SumPsmIntensity and WeightedPsmRatio outnumber
others significantly, suggesting that they may be more sensitive but, on the other hand, are likely to produce
more false positives as well.
We then evaluated the similarity of two lists of temperature-dependent proteins obtained from any pair of the
six algorithmic combinations with RCC enabled by Jaccard i ndex51, defined as the size of the intersection divided
by the size of the union of the two lists. The results are illustrated in Fig. 5. It is observed that WeightedPsmRatio
shares a high similarity of 0.94 with SumPsmIntensity, but a much lower similarity of 0.72 with MedianPsmRatio.
In contrast, MedianPsmRatio shares a high similarity of 0.91 with TrimmedMeanPsmRatio. The results are logical
because both WeightedPsmRatio and SumPsmIntensity tend to assign higher weights for PSMs of larger reporter
ion intensities for calculating protein ratios. In contrast, both MedianPsmRatio and TrimmedMeanPsmRatio
tend to eliminate outliers of PSM ratios without considering the weight of a PSM. Since different algorithmic
combinations can yield quite different lists of candidate biomarkers and from our previous analyses there is still
no single algorithmic combination that outperforms others in all evaluation measures under all the circum-
stances, it is suggested that users apply simultaneously algorithmic combinations of complementary rationales,
for example, WeightedPsmRatio and MedianPsmRatio, while searching for biomarkers. The union of candidate
biomarker lists from complementary algorithmic combinations can be considered to improve sensitivity. On the
other hand, considering the common proteins from candidate biomarker lists of complementary algorithmic
combinations and ignoring the rest can possibly improve precision.
Furthermore, examining the pairwise similarity of algorithmic combinations with RCC disabled, we observed
overall decreases (ranging from 0.01 to 0.1) in all the pairwise similarities except for SumPsmIntensity vs Weight-
edPsmRatio, as illustrated in Supplementary Fig. S8. For example, the pairwise similarity between Trimmed-
MeanPsmRatio and WeightedPsmRatio decreases from 0.72 to 0.62 when disabling RCC. Supplementary Fig. S9
Scientific Reports | (2021) 11:2233 | https://doi.org/10.1038/s41598-021-81740-4 9
Vol.:(0123456789)www.nature.com/scientificreports/
Figure 5. Pairwise similarities of (potential) temperature-dependent proteins between the 6 algorithmic
combinations with RCC. Deep color indicates higher similarity. MedPep-LinReg stands for MedianPepRatio-
LinearRegression; WgtPep-WgtPsm stands for WeightedPepRatio-WeightedPsmRatio; WgtPsm stands for
WeightedPsmRatio; MedPsm stands for MedianPsmRatio; TrMeanPsm stands for TrimmedMeanPsmRatio;
SumPsmInten stands for SumPsmIntensity.
shows the Venn diagrams of these two algorithms with RCC enabled (Supplementary Fig. S9A) and disabled
(Supplementary Fig. S9B). It can be observed that the number of overlapping temperature-dependent proteins
increases from 378 to 469 (around 24% increase) when RCC is enabled. The phenomenon indicates that enabling
RCC in general yields more consistency, namely, higher Jaccard index, among different quantitation algorithms.
In addition, as shown above, RCC can increase the number of proteins of fold changes above 1.5. These observa-
tions suggest that RCC can be useful in searching for proteins of significant fold changes.
Graphical user interfaces of Multi‑Q 2. Multi-Q 2 was implemented with Visual Studio C# and can be
run on the Windows platforms (Windows 7, 8, and 10; Windows Server 2008, 2012, and 2016) with a prerequi-
site of .net framework 4.0 or newer versions. A quantitation wizard, as shown in Supplementary Fig. S10, pro-
vides step-by-step procedures for users to set up parameters and input files for quantitation. Quantitation results
are displayed in the main window of Multi-Q 2 as illustrated in Supplementary Fig. S11.
In addition to the main window, Multi-Q 2 supports a heatmap module, through which users can cluster
proteins of similar ratios using different clustering algorithms—hierarchical clustering, K-means, and fuzzy
C-means—based on different distance measures—Euclidean distance, Manhattan distance, Pearson’s correla-
tion coefficient, and covariance. An example of heatmap is illustrated in Supplementary Fig. S12. Multi-Q 2
can summarize distributions of reporter ion intensities from the identified PSMs as boxplots illustrated in
Supplementary Fig. S13A, or as bar charts illustrated in Supplementary Fig. S13B. Similarly, it can summarize
distributions of protein ratios as a boxplot illustrated in Supplementary Fig. S14A, or as a bar chart illustrated
in Supplementary Fig. S14B.
Conclusion
We present Multi-Q 2, a versatile software tool for isobaric labeling quantitation. Multi-Q 2 supports identifica-
tion results from TPP, PeptideShaker, and Proteome Discoverer, offering up to 12% improvement in coverage
compared with MaxQuant and PatternLab. Multi-Q 2 is implemented with popular quantitation, normalization,
and ratio compression correction algorithms, supporting up to 336 algorithmic combinations. Our benchmark
analyses show that Multi-Q 2 is capable of generating the largest quantitation coverage and improved quantita-
tion accuracy compared with state-of-the-art software solutions. More importantly, we show that there is still
no single algorithmic combination that outperforms others in all evaluation measures under all circumstances.
It is therefore beneficial for a software tool to provide the flexibility of customizing quantitation algorithms. We
further demonstrate that using algorithmic combinations of complementary rationale simultaneously in search
of candidate biomarkers can be a reasonable strategy to improve either sensitivity or precision. Multi-Q 2 is a
standalone and installation-free Windows program. It provides friendly graphical interfaces for users to perform
quantitation and follow-up analysis, such as clustering and heatmap visualization. We believe that Multi-Q 2 can
be of great help in searching for potential biomarkers from complex proteomic samples.
Data availability
Multi-Q 2 executable files, sample data sets, and user manual are freely available at http://ms.iis.sinica.edu.tw/
COmics/Software_Multi-Q2.html.
Received: 10 December 2020; Accepted: 6 January 2021
References
1. Domon, B. & Aebersold, R. Mass spectrometry and protein analysis. Science 312, 212–217 (2006).
2. Ross, P. L. et al. Multiplexed protein quantitation in Saccharomyces cerevisiae using Amine-reactive isobaric tagging reagents. Mol.
Cell. Proteomics 3, 1154–1169 (2004).
3. Thompson, A. et al. Tandem mass tags: a novel quantification strategy for comparative analysis of complex protein mixtures by
MS/MS. Anal. Chem. 75, 1895–1904 (2003).
4. Ellis, M. J. et al. Connecting genomic alterations to cancer biology with proteomics: the NCI Clinical Proteomic Tumor Analysis
Consortium. Cancer Discov. 3, 1108–1112 (2013).
5. Edwards, N. J. et al. The CPTAC data portal: a resource for cancer proteomics research. J. Proteome Res. 14, 2707–2713 (2015).
Scientific Reports | (2021) 11:2233 | https://doi.org/10.1038/s41598-021-81740-4 10
Vol:.(1234567890)www.nature.com/scientificreports/
6. Arntzen, M. Ø. et al. IsobariQ: software for isobaric quantitative proteomics using IPTL, iTRAQ, and TMT. J. Proteome Res. 10,
913–920 (2011).
7. Muth, T. et al. jTraqX: A free, platform independent tool for isobaric tag quantitation at the protein level. Proteomics 10, 1223–1225
(2010).
8. Tyanova, S., Temu, T. & Cox, J. The MaxQuant computational platform for mass spectrometry-based shotgun proteomics. Nat.
Protoc. 11, 2301–2319 (2016).
9. Carvalho, P. C. et al. Integrated analysis of shotgun proteomic data with PatternLab for proteomics 4.0. Nat. Protoc. 11, 102–117
(2016).
10. Wang, P., Yang, P. & Yang, J. Y. H. OCAP: an open comprehensive analysis pipeline for iTRAQ. Bioinformatics 28, 1404–1405
(2012).
11. Cox, J. et al. Andromeda: a peptide search engine integrated into the MaxQuant environment. J. Proteome Res. 10, 1794–1805
(2011).
12. Eng, J. K., Jahan, T. A. & Hoopmann, M. R. Comet: an open-source MS/MS sequence database search tool. Proteomics 13, 22–24
(2013).
13. Craig, R. & Beavis, R. C. TANDEM: matching proteins with tandem mass spectra. Bioinformatics 20, 1466–1467 (2004).
14. Shteynberg, D., Nesvizhskii, A. I., Moritz, R. L. & Deutsch, E. W. Combining results of multiple search engines in proteomics. Mol.
Cell. Proteomics 12, 2383–2393 (2013).
15. Li, H. et al. Estimating influence of cofragmentation on peptide quantification and identification in iTRAQ experiments by simu-
lating multiplexed spectra. J. Proteome Res. 13, 3488–3497 (2014).
16. Karp, N. A. et al. Addressing accuracy and precision issues in iTRAQ quantitation. Mol. Cell. Proteomics 9, 1885–1897 (2010).
17. Zou, X. et al. MilQuant: a free, generic software tool for isobaric tagging-based quantitation. J. Proteomics 75, 5516–5522 (2012).
18. Boehm, A. M., Pütz, S., Altenhöfer, D., Sickmann, A. & Falk, M. Precise protein quantification based on peptide quantification
using iTRAQTM. BMC Bioinform. 8, 214 (2007).
19. Fischer, M. & Renard, B. Y. iPQF: a new peptide-to-protein summarization method using peptide spectra characteristics to improve
protein quantification. Bioinformatics 32, 1040–1047 (2016).
20. Wen, B. et al. IQuant: an automated pipeline for quantitative proteomics based upon isobaric tags. Proteomics 14, 2280–2285
(2014).
21. Onsongo, G. et al. LTQ-iQuant: a freely available software pipeline for automated and accurate protein quantification of isobaric
tagged peptide data from LTQ instruments. Proteomics 10, 3533–3538 (2010).
22. Cox, J. & Mann, M. MaxQuant enables high peptide identification rates, individualized p.p.b.-range mass accuracies and proteome-
wide protein quantification. Nat. Biotechnol. 26, 1367–1372 (2008).
23. Lin, W.-T. et al. Multi-Q: a fully automated tool for multiplexed protein quantitation. J. Proteome Res. 5, 2328–2338 (2006).
24. Zhou, C. et al. A hierarchical statistical modeling approach to analyze proteomic isobaric tag for relative and absolute quantitation
data. Bioinformatics 30, 549–558 (2014).
25. Gatto, L. & Lilley, K. S. MSnbase-an R/Bioconductor package for isobaric tagged mass spectrometry data visualization, processing
and quantitation. Bioinformatics 28, 288–289 (2012).
26. Rauniyar, N. & Yates, J. R. Isobaric labeling-based relative quantification in shotgun proteomics. J. Proteome Res. 13, 5293–5309
(2014).
27. Christoforou, A. L. & Lilley, K. S. Isobaric tagging approaches in quantitative proteomics: the ups and downs. Anal. Bioanal. Chem.
404, 1029–1037 (2012).
28. Ow, S. Y. et al. iTRAQ underestimation in simple and complex mixtures: ‘the good, the bad and the ugly’. J. Proteome Res. 8,
5347–5355 (2009).
29. Sandberg, A., Branca, R. M. M., Lehtiö, J. & Forshed, J. Quantitative accuracy in mass spectrometry based proteomics of complex
samples: the impact of labeling and precursor interference. J. Proteomics 96, 133–144 (2014).
30. Ting, L., Rad, R., Gygi, S. P. & Haas, W. MS3 eliminates ratio distortion in isobaric multiplexed quantitative proteomics. Nat.
Methods 8, 937–940 (2011).
31. McAlister, G. C. et al. MultiNotch MS3 enables accurate, sensitive, and multiplexed detection of differential expression across
cancer cell line proteomes. Anal. Chem. 86, 7150–7158 (2014).
32. Roumeliotis, T. I., Weisser, H. & Choudhary, J. S. Evaluation of a dual isolation width acquisition method for isobaric labeling ratio
decompression. J. Proteome Res. 18, 1433–1440 (2019).
33. Savitski, M. M. et al. Measuring and managing ratio compression for accurate iTRAQ/TMT quantification. J. Proteome Res. 12,
3586–3598 (2013).
34. Deutsch, E. W. et al. A guided tour of the trans-proteomic pipeline. Proteomics 10, 1150–1159 (2010).
35. Deutsch, E. W. et al. Trans-proteomic Pipeline, a standardized data processing pipeline for large-scale reproducible proteomics
informatics. Proteomics Clin. Appl. 9, 745–754 (2015).
36. Vaudel, M. et al. PeptideShaker enables reanalysis of MS-derived proteomics data sets. Nat. Biotechnol. 33, 22–24 (2015).
37. Elias, J. E. & Gygi, S. P. Target-decoy search strategy for increased confidence in large-scale protein identifications by mass spec-
trometry. Nat. Methods 4, 207–214 (2007).
38. Gatto, L. & Christoforou, A. Using R and bioconductor for proteomics data analysis. Biochim. Biophys. Acta BBA Prot. Proteomics
1844, 42–51 (2014).
39. Hultin-Rosenberg, L., Forshed, J., Branca, R. M. M., Lehtiö, J. & Johansson, H. J. Defining, comparing, and improving iTRAQ
quantification in mass spectrometry proteomics data. Mol. Cell. Proteomics 12, 2021–2031 (2013).
40. Clark, D. J. et al. Evaluation of NCI-7 cell line panel as a reference material for clinical proteomics. J. Proteome Res. 17, 2205–2215
(2018).
41. Chen, Z. et al. Quantitative proteomics reveals the temperature-dependent proteins encoded by a series of cluster genes in Ther-
moanaerobacter Tengcongensis. Mol. Cell. Proteomics 12, 2266–2277 (2013).
42. Vaudel, M., Barsnes, H., Berven, F. S., Sickmann, A. & Martens, L. SearchGUI: an open-source graphical user interface for simul-
taneous OMSSA and X!Tandem searches. Proteomics 11, 996–999 (2011).
43. Tabb, D. L., Fernando, C. G. & Chambers, M. C. MyriMatch: highly accurate tandem mass spectral peptide identification by
multivariate hypergeometric analysis. J. Proteome Res. 6, 654–661 (2007).
44. Geer, L. Y. et al. Open mass spectrometry search algorithm. J. Proteome Res. 3, 958–964 (2004).
45. Diament, B. J. & Noble, W. S. Faster SEQUEST searching for peptide identification from tandem mass spectra. J. Proteome Res. 10,
3871–3879 (2011).
46. Kim, S. & Pevzner, P. A. MS-GF+ makes progress towards a universal database search tool for proteomics. Nat. Commun. 5, 5277
(2014).
47. Keller, A., Nesvizhskii, A. I., Kolker, E. & Aebersold, R. Empirical statistical model to estimate the accuracy of peptide identifica-
tions made by MS/MS and database search. Anal. Chem. 74, 5383–5392 (2002).
48. Shteynberg, D. et al. iProphet: multi-level integrative analysis of shotgun proteomic data improves peptide and protein identifica-
tion rates and error estimates. Mol. Cell. Proteomics 10, M111.007690 (2011).
49. Reiter, L. et al. Protein identification false discovery rates for very large proteomics data sets generated by tandem mass spectrom-
etry. Mol. Cell. Proteomics 8, 2405–2417 (2009).
Scientific Reports | (2021) 11:2233 | https://doi.org/10.1038/s41598-021-81740-4 11
Vol.:(0123456789)You can also read