Seismic evidence of the COVID-19 lockdown measures: a case study from eastern Sicily (Italy) - Solid Earth
←
→
Page content transcription
If your browser does not render page correctly, please read the page content below
Solid Earth, 12, 299–317, 2021
https://doi.org/10.5194/se-12-299-2021
© Author(s) 2021. This work is distributed under
the Creative Commons Attribution 4.0 License.

Seismic evidence of the COVID-19 lockdown measures:
a case study from eastern Sicily (Italy)
Andrea Cannata1,2 , Flavio Cannavò2 , Giuseppe Di Grazia2 , Marco Aliotta2 , Carmelo Cassisi2 ,
Raphael S. M. De Plaen3 , Stefano Gresta1 , Thomas Lecocq4 , Placido Montalto2 , and Mariangela Sciotto2
1 Dipartimento di Scienze Biologiche, Geologiche e Ambientali, Università degli Studi di Catania, Catania, Italy
2 Istituto
         Nazionale di Geofisica e Vulcanologia, Osservatorio Etneo, Catania, Italy
3 Centro de Geociencias, Universidad Nacional Autónoma de México, Campus Juriquilla, Querétaro, Mexico
4 Seismology-Gravimetry, Royal Observatory of Belgium, Avenue circulaire 3, 1180 Brussels, Belgium

Correspondence: Andrea Cannata (andrea.cannata@unict.it)

Received: 6 August 2020 – Discussion started: 16 September 2020
Revised: 4 December 2020 – Accepted: 16 December 2020 – Published: 2 February 2021

Abstract. During the COVID-19 pandemic, most countries           1   Introduction
put in place social interventions, restricting the mobility of
citizens, to slow the spread of the epidemic. Italy, the first
European country severely impacted by the COVID-19 out-          During the end of 2019, several cases of pneumonia, due to
break, applied a sequence of progressive restrictions to re-     the novel coronavirus SARS-CoV-2, were identified in the
duce human mobility from the end of February to mid-             city of Wuhan, China (Wang et al., 2020a). The disease due to
March 2020. Here, we analysed the seismic signatures of          this coronavirus, called COVID-19, then rapidly spread from
these lockdown measures in densely populated eastern Sicily,     China to other areas, as a pandemic wave (as declared by
characterized by the presence of a permanent seismic net-        the World Health Organization, WHO, in March 2020) cur-
work used for earthquake and volcanic monitoring. We em-         rently affecting 216 countries with almost 14 300 000 con-
phasize how the anthropogenic seismic noise decrease is vis-     firmed cases (at the time of writing 21 July 2020; WHO,
ible even at stations located in remote areas (Etna and Aeo-     2020). COVID-19 is considered the most severe global health
lian Islands) and that the amount of this reduction (reaching    crisis of our time and the greatest challenge human beings
∼ 50 %–60 %), its temporal pattern and spectral content are      have faced since World War II (WHO, 2020).
strongly station-dependent. Concerning the latter, we showed        While huge efforts are being made to find pharmacologi-
that on average the frequencies above 10 Hz are the most in-     cal cures to heal the sick and to stop the spread of the dis-
fluenced by the anthropogenic seismic noise. We found simi-      ease (e.g. Cannata et al., 2020a; Graham, 2020; Wang et al.,
larities between the temporal patterns of anthropogenic seis-    2020b), most countries worldwide have put in place social
mic noise and human mobility, as quantified by the mobile-       interventions, consisting of restricting the mobility of citi-
phone-derived data shared by Google, Facebook and Apple,         zens, aimed at slowing and mitigating the epidemic (Pepe
as well as by ship traffic data. These results further confirm   et al., 2020). Italy was the first country in Europe to be
how seismic data, routinely acquired worldwide for seismic       severely impacted by the COVID-19 pandemic wave at the
and volcanic surveillance, can be used to monitor human mo-      end of February and the beginning of March 2020. Hence,
bility too.                                                      Italy was also the first European country to apply a sequence
                                                                 of progressive restrictions to reduce both human mobility
                                                                 and human-to-human contacts. Restrictions were first imple-
                                                                 mented on 23 February 2020 in some regions of northern
                                                                 Italy (Lombardy, Emilia–Romagna, Veneto, Friuli Venezia
                                                                 Giulia, Piedmont, and the Autonomous Province of Trento).
                                                                 On 11 March, the entire country was put under lockdown

Published by Copernicus Publications on behalf of the European Geosciences Union.
300                                               A. Cannata et al.: Seismic evidence of the COVID-19 lockdown measures

(Gatto et al., 2020) until May, when the restrictions were
gradually lifted.
   To provide information about the effectiveness of the quar-
antine measures during the COVID-19 emergency, Apple,
Facebook and Google made available mobility data, mostly
based on mobile-phone locations, for almost every country
in the world (Apple, 2020; Facebook, 2020; Google, 2020).
At the same time, different studies showed the effective-
ness of seismic noise monitoring as a tool to quantify hu-
man activity and its changes over time (Dias et al., 2020;
Hong et al., 2020; Lindsey et al., 2020; Lecocq et al., 2020;
Poli et al., 2020). Indeed, the Earth is continuously vibrating
due to a wide spectrum of elastic energy sources including
tectonic forces (Stein and Wysession, 2003), volcanic pro-
cesses (Chouet and Matoza, 2013), the ocean (Cannata et
al., 2020b) and human (Diaz et al., 2017) activity. As for
the last point, it typically generates a high-frequency contin-
uous signal (>1 Hz), called anthropogenic or cultural seis-
mic noise, associated with phenomena such as traffic, con-
struction, industrial operations and mining (Diaz et al., 2017;
Hong et al., 2020). Recent papers identified clear seismic        Figure 1. Map of eastern Sicily with the location of the seismic
signatures of the lockdown measures applied by different          stations (red triangles) used in this work. The top left panel shows
                                                                  where the area is located in Italy. The map was drawn by using
countries (Lindsey et al., 2020; Lecocq et al., 2020; Pic-
                                                                  NASA Shuttle Radar Topography Mission (SRTM) data and the
cinini et al., 2020; Poli et al., 2020; Xiao et al., 2020). For   readhgt.m Matlab® function (Beauducel, 2020).
instance, Lindsey et al. (2020) showed a 50 % decrease in
vehicle count in the Palo Alto area (California) immediately
following the lockdown order by using fibre-optic distributed     network, run by Istituto Nazionale di Geofisica e Vulcanolo-
acoustic sensing connected to a telecommunications cable.         gia, Osservatorio Etneo (INGV-OE) (Table 1, Figs. 1 and A1
Lecocq et al. (2020) performed a global-scale analysis of an-     in Appendix). These stations, selected both for the good data
thropogenic seismic noise using hundreds of seismometers          continuity and the even spatial distribution on the investi-
located around the world, which evidenced how the 2020            gated area, are equipped with broadband (40 s cutoff period),
lockdown period has produced the longest and most dramatic        three-component Trillium Nanometrics™ seismometers, ac-
global anthropogenic seismic noise reduction on record. Poli      quiring at a sampling rate of 100 Hz. The stations are in-
et al. (2020) and Piccinini et al. (2020) analysed the anthro-    stalled in shallow vaults (depth ∼ 1.5 m) made of concrete,
pogenic seismic noise reduction following the lockdown for        and show very different site conditions in terms of possible
the area of northern Italy and its socio-economic implica-        sources of anthropogenic seismic noise; some are close to
tions.                                                            towns, highways or industrial plants, others near agricultural
   In this work, we analyse the seismic signatures of the lock-   areas, and yet others in small islands or on the flanks of the
down measures in highly populated eastern Sicily (Italy),         Mt Etna volcano (see Table 1). The analysed time interval
which benefits from the presence of a dense permanent seis-       was 1 November 2019–23 May 2020.
mic network used for both seismic and volcanic monitoring.
Hence, this is the first study to show the effects of uniform     2.2   Spectral and amplitude analysis
lockdown measures in the seismic noise acquired by such a
dense seismic network. In particular, we investigate the de-      Both spectral and amplitude analyses were carried out to
crease in the anthropogenic seismic noise amplitude, charac-      characterize the temporal variations in the seismic noise fea-
terize its spectral content and compare the observed changes      tures. As for the former, the daily spectra of the vertical
with mobility data.                                               component of the seismic signal were calculated by using
                                                                  Welch’s method (Welch, 1967) with windows of 81.92 s. All
                                                                  the daily spectra were gathered and visualized as spectro-
2     Materials and methods                                       grams, with time on the x axis, frequency on the y axis
                                                                  and power spectral density (PSD) indicated by a colour scale
2.1    Data                                                       (Fig. 2). It is worth noting that the sharp decrease in the spec-
                                                                  tral amplitude, evident at frequencies above 40 Hz, is due to
The seismic data were recorded by 18 stations, located on the     the digitizer anti-aliasing filter. Hence, the following analy-
eastern part of Sicily and belonging to the seismic permanent     ses have been performed at frequencies up to 40 Hz.

Solid Earth, 12, 299–317, 2021                                                          https://doi.org/10.5194/se-12-299-2021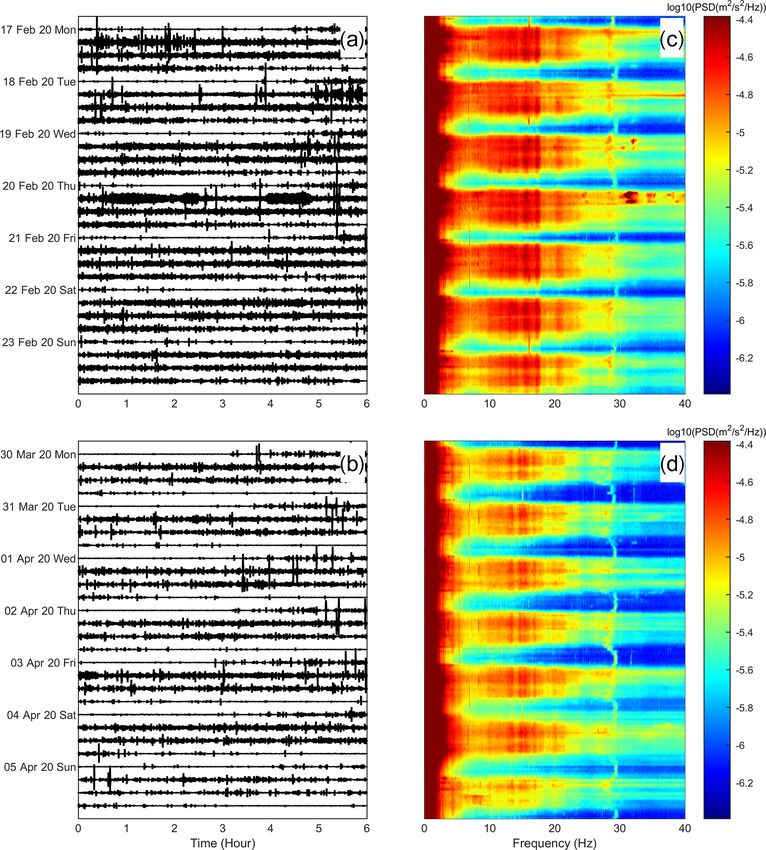
A. Cannata et al.: Seismic evidence of the COVID-19 lockdown measures                                                                          301

Table 1. List of the seismic stations used in this work, with information about location and site conditions in terms of possible sources of
anthropogenic seismic noise.

     Station name    Latitude (◦ )   Longitude (◦ )   Altitude (m a.s.l.)    Site conditions
     AIO                 37.9713           15.233                   794      close to small towns and a few roads
     CAGR                 37.622          14.4999                   548      close to small towns, a few roads and agricultural areas
     EFIU                37.7896          15.2103                    97      close to towns, roads and highway
     EMFS                37.7196          14.9979                  2507      on the flank of Mt Etna, close to country roads
     ESAL                37.7551          15.1345                   768      close to small towns and a few roads
     ESML                37.6181          14.8794                   408      close to towns and roads
     ESPC                37.6925          15.0274                  1655      on the flank of Mt Etna, close to country roads
     HAGA                37.2858          15.1552                   176      close to town, roads and industrial plants
     HLNI                37.3486          14.8719                   133      close to towns, roads, agricultural areas and industrial plants
     HPAC                36.7085          15.0372                    70      close to small towns, roads and agricultural areas
     HSRS                37.0928           15.222                   100      close to towns, roads, highway and industrial plants
     IFIL                38.5642          14.5753                   269      on an island, close to a port
     ILLI                38.4457          14.9482                   277      on an island, close to a port
     ISTR                38.7867          15.1918                   114      on an island, close to a port
     IVCR                38.4096           14.961                   172      on an island, close to a port
     MSFR                38.0339          14.5916                   723      close to small towns and a few roads
     MSRU                38.2639          15.5083                   401      close to small towns and a few roads
     MUCR                 38.043          14.8739                  1042      close to small towns and a few roads

   Concerning the amplitude analysis, the time series of the                2.3   Comparison with mobility data
root mean square (rms) amplitude of the seismic signal, fil-
tered in the band 10–40 Hz, were obtained on 15 min long                    Google, Apple and Facebook made human mobility data
sliding windows (Fig. 3). This frequency band was chosen                    available for almost every country worldwide as support for
because, as will be shown in Sect. 3, it is the most influenced             public health policy during the COVID-19 crisis. For our
band by the anthropogenic seismic noise. To visually show                   study area, Google and Facebook provided aggregated data
the general temporal pattern of the seismic noise amplitude                 for the Sicily region and Apple shared data for Catania,
in eastern Sicily, the rms amplitude time series were averaged              which is the main city in eastern Sicily (Fig. 1). The Google
on 3 d long sliding windows, normalized, gathered and repre-                community mobility corresponds to the percentage of change
sented by a coloured checkerboard plot (Fig. 4). To make the                relative to a baseline defined as the median value of the cor-
changes in the noise background level as clear as possible in               responding day of the week, during the period 3 January–
the checkerboard plot, the normalization was performed by                   6 February 2020. The data are structured in categories to
(i) setting all the values greater than the 90th percentile equal           group some of the places with similar characteristics: gro-
to the 90th percentile, (ii) subtracting the minimum value and              cery stores and pharmacies, parks, transit stations, retail and
(iii) dividing by the maximum value. In addition, the percent-              recreation places, and residences and workplaces (Google,
age change in seismic rms amplitude in the band 10–40 Hz in                 2020). Apple shared information about the percent change
the period 11 March–11 April 2020 was calculated by using                   in the public’s walking and driving compared with the base-
the rms amplitude during 20 January–20 February 2020 as a                   line value from the 13 January (Apple, 2020). Finally, Face-
baseline (Fig. 5).                                                          book provided data regarding the human movement percent
   Finally, to highlight the frequency band showing the most                changes measured throughout March, April and May 2020
evident amplitude changes due to the lockdown, two 20 d                     relative to a baseline value in February (Facebook, 2020).
long time windows, extracted before (1–20 February) and                        To understand how much the seismic noise could reflect
during (11 March–1 April) the lockdown, were considered.                    society’s mobility level, a preliminary visual comparison be-
Two average spectra, representing the seismic spectral con-                 tween time series of the seismic rms amplitude and the cor-
tent before and during the lockdown, were computed on the                   responding above-mentioned community mobility data was
two windows, and, successively, a ratio between them was                    performed (Fig. 9a). Then, to quantify the similarity, a cor-
calculated (Figs. 6 and 7). All the ratios were stacked and the             relation analysis was performed. In place of using the more
result is shown in Fig. 8.                                                  common Pearson correlation coefficient, we made use of the
                                                                            Spearman correlation coefficient, allowing us to compare se-
                                                                            ries which do not have a normal distribution and to explore
                                                                            nonlinear relationships (e.g. Craig et al., 2016; Cannata et al.,
                                                                            2019). To identify the frequencies that better correlate with

https://doi.org/10.5194/se-12-299-2021                                                                     Solid Earth, 12, 299–317, 2021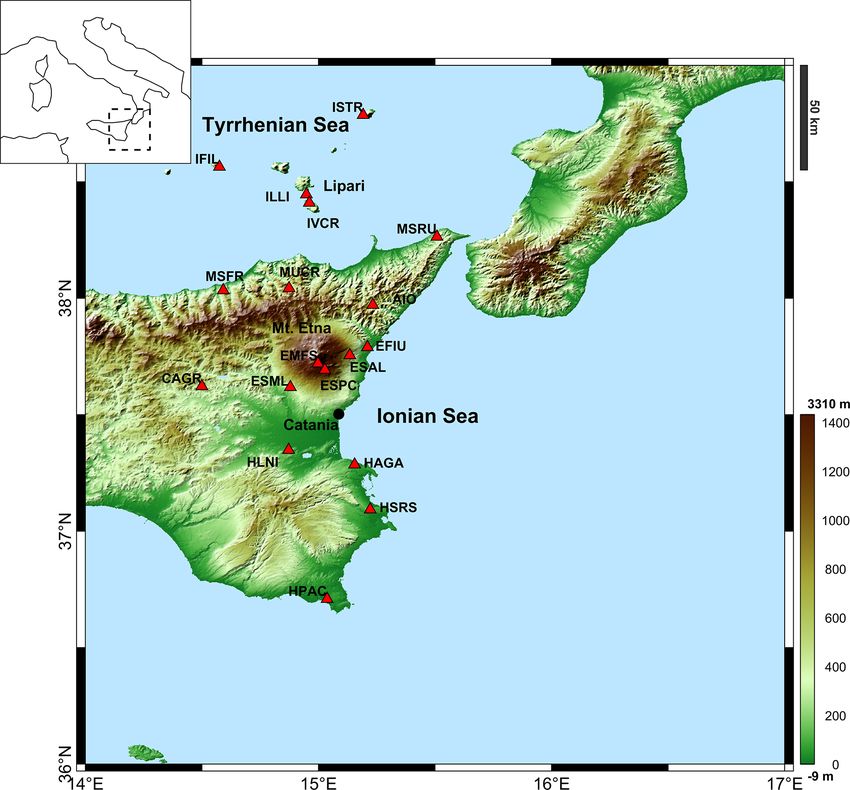
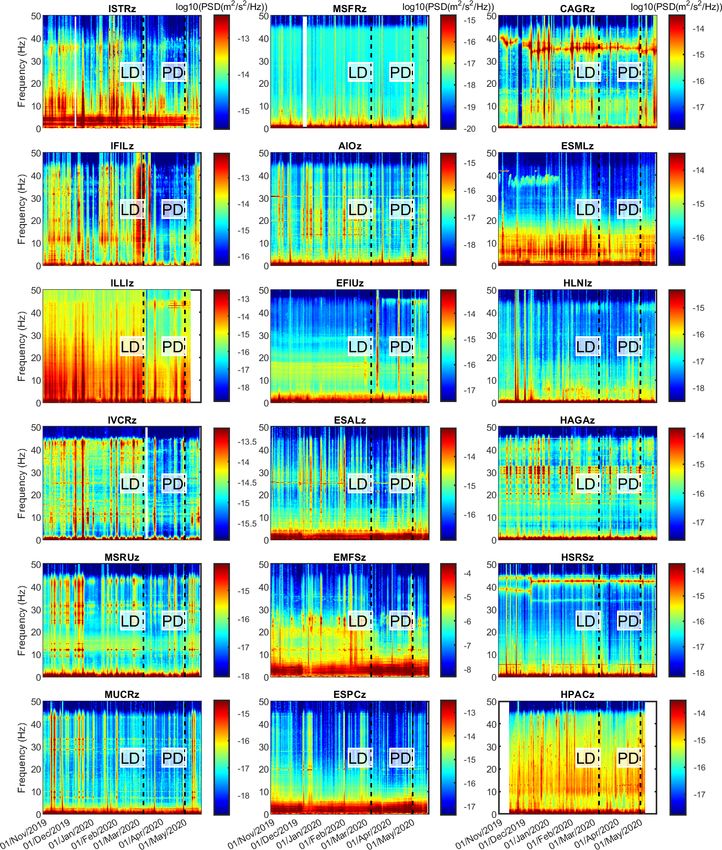
302                                                   A. Cannata et al.: Seismic evidence of the COVID-19 lockdown measures

Figure 2. Spectrograms of the vertical component of the seismic signals. The vertical dashed lines and the labels “LD” and “PD” indicate
the times when the national lockdown measures were implemented in Italy (11 March 2020) and when the first presidential decree, slightly
lifting the lockdown measures, was issued (4 May 2020), respectively. The stations are sorted by decreasing latitude from upper left to bottom
right.

the human mobility data, we performed the correlation anal-              ficients of all the stations per each frequency band (Fig. 9b).
ysis between all the time series of seismic rms amplitudes,              In addition, to show how the correlation changes at the differ-
filtered in narrow bands (bandwidth: 1 Hz, fourth-order But-             ent considered stations, the Spearman correlation coefficient
terworth filter; Lyons, 2004) around the integer frequencies             was calculated between the seismic rms amplitude time se-
between 1 and 40 Hz, and the community mobility datasets                 ries of each station in the 10–40 Hz range and the community
provided by Google, Apple and Facebook. Successively, we                 mobility datasets (Fig. 10). To verify if the obtained Spear-
computed an average value of the Spearman correlation coef-              man correlation coefficients are significantly different from

Solid Earth, 12, 299–317, 2021                                                                  https://doi.org/10.5194/se-12-299-2021
A. Cannata et al.: Seismic evidence of the COVID-19 lockdown measures                                                                   303

Figure 3. Rms amplitude time series of the vertical component of the seismic signals, filtered in the band 10–40 Hz (grey line), and corre-
sponding moving median computed on 1 d long sliding windows (thick black line). The vertical dashed lines and the labels “LD” and “PD”
indicate the times when the national lockdown measures were implemented in Italy (11 March 2020) and when the first presidential decree,
slightly lifting the lockdown measures, was issued (4 May 2020), respectively. The stations are sorted by decreasing latitude from upper left
to bottom right.

zero or not (null hypothesis), the t test was performed and              as well as each boat category (passenger, high-speed, tanker,
the p value (probability value) was calculated (Fig. A3). P              cargo and yacht) and their gross tonnage. All these data were
values lower than the significance level of 0.05 were con-               compared with the seismic rms amplitude time series of ILLI
sidered sufficient to reject the null hypothesis. Such a value,          station in the 10–40 Hz band again by Spearman correlation
which means that the probability that the result of the statisti-        coefficient (Fig. 11a–d). As the only parameters showing p
cal test is due to chance alone is less than 5 %, is a commonly          values lower than 0.05 were the overall daily gross tonnage
accepted threshold for this statistical test (e.g. Anthony et al.,       and the daily number of port calls of tankers, the frequency
2017).                                                                   dependence analysis shown above was repeated on these two
   In addition, since some seismic stations are located on the           time series (Fig. 11e).
Aeolian Islands (ISTR, IFIL, ILLI, IVCR), we took into ac-
count ship traffic data from Lipari port (∼ 2.7 km from ILLI
station; see Fig. 1), provided by FleetMon, containing infor-
mation about the daily number of port calls of all the boats,

https://doi.org/10.5194/se-12-299-2021                                                                  Solid Earth, 12, 299–317, 2021
304 A. Cannata et al.: Seismic evidence of the COVID-19 lockdown measures
3 Results and discussion
The seismic data, collected by 18 stations located in eastern
Sicily during 1 November 2019–23 May 2020, were anal-
ysed. The spectrograms show a wide variety of spectral fea-
tures and their variability over time (Fig. 2). Some stations
show broad spectra with significant amplitude up to 30–
40 Hz (such as ISTR and IVCR) and others narrower spec-
tra with almost no energy above 10 Hz (such as MSFR and
ESPC). In addition, very stable spectral peaks are evident in
some stations (such as IVCR, ESAL and HAGA) probably
due to continuously active seismic noise sources. More in-
terestingly, a general reduction in the amplitude of seismic
noise at all the stations, even at the ones located in remote
areas such as Mt Etna’s flanks and the Aeolian Islands, is
observed following the enforcement of lockdown measures
(on 11 March 2020; Figs. 2–5). However, the amount of re-
duction, as well as the pattern of the investigated seismic
Figure 4. Temporal changes in the normalized seismic rms ampli- rms amplitude time series, varies significantly as a function
tude at 18 seismic stations sorted by decreasing latitude (see la- of the station considered. For instance, the stations located
bels on the left y axis). Data gaps are coloured white. The verti- close to towns and infrastructures, such as busy roads, high-
cal dashed lines and the labels “LD” and “PD” indicate the times ways, industrial plants and agricultural areas (EFIU, ESML,
when the national lockdown measures were implemented in Italy HSRS, HPAC; Table 1), show the typical temporal pattern
(11 March 2020) and when the first presidential decree, slightly lift- of the anthropogenic seismic noise with minima during the
ing the lockdown measures, was issued (4 May 2020), respectively.
weekends and the night-time and maxima during the week-
days and the daytime (Fig. A4; Lecocq et al., 2020; Xiao
et al., 2020). Focusing on the frequency band 10–40 Hz, the
amplitude noise reduction due to the lockdown measures
reaches ∼ 50 % at EFIU station (Fig. 5), which also shows
a slight amplitude decrease (∼ 10 %) during the Christmas–
New Year holidays. This station is close to towns and to a
busy highway called A18 (Fig. A1 and Table 1). Other sta-
tions show less regular patterns with clear peaks interspersed
throughout the time series, whose origin depends also in this
case on the station considered. In the stations located in the
Aeolian Islands (ISTR, ILLI, IVCR, IFIL), the peaks are
closely related to the ships rather than to road traffic or in-
dustrial activities (Figs. A1 and A5, Table 1). The ampli-
tude and rate of occurrence of those peaks also clearly de-
creased right after the implementation of the lockdown mea-
sures. Indeed, after March 2020 marine traffic was affected
by a dramatic decrease at the global scale, which was par-
ticularly marked in the Mediterranean Sea (March et al.,
2020; Fig. 11b–d). Overall, the reduction in seismic noise
in the band 10–40 Hz in the Aeolian Islands ranges between
∼ 40 %–50 % (Fig. 5). At stations EMFS and ESPC, located
on the flanks of Mt Etna, the anthropogenic seismic noise is
mostly related to tourist excursions, as both stations are lo-
cated close to country roads used to bring tourists to the top
of the volcano (Fig. A1 and Table 1). These excursions were
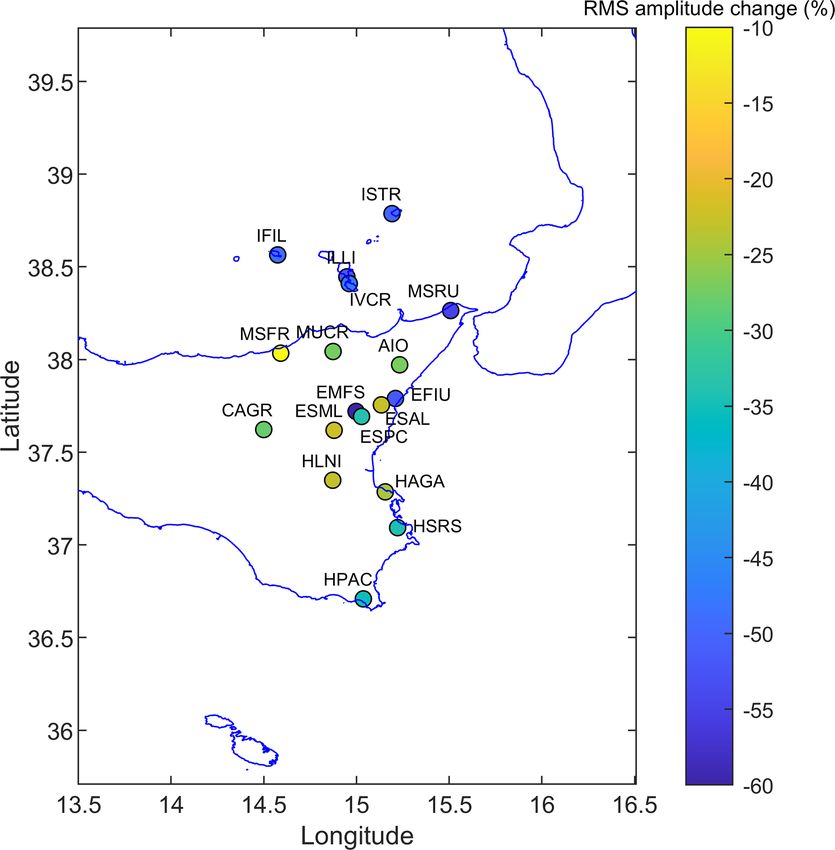
Figure 5. Percent change in seismic rms amplitude in the band 10– suspended on 9 March following the COVID-19 outbreak,
40 Hz during the period 11 March–11 April 2020 (right after the leading to a decrease in the seismic noise in the band 10–
lockdown measures entered into force) with respect to the interval 40 Hz of 30 % and 60 % for ESPC and EMFS, respectively
20 January–20 February 2020.
(Fig. 5). Some notable increases in seismic amplitudes, visi-
ble at more than one stations at the same time, are not caused
Solid Earth, 12, 299–317, 2021 https://doi.org/10.5194/se-12-299-2021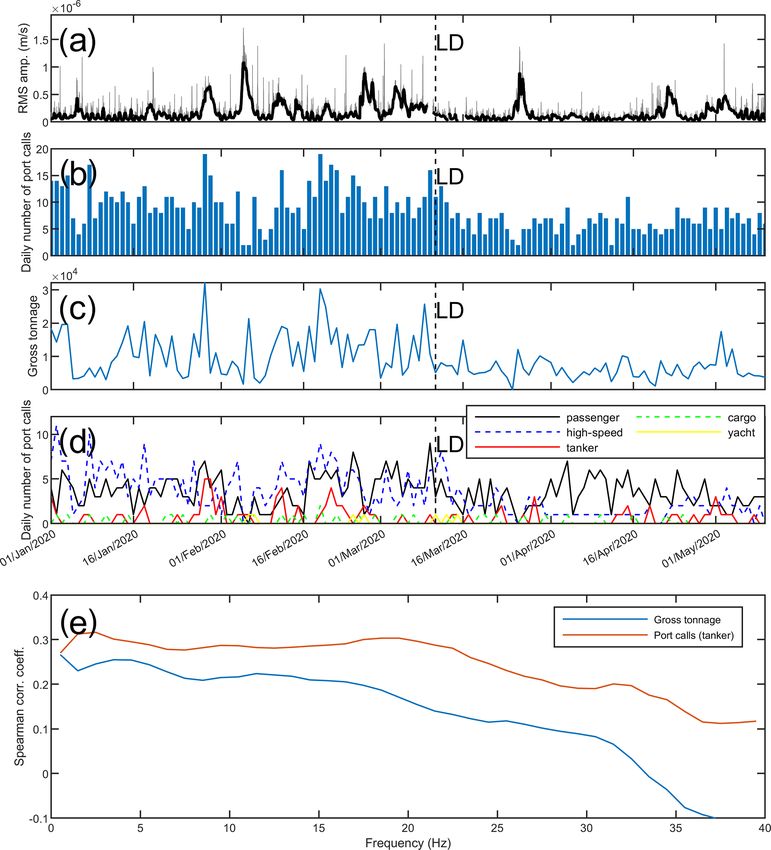
A. Cannata et al.: Seismic evidence of the COVID-19 lockdown measures                                                                  305

Figure 6. Spectra of the vertical component of the seismic signals recorded during two 20 d long time windows, extracted before (black
line; 1–20 February) and during (red line; 11 March–1 April) the lockdown. The stations are sorted by decreasing latitude from upper left to
bottom right.

by human activities but rather are due to bad weather condi-            tio value, which indicates the amount of anthropogenic noise
tions. For instance, the amplitude increase on 25–26 March,             affecting the station, shows a fairly wide variability, from 1.5
visible at almost all the stations (Figs. 2 and 3), was associ-         (i.e. ESPC, HPAC) to 6 (EMFS). It is also noteworthy that
ated with bad weather conditions, which affected the whole              some stations show a ratio lower than 1 at low frequencies
of southern Italy. The amplitude of the anthropogenic seis-             (
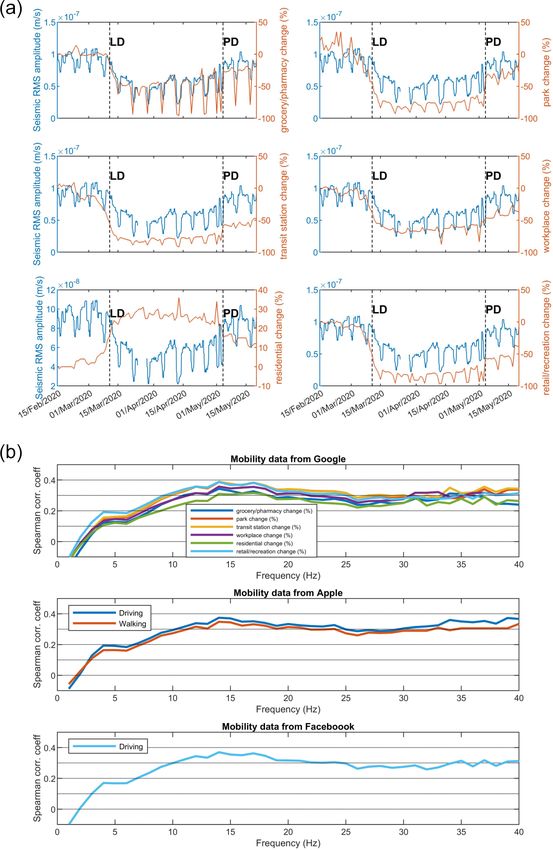
306                                                   A. Cannata et al.: Seismic evidence of the COVID-19 lockdown measures

Figure 7. Ratios between the spectra of the vertical component of the seismic signals recorded during two 20 d long time windows, extracted
before (1–20 February) and during (11 March–1 April) the lockdown (grey lines; see Fig. 6) and corresponding moving median over 0.6 Hz
(black thick line). The red horizontal dashed lines indicate ratio values equal to 1. The stations are sorted by decreasing latitude from upper
left to bottom right.

signal on Earth, generated by ocean wave energy coupled                   values range from 0.25 to more than 0.85 according to the
with the Earth’s ground (e.g. Longuet-Higgins, 1950; Hassel-              considered station and mobility parameter (Fig. 10). In par-
mann, 1963; Ardhuin et al., 2015). Finally, the spectral ratio            ticular, stations EFIU, ESML and HSRS, displaying the typi-
derived from stacking the spectral ratio plots of all the con-            cal temporal pattern of the anthropogenic seismic noise with
sidered stations clearly shows that the frequency band most               minima during the weekends and maxima during the week-
affected by the anthropogenic seismic noise (that is, the one             days, showed the highest correlation coefficients. The sim-
showing the highest ratio values) is above 10 Hz (Fig. 8).                ilarity between seismic noise and human mobility patterns
   Concerning the comparison between the time series of                   is remarkably high at station EFIU characterized by correla-
seismic noise and human mobility, these are positively corre-             tion coefficients higher than 0.8 (Figs. 9a and A2). For other
lated, suggesting that seismic noise amplitude increases with             stations (e.g. EMFS, HAGA, MUCR), the correlation is not
increasing human mobility, with the exception of the resi-                as clear. However, even if the correlation between seismic
dential visit changes provided by Google (Fig. A2). Indeed,               noise and human mobility is strongly station-dependent, p
this category quantifies the change in duration of time spent             values lower than 0.05 were obtained in all the comparisons
at places of residence, which, unlike the other categories,               (Fig. A3), suggesting how the obtained Spearman correlation
increased during the lockdown period. We obtained a wide                  coefficients are significantly different from zero. This con-
range of Spearman correlation coefficients, whose absolute                firms that seismic data from all the considered stations con-

Solid Earth, 12, 299–317, 2021                                                                  https://doi.org/10.5194/se-12-299-2021
A. Cannata et al.: Seismic evidence of the COVID-19 lockdown measures                                                              307

                                                                       of (i) the increase in seismic noise amplitude, observed again
                                                                       at the end of April, and (ii) the correlation analysis results,
                                                                       which confirm how the amplitude reduction in mid-March is
                                                                       related to the decrease in human mobility.

                                                                       4   Conclusions

                                                                       The amplitude reduction in the anthropogenic seismic noise,
                                                                       due to the lockdown measures restricting the mobility of cit-
                                                                       izens during the COVID-19 pandemic, provides an oppor-
                                                                       tunity to investigate in detail the characteristics of such an
                                                                       anthropogenic signal in eastern Sicily.
                                                                          We emphasize how the seismic amplitude decrease is vis-
                                                                       ible even at stations located in remote areas, such as the Mt
                                                                       Etna volcano and the Aeolian Islands. The amount of the
                                                                       amplitude reduction, its temporal pattern and spectral con-
                                                                       tent proved to be strongly station-dependent. As for the first
                                                                       point, we found decreases of 30 %–60 % in most of the con-
Figure 8. Ratios between the spectra computed before and during        sidered stations, located close to towns and busy highway,
the lockdown (grey lines; see Fig. 7) and the corresponding stacked    as well as on the flanks of Mt Etna where country roads
ratio (black line). The red horizontal dashed line indicates a ratio   are used to bring tourists to the top of the volcano or in
value equal to 1.                                                      the Aeolian Islands, due to ship traffic reduction. Regard-
                                                                       ing the temporal patterns of seismic noise amplitude, the sta-
                                                                       tions installed close to towns or infrastructures (like busy
                                                                       roads and highways) showed the typical pattern of the an-
tain plenty of information about human mobility. The seismic
                                                                       thropogenic seismic noise with minima during the weekends
noise frequencies better correlated with human mobility data
                                                                       and the night-time and maxima during the weekdays and
turned out to be above 10 Hz (maximum values are reached
                                                                       the daytime. Other stations show less regular patterns with
in the band 11–18 Hz; Fig. 9b). This result, in line with the in-
                                                                       clear peaks interspersed throughout the time series. Concern-
formation obtained by computing the ratios between the seis-
                                                                       ing the spectral content, the frequency band most affected
mic spectra before and during the lockdown (Fig. 8), shows
                                                                       by anthropogenic seismic noise ranges from a few Hertz to
how the seismic frequency band most affected by human ac-
                                                                       more than 20 Hz, depending on the station. On average, the
tivities is above 10 Hz. As for the comparison between the
                                                                       frequencies above 10 Hz are the most influenced by anthro-
time series of seismic noise at ILLI station in the band 10–
                                                                       pogenic seismic noise.
40 Hz and ship traffic data of Lipari port, only daily overall
                                                                          We found that human mobility influenced the seismic
gross tonnage and the daily number of port calls of tanker
                                                                       noise mostly in frequencies above 10 Hz with remarkably
showed p values lower than 0.05 (with Spearman correlation
                                                                       high correlations between them observed at some stations.
coefficients equal to 0.18 and 0.25, respectively). In this case,
                                                                       Furthermore, the comparison between seismic noise data ac-
the seismic noise frequencies better correlated with ship traf-
                                                                       quired at ILLI station (located in Lipari, Aeolian Islands) and
fic data were below ∼ 25 Hz. This analysis, focused on ship
                                                                       ship traffic data from Lipari port highlighted a significant cor-
traffic data, highlights how particular types of boats (likely
                                                                       relation, especially in the case of ships with high gross ton-
the ones with higher gross tonnage, among which are the
                                                                       nage. These results further confirm how seismic data, rou-
tankers) are mainly responsible for the seismic noise genera-
                                                                       tinely acquired worldwide mainly for earthquake and vol-
tion recorded close to ports. In addition, the frequency band
                                                                       canic surveillance, can also be used to monitor human mobil-
most affected by such seismic noise seems to be different (in
                                                                       ity, especially during emergency periods such as the COVID-
particular lower) from the band most influenced by other hu-
                                                                       19 pandemic. As highlighted by Lindsey et al. (2020), seis-
man activities (see Figs. 9b and 11e).
                                                                       mic data also present advantages over mobile-phone-derived
   Since the general reduction in the amplitude of seismic
                                                                       information as they are anonymous in nature and not affected
noise at all the stations in mid-March took place at the end
                                                                       by biases due to data sampling according to socio-economic
of the winter and the beginning of the spring and when the
                                                                       class, age and region.
meteorological conditions improved, such a decrease could
also be interpreted as being due to weather changes. Indeed,
wind generates a broadband seismic noise with frequencies
from ∼ 0.5 Hz up to ∼ 60 Hz (e.g. Bormann and Wielandt,
2013). However, we exclude such a possibility on the basis

https://doi.org/10.5194/se-12-299-2021                                                               Solid Earth, 12, 299–317, 2021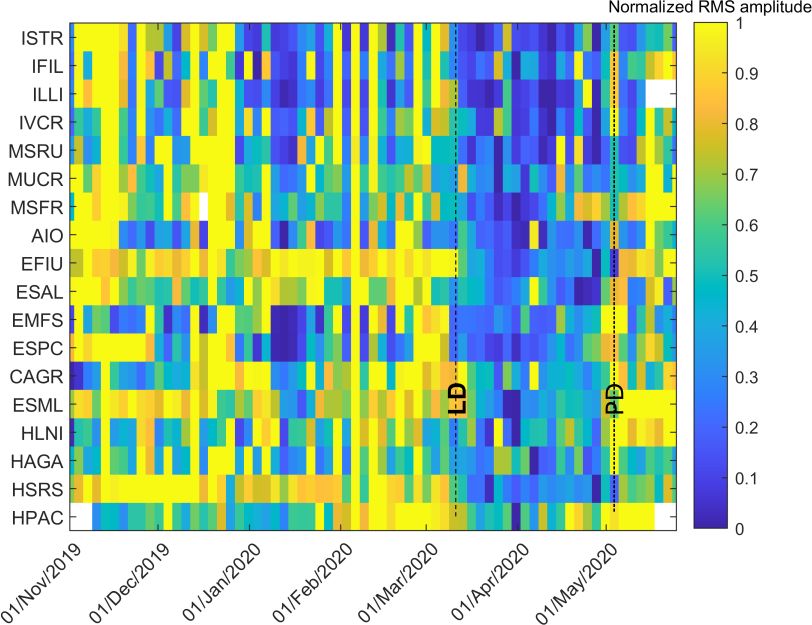
308                                                   A. Cannata et al.: Seismic evidence of the COVID-19 lockdown measures

Figure 9. (a) Time series of rms amplitude of the vertical component of the seismic signal recorded by EFIU station and filtered in the
band 10–40 Hz (blue line) and the different categories of human mobility as provided by Google (red line). The vertical dashed lines and the
labels “LD” and “PD” indicate the times when the national lockdown measures were implemented in Italy (11 March 2020) and when the
first presidential decree, slightly lifting the lockdown measures, was issued (4 May 2020), respectively. (b) Spearman correlation coefficient,
calculated between seismic rms amplitude at the different stations and the mobility parameters, as a function of the frequency band of the
seismic noise. The Spearman correlation coefficient obtained for the residential change (top plot in b) was multiplied by −1 to make it
positive.

Solid Earth, 12, 299–317, 2021                                                                  https://doi.org/10.5194/se-12-299-2021
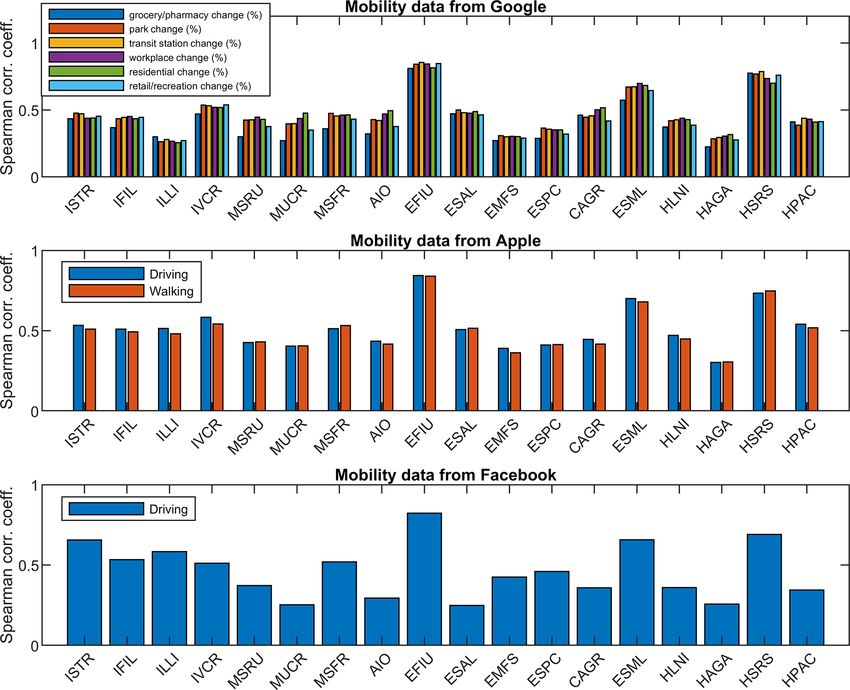
A. Cannata et al.: Seismic evidence of the COVID-19 lockdown measures                                                                 309

Figure 10. Spearman correlation coefficient calculated between seismic rms amplitude at the different stations in the band 10–40 Hz and the
mobility parameters, as provided by Google, Apple and Facebook. The Spearman correlation coefficient obtained for the residential change
(see top plot) was multiplied by −1 to make it positive.

https://doi.org/10.5194/se-12-299-2021                                                                 Solid Earth, 12, 299–317, 2021
310                                                   A. Cannata et al.: Seismic evidence of the COVID-19 lockdown measures

Figure 11. (a) Rms amplitude time series of the vertical component of the seismic signal, recorded by ILLI station and filtered in the band
10–40 Hz (grey line) and corresponding moving median computed on 1 d long sliding windows (thick black line). (b) Daily number of port
calls in the Lipari port. (c) Daily overall gross tonnage in Lipari port. (d) Daily number of port calls in Lipari port, separated on the basis
of the boat category. (e) Spearman correlation coefficient, calculated between seismic rms amplitude at ILLI and two ship traffic parameters
(see the legend in the upper right corner), as a function of the frequency band of the seismic noise. The vertical dashed line and the label
“LD” in (a)–(d) indicate the time when the national lockdown measures were implemented in Italy (11 March 2020).

Solid Earth, 12, 299–317, 2021                                                                  https://doi.org/10.5194/se-12-299-2021
A. Cannata et al.: Seismic evidence of the COVID-19 lockdown measures                                                                  311

Appendix A

Figure A1. Photos from © Google Earth of the installation site areas of the seismic stations (yellow triangles) used in this work. The width
of the area shown in each picture is ∼ 5 km. The stations are sorted by decreasing latitude from upper left to bottom right.

https://doi.org/10.5194/se-12-299-2021                                                                  Solid Earth, 12, 299–317, 2021
312                                                  A. Cannata et al.: Seismic evidence of the COVID-19 lockdown measures

Figure A2. Cross plots showing the seismic rms amplitude of EFIU station in the band 10–40 Hz in the x axis and the different categories of
human mobility from Google in the y axis from 15 February to 20 May 2020. The values of the Spearman correlation coefficient, computed
between the time series plotted in the graph, are shown in the title.

Solid Earth, 12, 299–317, 2021                                                                https://doi.org/10.5194/se-12-299-2021
A. Cannata et al.: Seismic evidence of the COVID-19 lockdown measures                                                             313

Figure A3. Probability values (p values), obtained by the Spearman correlation analysis performed between seismic rms amplitude at the
different stations and the human mobility parameters, as provided by Google, Apple and Facebook.

https://doi.org/10.5194/se-12-299-2021                                                             Solid Earth, 12, 299–317, 2021
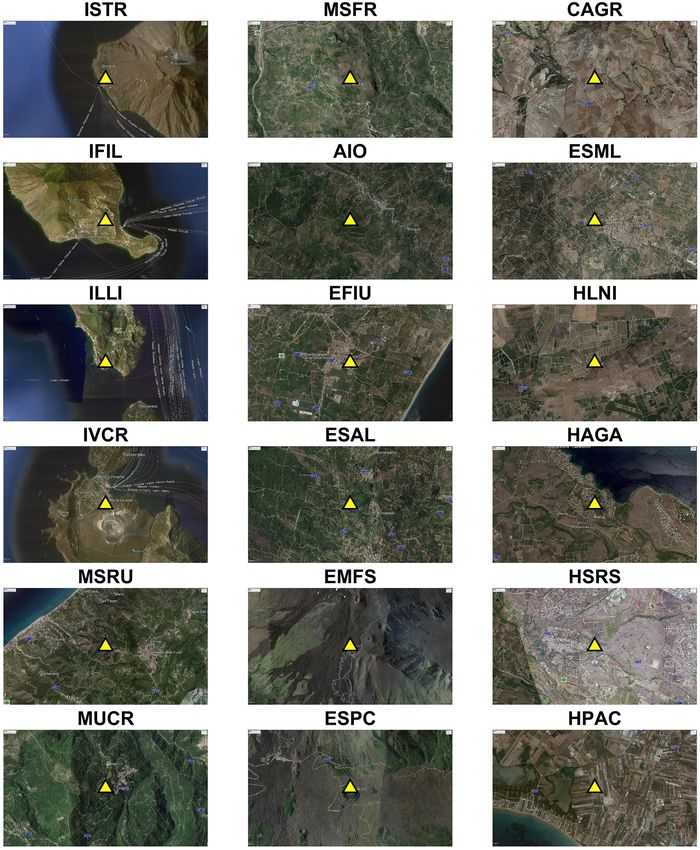
314                                                A. Cannata et al.: Seismic evidence of the COVID-19 lockdown measures

Figure A4. (a) Seismogram showing the seismic signal recorded by the vertical component of the station EFIU and filtered in the band
10–40 Hz during the week 17–23 February 2020 and (c) the corresponding spectrogram of the non-filtered signal. (b) Seismogram showing
the seismic signal recorded by the vertical component of the station EFIU and filtered in the band 10–40 Hz during the week 30 March–
5 April 2020 and (d) the corresponding spectrogram of the non-filtered signal.

Solid Earth, 12, 299–317, 2021                                                            https://doi.org/10.5194/se-12-299-2021
A. Cannata et al.: Seismic evidence of the COVID-19 lockdown measures                                                            315

Figure A5. (a) Seismogram showing the seismic signal recorded by the vertical component of the station ILLI and filtered in the band
10–40 Hz during the week 17–23 February 2020 and (c) the corresponding spectrogram of the non-filtered signal. (b) Seismogram showing
the seismic signal recorded by the vertical component of the station ILLI and filtered in the band 10–40 Hz during the week 30 March–
5 April 2020 and (d) the corresponding spectrogram of the non-filtered signal.

https://doi.org/10.5194/se-12-299-2021                                                            Solid Earth, 12, 299–317, 2021
316                                                     A. Cannata et al.: Seismic evidence of the COVID-19 lockdown measures

Data availability. The data that support the findings of this study       Ardhuin, F., Gualtieri, L., and Stutzmann, E.: How ocean waves
are available on request from the corresponding author.                     rock the Earth: Two mechanisms explain microseisms with
                                                                            periods 3 to 300 s, Geophys. Res. Lett., 42, 765–772,
                                                                            https://doi.org/10.1002/2014GL062782, 2015.
Author contributions. AC, FC and TL designed the study. All the           Beauducel, F.: READHGT: Import/download NASA SRTM
authors analysed the seismic data. AC, FC, RSMDP and GDG wrote              data files (HGT), MATLAB Central File Exchange, available
the paper. All the authors interpreted the results and revised the ar-      at:      https://www.mathworks.com/matlabcentral/fileexchange/
ticle.                                                                      36379-readhgt-import-download-nasa-srtm-data-files-hgt (last
                                                                            access: 26 January 2021), 2020.
                                                                          Bormann, P. and Wielandt, E.: Seismic signals and noise, in: New
Competing interests. The authors declare that they have no conflict         Manual of Seismological Observatory Practice 2 (NMSOP2),
of interest.                                                                2nd edn., edited by: Bormann, P., GFZ, Potsdam, Germany, 1–
                                                                            62, 2013.
                                                                          Cannata, A., Di Grazia, G., Montalto, P., Ferrari, F., Nunnari, G.,
                                                                            Patanè, D., and Privitera, E.: New insights into banded tremor
Special issue statement. This article is part of the special issue “So-
                                                                            from the 2008–2009 Mount Etna eruption, J. Geophys. Res., 115,
cial seismology – the effect of COVID-19 lockdown measures on
                                                                            1–22, 2010.
seismology”. It is not associated with a conference.
                                                                          Cannata, A., Cannavò, F., Moschella, S., Gresta, S., and Spina,
                                                                            L.: Exploring the link between microseism and sea ice in
                                                                            Antarctica by using machine learning, Sci. Rep., 9, 13050,
Acknowledgements. We are indebted to the technicians of the                 https://doi.org/10.1038/s41598-019-49586-z, 2019.
INGV-OE for enabling the acquisition of seismic data. We also             Cannata, F., Chiarito, M., Reimers, B., Azzolini, E., Ferrante, G.,
sincerely acknowledge all the essential workers who, placing them-          My, I., Viggiani, G., Panico, C., Regazzoli, D., Ciccarelli, M.,
selves at risk, are taking care of the sick, assisting the communities      Voza, A., Aghemo, A., Li, H., Wang, Y., Condorelli, G., and Ste-
and serving in any way during this COVID-19 pandemic. Figure 1              fanini, G. G.: Continuation versus discontinuation of ACE in-
was drawn by the readhgt.m Matlab® function (© 2020, François 20            hibitors or angiotensin II receptor blockers in COVID-19: effects
Beauducel; https://it.mathworks.com/matlabcentral/fileexchange/             on blood pressure control and mortality, Eur. Heart J., 6, 412–
36379-readhgt-import-download-nasa-srtm-data-files-hgt,           last      414, pvaa056, https://doi.org/10.1093/ehjcvp/pvaa056, 2020a.
access: 26 January 2021) and shows topography data provided by            Cannata, A., Cannavò, F., Moschella, S., Di Grazia, G., Nar-
NASA Shuttle Radar Topography Mission (SRTM). We would                      done, G., Orasi, A., Picone, M., Ferla, M., and Gresta, S.:
like to thank Stephen Hicks, Kasper van Wijk and an anonymous               Unravelling the Relationship Between Microseisms and Spa-
reviewer for their great help to improve this paper. Ship traffic           tial Distribution of Sea Wave Height by Statistical and Ma-
data from Lipari port was provided by FleetMon, JAKOTA                      chine Learning Approaches, Remote Sens.-Basel, 12, 761,
Cruise Systems GmbH, Rostock, Germany (data provided on                     https://doi.org/10.3390/rs12050761, 2020b.
10 October 2020).                                                         Chouet, B. A. and Matoza, R. S.: A multi-decadal view of
                                                                            seismic methods for detecting precursors of magma move-
                                                                            ment and eruption, J. Volcanol. Geotherm. Res., 252, 108–175,
Financial support. This research has been supported by the Uni-             https://doi.org/10.1016/j.jvolgeores.2012.11.013, 2013.
versità degli Studi di Catania (Italy): grant CHANCE, II Edition,         Craig, D., Bean, C., Lokmer, I., and Mollhoff, M.: Correlation of
2020-22 programme (principal investigator Andrea Cannata) and               Wavefield-Separated Ocean-Generated Microseisms with North
grant PIACERI, 2020-22 programme (PAROSSISMA project, code                  Atlantic Source Regions, B. Seismol. Soc. Am., 106, 1002–1010,
22722132140; principal investigator Marco Viccaro).                         2016.
                                                                          Dias, F. L., Assumpção, M., Peixoto, P. S., Bianchi, M. B.,
                                                                            Collaço, B., and Calhau, J.: Using Seismic Noise Lev-
Review statement. This paper was edited by Tarje Nissen-Meyer               els to Monitor Social Isolation: An Example from Rio de
and reviewed by Stephen Hicks, Kasper van Wijk, and one anony-              Janeiro, Brazil, Geophys. Res. Lett., 47, e2020GL088748,
mous referee.                                                               https://doi.org/10.1029/2020GL088748, 2020.
                                                                          Díaz, J., Ruiz, M., Sánchez-Pastor, P. S., and Romero, P.: Urban
                                                                            seismology: On the origin of earth vibrations within a city, Sci.
                                                                            Rep.-UK, 7, 1–11, 2017.
                                                                          Facebook: COVID-19 Mobility Data Network, available at: https:
References                                                                  //data.humdata.org/dataset/movement-range-maps (last access: 5
                                                                            June 2020), 2020.
Anthony, R. E., Aster, R. C., and McGrath, D.: Links between atmo-        Falsaperla, S., Langer, H., and Spampinato, S.: Statistical analy-
  sphere, ocean, and cryosphere from two decades of microseism              ses and characteristics of volcanic tremor on Stromboli volcano
  observations on the Antarctic Peninsula, J. Geophys. Res.-Earth           (Italy), Bull. Volcanol., 60, 75–88, 1998.
  Surf., 122, 153–166, https://doi.org/10.1002/2016JF004098,              Gatto, M., Bertuzzo, E., Mari, L., Miccoli, S., Carraro, L.,
  2017.                                                                     Casagrandi, R., and Rinaldo, A.: Spread and dynamics of the
Apple: Mobility Trends Reports, available at: https://www.apple.            COVID-19 epidemic in Italy: effects of emergency contain-
  com/covid19/mobility (last access: 05 June 2020), 2020.

Solid Earth, 12, 299–317, 2021                                                                  https://doi.org/10.5194/se-12-299-2021
A. Cannata et al.: Seismic evidence of the COVID-19 lockdown measures 317 ment measures, P. Natl. Acad. Sci. USA, 117, 10484–10491, Piccinini, D., Giunchi, C., Olivieri, M., Frattini, F., Di Gio- https://doi.org/10.1073/pnas.2004978117, 2020. vanni, M., Prodi, G., and Chiarabba, C.: COVID-19 lock- Google: COVID-19 Community Mobility Reports, available at: down and its latency in Northern Italy: seismic evidence https://www.google.com/covid19/mobility/ (last access: 5 June and socio-economic interpretation, Sci. Rep.-UK, 10, 16487, 2020), 2020. https://doi.org/10.1038/s41598-020-73102-3, 2020. Graham, B. S.: Rapid COVID-19 vaccine development, Science, Poli, P., Boaga, J., Molinari, I., Cascone, V., and Boschi, L.: 368, 945–946, https://doi.org/10.1126/science.abb8923, 2020. The 2020 coronavirus lockdown and seismic monitoring of an- Hasselmann, K. A.: Statistical analysis of the generation of micro- thropic activities in Northern Italy, Sci. Rep.-UK, 10, 9404, seisms, Rev. Geophys., 1, 177–210, 1963. https://doi.org/10.1038/s41598-020-66368-0, 2020. Hong, T.-K., Lee, J., Lee, G., Lee, J., and Park, S.: Correlation be- Stein, S. and Wysession, M.: An introduction to seismology, earth- tween Ambient Seismic Noises and Economic Growth, Seismol. quakes, and earth structure, Blackwell, Malden, MA, USA, 2003. Res. Lett., 20, 1–12, https://doi.org/10.1785/0220190369, 2020. Wang, C., Li, W., Drabek, D., Okba, N. M. A., van Haperen, R., Lecocq, T., Hicks, S., Van Noten, K., et al.: Global qui- Osterhaus, A. D. M. E., van Kuppeveld, F. J. M., Haagmans, B. eting of high-frequency seismic noise due to COVID-19 L., Grosveld, F., and Bosch, B. J.: A human monoclonal anti- pandemic lockdown measures, Science, 369, 1338–1343, body blocking SARS-CoV-2 infection, Nat. Commun., 11, 2251, https://doi.org/10.1126/science.abd2438, 2020. https://doi.org/10.1038/s41467-020-16256-y, 2020b. Lindsey, N. J., Yuan, S., Lellouch, A., Gualtieri, L., Lecocq, T., and Wang, D., Hu, B., Hu, C., Zhu, F., Liu, X., Zhang, J.„ Biondi, B.: City-scale dark fiber DAS measurements of infras- Wang, Xiang, H., Cheng, Z., Xiong, Y.„ Zhao, Li, Y., tructure use during the COVID-19 pandemic, Sci. Adv., submit- Wang, X., and Peng, Z.: Clinical Characteristics of 138 ted, 2020. Hospitalized Patients With 2019 Novel Coronavirus – In- Longuet-Higgins, M. S.: A theory of the origin of microseisms, Phi- fected Pneumonia in Wuhan, China, JAMA, 323, 1061–1069, los. Trans. R. Soc. London, Ser. A, 243, 1–35, 1950. https://doi.org/10.1001/jama.2020.1585, 2020a. Lyons, R. G.:. Understanding digital signal processing, Pearson Welch, P. D.: The use of Fast Fourier Transform for the estimation Education India, Upper Saddle River, NJ 07458 United States, of power spectra: a method based on time averaging over short, 2004. modified periodograms, IEEE T. Audio Electroacoust. 15, 70– March, D., Metcalfe, K., Tintoré, J., and Godley, B. J.: 73, https://doi.org/10.1109/TAU.1967.1161901, 1967. Tracking the global reduction of marine traffic during World Health Organization: Coronavirus disease (COVID-2019) the COVID-19 pandemic, ResearchSquare, in review, situation reports, available at: https://www.who.int/emergencies/ https://doi.org/10.21203/rs.3.rs-47243/v1, 2020. diseases/novel-coronavirus-2019/situation-reports/ (last access: Pepe, E., Bajardi, P., Gauvin, L., Privitera, F., Lake, B., Cattuto, 21 July 2020), 2020. C., and Tizzoni, M.: COVID-19 outbreak response, a dataset to Xiao, H., Eilon, Z., Ji, C., and Tanimoto, T.: COVID-19 societal assess mobility changes in Italy following national lockdown, response captured by seismic noise in China and Italy, Seismol. Sci. Data, 7, 230, https://doi.org/10.1038/s41597-020-00575-2, Res. Lett., 20, 1–12, https://doi.org/10.1785/0220200147, 2020. 2020. https://doi.org/10.5194/se-12-299-2021 Solid Earth, 12, 299–317, 2021
You can also read