Temporal and cultural limits of privacy in smartphone app usage
←
→
Page content transcription
If your browser does not render page correctly, please read the page content below
www.nature.com/scientificreports
OPEN Temporal and cultural limits
of privacy in smartphone app usage
Vedran Sekara1,2*, Laura Alessandretti 1,3,4
, Enys Mones 1,3
& Håkan Jonsson1,5*
Large-scale collection of human behavioural data by companies raises serious privacy concerns. We
show that behaviour captured in the form of application usage data collected from smartphones is
highly unique even in large datasets encompassing millions of individuals. This makes behaviour-
based re-identification of users across datasets possible. We study 12 months of data from 3.5 million
people from 33 countries and show that although four apps are enough to uniquely re-identify 91.2%
of individuals using a simple strategy based on public information, there are considerable seasonal and
cultural variations in re-identification rates. We find that people have more unique app-fingerprints
during summer months making it easier to re-identify them. Further, we find significant variations
in uniqueness across countries, and reveal that American users are the easiest to re-identify, while
Finns have the least unique app-fingerprints. We show that differences across countries can largely be
explained by two characteristics of the country specific app-ecosystems: the popularity distribution
and the size of app-fingerprints. Our work highlights problems with current policies intended to
protect user privacy and emphasizes that policies cannot directly be ported between countries. We
anticipate this will nuance the discussion around re-identifiability in digital datasets and improve
digital privacy.
Tracking behaviour is a fundamental part of the big-data economy, allowing companies and organizations to
segment, profile and understand their users in increasingly greater d etail1. Modeling context and interests of
users has proven to have various commercial advantages: products can be designed to better fit customer needs;
content can be adapted; and advertising can be made more r elevant2–5. Efficient user modeling requires the col-
lection of large-scale datasets of human behaviour, which has led to a growing proportion of human activities
to be recorded and stored6. Today, most of our interactions with computers are stored in a database, whether
it is an e-mail, phone call, credit-card transaction, Facebook like, or online search, and the rate of information
growth is expected to accelerate even further in the future7. These rich digital traces can be compiled into detailed
representations of human behaviour and can revolutionize how we organize our societies, fight diseases, and
perform research; however, they also raise serious privacy c oncerns8–13.
The sensing capabilities of modern day smartphones, together with our seemingly symbiotic relationship
to them, render mobile devices good tools for tracking and studying human behaviour14,15. Mobile phones are
ubiquitous and have permeated nearly every human society. In 2018 there were 107 mobile-cellular subscrip-
tions per 100 inhabitants16, and globally smartphones account for 60% of all mobile phones17. Smartphones have
transformed the way people access the internet; today the majority of traffic to web pages stems from mobile
devices rather than from desktop computers18, making advertisers target mobile phones to a higher degree. With
the standard methods based on cookies for identifying customers not being used in smartphones, combined with
the rising usage of ad-blockers among users19, companies, advertisers, and so-called data brokers are now using
smartphone apps to identify and track individuals. Identifiers such as the Android Advertisement ID are one
example of IDs embedded in app, but they do not allow data brokers to track users across multiple applications
or devices, and they can even be reset by users. App usage behaviour, however, cannot be cleared, and it is hard
(and in many cases not feasible) to be changed or manipulated by users.
This creates an economic incentive for global population tracking of app usage. In fact, many free apps are
developed for the sole purpose of data c ollection20, and numerous apps have been shown to collect information
about installed (or used) apps which is sent to third-party data b rokers21. Although app usage information might
seem innocent it is highly unique and can be used to predict sensitive individual characteristics such as age, eth-
nicity, income, religion or relationship status22,23. A recent report, released by the U.S. Federal Trade Commission,
1
Sony Mobile Communications, 22188 Lund, Sweden. 2Department of Computer Science, IT University of
Copenhagen, Copenhagen S 2300, Denmark. 3Department of Applied Mathematics and Computer Science,
Technical University of Denmark, 2800 Kongens Lyngby, Denmark. 4Copenhagen Center for Social Data Science,
University of Copenhagen, Copenhagen K 1353, Denmark. 5Faculty of Engineering (LTH), University of Lund,
22100 Lund, Sweden. *email: vedransekara@gmail.com; hajons@gmail.com
Scientific Reports | (2021) 11:3861 | https://doi.org/10.1038/s41598-021-82294-1 1
Vol.:(0123456789)www.nature.com/scientificreports/
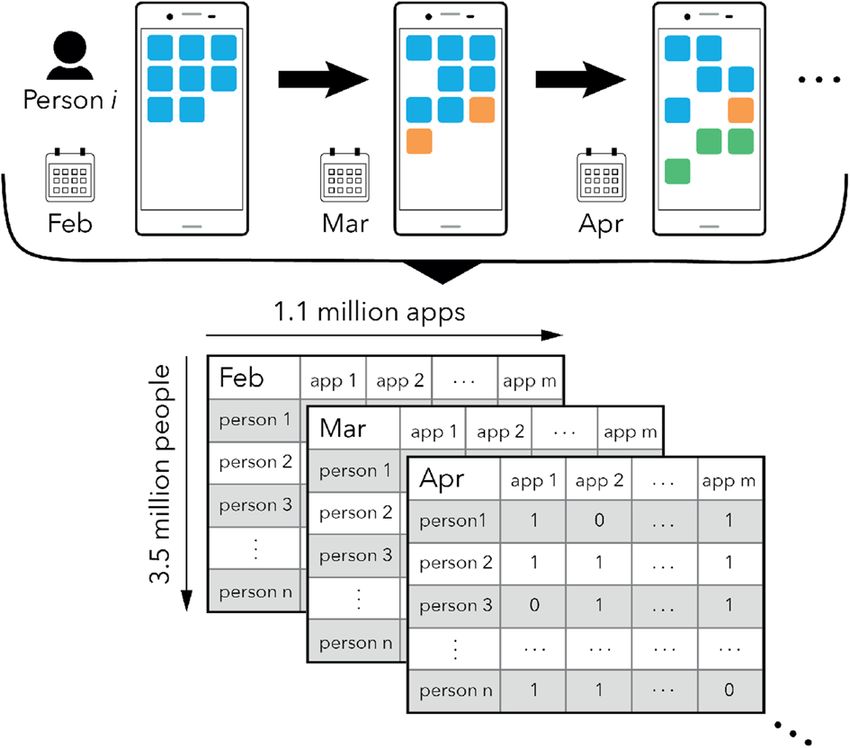
Figure 1. Smartphone app usage patterns change over time. This study is based on smartphone app-
fingerprints of 3,556,083 individuals from 33 countries. For each month between February 2016 and January
2017, we retrieve the list of apps a person has used during the period. On average a person uses nmonth = 23
unique apps per month, however, individuals continuously revise which apps they use, and use nyear = 76
apps over the course of a year. App-fingerprints are represented as a sparse user × app × month tensor, where 1
indicates a person has used an app during a specific month, 0 otherwise. To look at longer time-windows, we
aggregate entries according to a maximum value heuristic and retain entries if they are greater than zero.
describes how data broker companies obtain vast amounts of personal data, which they further enrich with
additional online and offline sources, and re-sell these improved datasets to the highest bidder, typically without
the explicit consent or knowledge of u sers24. An example of this is TalkingData, China’s largest third-party mobile
data platform, which collects and sells app usage data of more than 750 million smartphone users25.
According to U.S. privacy laws, data is considered anonymous if it does not contain personally identifiable
information (PII) such as name, home address, email address, phone number, social security number, or any
other obvious identifier. As a result, it is legal for companies to share and sell anonymized versions of a dataset.
Similarly, to comply with EU’s General Data Protection Regulation (GDPR) it is common practice for companies
to encrypt the user identifier and throw away the key, while keeping the actual user data. However, as studies
have shown, the mere absence of PII in a dataset does not necessarily guarantee anonymity due to the fact that
it is relatively easy to compromise the privacy of individuals by using outside i nformation8,11,26.
Human behaviour, although imbued with routines, is inherently diverse. For instance, previous work (on
datasets of limited size—approximately 50.000 users and without accounting for geographic spread) has shown
that 99.4% of smartphone users have unique app usage patterns and established the viability of using apps as
markers of human identity, similar in application to fingerprints in forensic s cience27.
Our study looks into uniqueness on a much larger scale—3.5 million individuals—and focuses on the smart-
phone apps used by these individuals. First, we use our dataset to validate the findings of Achara et al.27 demon-
strating that even in a large-scale dataset it is relatively easy to uniquely identify individuals from only a handful
of their apps. Next, we study the role played by seasonal and cultural differences in determining uniqueness,
thus bringing more nuance to the discussion around re-identification. Our results show that human behaviour
is easier to re-identify during certain periods of the year, and that country-specific factors influence the re-
identification rate of individuals. Depending on the attack model, we identify that one of two quantities, namely
the parameter characterizing the distribution of app-popularity within a given country and the median size of
individuals’ app-fingerprints, to a large extent explains differences in re-identification rates across countries.
Results
Global uniqueness of human behaviour. We evaluate the likelihood of identifying individuals within
smartphone app usage data using a dataset that spans 12 months (1 Feb 2016 to 31 Jan 2017) and encompass-
ing 3.5 million people from 33 countries using in total 1.1 million unique apps (approximately 40% of all apps
on Google Play28). We have chosen to disregard phone vendor specific apps, such as alarm clock apps, built-in
phone dialer apps, and only focus on apps that are downloadable from Google Play. From this we form app fin-
gerprints for each person, i.e. a binary vector containing information about the apps a person has used for every
month. We only consider apps actually used by a user and disregard apps that were installed but never used. Fig-
ure 1 illustrates the typical patterns of app usage, with individuals continuously changing their app-fingerprint
over the course of a year by trying out new apps and ceasing to use others. As such, app-fingerprints slowly
drift over time, with the average rate of change being roughly constant between consecutive months (Fig. S1).
Although app-fingerprints drift, the number of apps people use on their smartphones is constant over time sug-
Scientific Reports | (2021) 11:3861 | https://doi.org/10.1038/s41598-021-82294-1 2
Vol:.(1234567890)www.nature.com/scientificreports/
1.0
random
uniqueness of fingerprint
popularity
0.8
0.6
0.4
0.2
0.0
1 2 3 4 5
number of apps
Figure 2. Uniqueness of smartphone app-fingerprints given n number of apps. Selecting apps at random is
not an efficient way of identifying individuals and achieves a modest re-identification rate of 21.8% when using
4 apps (blue line). Sampling apps according to their inverse popularity, in terms of users, yields significantly
higher rates of re-identifications, 91.2% when using 4 apps (red line). Error bars denote one standard deviation.
App-fingerprints are constructed from the full 12 months of data, and 99.7% of individuals within the dataset
have a unique fingerprint.
gesting that humans have a limited capacity for interacting, navigating, and managing the plethora of services
and social networks offered by smartphones (Fig. S2). This limiting effect has been observed in app usage29 as
well as other aspects of life such as interactions among people30 and geo-spatial e xploration31.
To estimate the re-identifiability of individuals, we focus on two attack schemes: (1) the random attack scheme
and (2) the popularity attack scheme. These attack schemes relate to different threat models, where an attacker
may try to associate two digital identities by comparing a dataset with outside information. Under the (1) ran-
dom attack scheme, the assumption is that an attacker has information about n apps selected at random from
the pool of an individual’s mobile phone apps. This is not a realistic scenario, since users typically share more
information, but it provides a useful baseline. Under the (2) popularity attack scheme, an attacker would know
the n least popular app used by a person. Although this is an equally unrealistic scenario, the analysis provides
an upper bound to the estimation of uniqueness and highlights the need of better privacy guards against col-
lection of app-usage data.
The risk of re-identifying individuals is estimated by means of unicity11,12,27, which is a standard method for
quantifying how many points of outside information, on average, are needed to re-identify an individual (see
Methods for details). Here, re-identification corresponds to a successful assignment of an app-fingerprint to a
single unique individual in our dataset. This does not entail that we can directly get the real identity of a person,
such as name, address, e-mail, social security number, etc. But this becomes possible if the information is cross-
referenced with other data sources, which there unfortunately have been countless examples of8,32–35. Given an
individual’s app-fingerprint, unicity quantifies the number of apps needed to uniquely re-identify that person;
the fewer apps we need the more unique a person is and vice versa. Given a dataset of app-fingerprints and apps
i, j and k, a person u is uniquely identifiable if they, and only they, in the dataset have used apps i, j and k, i.e.
matching the fingerprint of user u. In our dataset we evaluate uniqueness as the percentage of individuals we
can re-identify using n number of apps.
Figure 2 shows the efficiency of the random attack scheme, demonstrating that 21.8% of individuals can be
re-identified from 4 apps. A surprisingly high number given that we only use binary features (that is, has the
user used the app or not) and not information regarding when an app was used or for how long—features which
would only make fingerprints more unique. The popularity attack scheme is more effective at re-identifying
individuals. Using just 2 apps the popularity approach greatly outperforms the random strategy, and using 4
apps, we are able to re-identify 91.2% of individuals. (This result confirms and is comparable to earlier findings
which were derived from a much smaller and non-representative sample of Android users27.) The popularity
scheme is more effective because it exploits the fact that app popularity follows a heavy-tailed distribution (see
Fig. S3), where a few apps are used by millions of individuals, while an overwhelming majority of apps only have
a couple of users. As such, the popularity scheme is more likely to pick apps which are highly unique (used by
one or very few individuals). Information about app popularity is easily attainable, it can directly be estimated
from the data, be scraped from Google Play, or even be purchased from data vendors.
Temporal variability of anonymity. Human lives, routines, and behaviours evolve over t ime31,36,37, there-
fore individual app-fingerprints might become harder (or easier) to identify. To quantify the temporal variability
of uniqueness, we construct monthly fingerprints for all individuals and evaluate anonymity on a monthly basis
using the unicity framework. Figure 3 shows the fraction of individuals that are re-identifiable per month, and
reveals an increased fraction of re-identifications for June, July, and August. The increase in uniqueness is inde-
pendent of whether apps are sampled at random (Fig. 3A) or by popularity (Fig. 3B), and is statistically signifi-
cant (see Fig. S6). For the random attack scheme people’s app-fingerprints are respectively 14.8% and 18.4% more
unique (4.1 and 11.2 percent point higher) when using 5 and 10 apps. In terms of the number of individuals this
means approximately 145,000 (n = 5) and 400,000 (n = 10) people in our dataset adopt a behavior which makes
Scientific Reports | (2021) 11:3861 | https://doi.org/10.1038/s41598-021-82294-1 3
Vol.:(0123456789)www.nature.com/scientificreports/
n=1 n=2 n=3 n=4 n=5
n=6 n=7 n=8 n=9 n = 10
1.0 1.0
A B
uniqueness of fingerprint
0.8 0.8
0.6 0.6
0.4 0.4
0.2 0.2
0.0 0.0
Mar Jun Sep Dec Mar Jun Sep Dec
month month
Figure 3. Temporal variations of uniqueness over 12 months. The fraction of individuals which we can
re-identify by using n apps (1–10) changes from month to month, revealing that uniqueness has a temporal
component, and that people are more unique during certain months. This is independent of whether apps are
selected according to the random attack scheme (A) or the popularity scheme (B). Compared to Fig. 2, the
fraction of re-identified individuals per month is lower because we have segmented behaviour into monthly
fingerprints as compared to constructing fingerprints from 12 months of data. Each data point is rescaled
proportional to the number of apps in each month so that uniqueness values are comparable even with a
changing size of app set (see Fig. S5).
them identifiable during summer. For the popularity strategy, we observe re-identification rates to be 8.8% and
10% higher (5.4 and 6.4 percent point) when using 5 and 10 apps, corresponding to 190,000 and 230,000 addi-
tional individuals being re-identified.
The increase in identifiability stems from a combination of related behavioural changes (Fig. S4). Apps related
to categories such as “travel”, “weather”, “sports”, and “health and fitness” gain popularity during the summer
months (June, July, August), related to people traveling and downloading apps that help them navigate new cit-
ies, use fitness apps to get into better shape, and start using apps that enable them to follow global sports events
such as the 2016 UEFA European Championship. Simultaneously, usage of apps related to categories such as
“education” and “business” becomes less popular. This suggests an interplay between people’s physical behaviour
and their app-fingerprint, indicating that when people change their routines by traveling and exploring new
places, they also change their app usage. This change in phone behaviour makes app-fingerprints more unique,
and leads to higher re-identification rates.
Cultural aspects of privacy. A natural question is whether individuals are more or less identifiable across
different cultural contexts. Since our dataset includes information about individuals’ country of residency, we
investigate the matter by computing the fraction of unique individuals within each of the countries in our data-
base. To exclude effects due to country size we consider samples of equal size for each country (see Methods).
Figure 4 shows that the country of residence has a large effect on the re-identification rate, even for the
random attack scheme. Considering n = 5 apps, the average re-identification rate varies drastically between
countries, from (41.2 ± 0.6)% for Finland to (66.5 ± 0.5)% for the United States (see Fig. 4A). Country differences
are stable with respect to both time (see Fig. S9) and sample size (see Fig. S10), and the difference in uniqueness
between any two countries is statistically significant for over 90% of country pairs (see Fig. S11). Differences are
also robust when selecting apps using the popularity scheme (see Fig. S12). However, the standard deviation (σ )
between re-identification rates across different countries is not constant, it peaks for n = 6 (see Fig. 4B), implying
that differences between countries are more pronounced in an intermediate regime where the size of the app
fingerprint is large enough but not as large as to include the majority of people’s apps (see Fig. S2)—a regime in
which the unique number of individuals saturates.
The origin of the observed differences in re-identification rates between countries can result from a combina-
tion of factors including societal characteristics, adoption of internet and communication technologies, socio-
economic conditions, etc. Among these factors, an important role could be played by the characteristics of the
app-ecosystem. For instance, the probability P that an app is installed by a fraction of users p is well described
by a power-law P(p) ∼ p−β in all the countries under study (see De Nadai et al. for d etails29). The exponent β ,
however, varies greatly across countries, ranging from β = 1.74 ± 0.02 in Finland to β = 1.84 ± 0.01 in the
United States (Fig. S13). (The exponents are relatively stable over time (see Fig. S14).) A large value of β results
in a skewed distribution, implying that app popularity is unevenly distributed, with a small fraction of apps being
used by an overwhelming majority of individuals.
We test the extent to which the characteristics of the app-ecosystem explain re-identifaction rates using a
linear regression model of country unicity as a function of three variables endogenous to the app-ecosystem
of each country (number of apps, the median number of apps per person, and the slope of the app popularity
distribution) and two control variables (internet adoption rates, and the Gini index of the wealth distribution).
Scientific Reports | (2021) 11:3861 | https://doi.org/10.1038/s41598-021-82294-1 4
Vol:.(1234567890)www.nature.com/scientificreports/
1.0 US DE
A
uniqueness of fingerprint
AU RU
0.8 CH FR
HK TW
CZ GB
0.6 AT NL
IT PL
0.4 MY SA
PH HU
NO SE
0.2 ES IN
ID ZA
0.0 BR VN
TR IR
deviation
0.06
B MX AR
0.03 EG CO
0.00 FI
2 4 6 8 10
number of apps
Figure 4. Identifying fingerprints across cultural contexts. (A) The average fraction of unique individuals
within samples of 20,000 individuals from the same country, as a function of the number of apps n included
in the fingerprint. Results are averaged across 240 samples, 20 for each of the months considered. Each line
correspond to a different country. Countries in the legend are sorted based on the identification rate obtained
for n = 5, from highest to lowest. Re-identification rates are higher than in Fig. 2 as fingerprints are segmented
into countries. (B) The standard deviation σ for the number of unique individuals across countries, as a function
of the number of apps included in the fingerprint.
A slope of app distribution B
30
model estimate
number of apps
20
median apps per person
10 Internet adoption
R2 = 0.78
Gini index
0
0 10 20 30 -1.5 -1.0 -0.5 0.0 0.5 1.0 1.5
uniqueness rank coefficient estimate
C slope of app distribution D
30
model estimate
number of apps
20
median apps per person
10 Internet adoption
R2 = 0.70
Gini index
0
0 10 20 30 -1.5 -1.0 -0.5 0.0 0.5 1.0 1.5
uniqueness rank coefficient estimate
Figure 5. Estimating country uniqueness as function of multiple variables. (A) Model predictions using a
linear model with rank transformed variables. Uniqueness values are estimated by randomly sampling 5 apps
from individuals’ app-fingerprints. (B) Coefficient estimates of the model, excluding intercept, including 95%
confidence intervals estimated from 10.000 bootstrap samples. The grey shaded area indicates control variables.
(C) Model predictions for the attack scheme using n = 5 apps. (D) Coefficient estimates for the attack scheme
model with 95% confidence intervals.
Scientific Reports | (2021) 11:3861 | https://doi.org/10.1038/s41598-021-82294-1 5
Vol.:(0123456789)www.nature.com/scientificreports/
with country information without country information
1.0
A
of fingerprint
uniqueness
0.8
0.6
0.4
0.2
0.0
0.10 B
gain
0.05
0.00
0 2 4 6 8 10
number of apps
Figure 6. Increased re-identifiability from adding demographic information. (A) The average fraction of
unique individuals, estimated using the random attack scheme, as a function of the number of apps n sampled
from the fingerprint, when information about individuals’ country is included (blue line) or not (red line). To
exclude effects due to how users are distributed across countries in our dataset, we create a synthetic dataset that
includes a random sample of 20,000 individuals from each of the countries under study (see Fig. 4). (B) Gain in
rate of re-identification when the country information is included. The gain peaks at n = 3.
To explore monotonic relationships that are not necessarily linear we perform a rank transformation of all vari-
ables, such that rank 1 is the highest possible value of each v ariable38.
Figure 5A shows the quality of the model fit, comparing country values of uniqueness (estimated using ran-
dom sampling of n = 5 apps, see Fig. S18 for different values of n) to model predictions (see SI section 3.1 for
details). Remarkably, the model explains country uniqueness well ( R2 = 0.78). Figure 5B shows the coefficient
estimates with 95% confidence intervals (see Methods). The most informative variable is the exponent of the app
popularity distribution (β in P(p) ∼ p−β ), which is negatively associated with uniqueness (see also Fig. S19).
Countries with more skewed app popularity distributions have higher uniqueness values (easier to identify
people). As the app distribution is heavy-tailed, the more skewed the distribution becomes the more apps will
exist in the long tail. As such, because we sample apps at random we are more likely to encounter an unpopular
app. Further, the number of apps present in the ecosystems also has a small positive effect on the uniqueness, the
more apps there are, the easier it is to randomly pick an app which makes a person unique. Interestingly, one of
the control variables, internet adoption, is positively associated with uniqueness. (Similarly, GDP is correlated
with uniqueness (r = 0.64, p < 10−4 ), but is not included in the model due to high collinearity with internet
adoption, see SI Section 3.1 for details.)
Similar to Fig. 5A, we have built a model to estimate the cultural variations in uniqueness quantified by
the popularity scheme. Figure 5C shows the quality of the model fit, estimated for n = 5 apps, with the model
achieving a high R2 = 0.7 explaining a majority of the variance. Figure 5D shows the coefficient estimates with
95% confidence intervals. Remarkably, the median number of apps, which is a proxy for the size of people’s app-
fingerprints, is the only informative variable and it is positively associated with country uniqueness values. As
the popularity scheme samples apps according to the inverse popularity the larger peoples’ app-fingerprints are
the more likely it becomes to pick unpopular apps. This suggests that, on a global scale, there are few options to
reduce re-identifiability risks, as regulating the size of app-fingerprints is unfeasible.
Cultural differences, further, open up a new venue of information for de-anonymizing datasets. Adding
country of residence as an extra feature in the app-fingerprint makes it easier to re-identify individuals (see
Fig. 6A), however, the increase in re-identifiability is not dramatic (+8.4 ± 0.5 percent points for n = 5) (see
Fig. 6B). As such, when limited information is available about app-behaviour, knowledge about an individuals
country of residence poses a serious risk to privacy. However, if an individual’s full app-fingerprint is known the
country of residence has little significance.
Discussion
Smartphone behaviour is different from credit card traces and mobility data due to the ease and scale with which
behavioural data can be collected, as any app can request permission to access your app history. The economic
imperative and the ease of collecting and trading this data at global scale without the users’ knowledge raises
serious concerns, especially since this practice has been demonstrated to be in violation of users expectations
and knowledge39,40. The EU General Data Protection Regulation (GDPR) may be a first step towards address-
ing these concerns through regulation, since it does mention u nicity41 and applies globally to data about any
EU citizen. In this light, even coarse-grained and binary-level (app/no app) application usage data should be
considered personally identifiable information. However, as our study shows, re-identification rates vary sig-
nificantly depending on the season, highlighting the importance of studying uniqueness across time. As such,
privacy policies based on analyses of a single snapshot of user behavior might not provide the adequate protection
throughout a year—temporal variability of behavior needs to be considered.
Our study also demonstrates the presence of cultural differences, showing significant variations in unique-
ness, even within countries in the European Union. These results opens up for a larger discussion around the
impact and portability of policies, as a policy intended to protect users within one country might not provide
the same protection for individuals living in a different country. For instance, porting a policy from the US to
Scientific Reports | (2021) 11:3861 | https://doi.org/10.1038/s41598-021-82294-1 6
Vol:.(1234567890)www.nature.com/scientificreports/
Europe, or vice versa, might not have the intended effect for the new context. Based on the results from our
model, we expect knowledge about the properties of a country app ecosystems, especially the distributions of
popularity, to lead to better informed policies for protecting user privacy. We hope our study can bring more
nuance to the field of privacy.
This study was performed using app usage data collected from Android phones from a single vendor only. As
phone vendor specific apps were disregarded in the analysis, we expect the results to generalize across all Android
devices. Further, we have no reason to believe that app usage behaviour and uniqueness are fundamentally dif-
ferent for individuals using iOS devices compared to Android users. iOS has measures in place to protect users
from apps that collect app usage for fingerprinting purposes, but these have been shown to be inadequate42.
Methods
The dataset. We use a dataset that spans 12 months, from Feb. 1st 2016 to Feb. 1st 2017, and contains
monthly app-fingerprints for 3,556,083 individuals with pseudonymized app and user identifiers. Each finger-
print is a binary vector composed of the apps a person has used during a month. We do not consider apps that
are installed but not used. We further disregard phone vendor specific apps such as: alarm clock, phone dialer,
settings etc. and only focus on apps that are downloadable from Google Play. This removes vendor bias, and
makes re-identification harder. The users are selected from major markets in Europe, the Americas, and Asia.
In total, the number of unique apps in the dataset is 1,129,110, and each individual in the dataset uses at least 3
apps per month. App usage data was collected on Sony Mobile devices as part of the general usage statistics for
optimization in order to improve user experience and was processed internally at Sony Mobile. Data collection
was approved by the Sony Mobile Logging Board and written consent in electronic form has been obtained for
all study participants according to the Sony Mobile Application Terms of Service and the Sony Mobile Privacy
Policy. Only countries for which at least 20,000 users accepted the terms of service of the study are included. Due
to privacy concerns raw data cannot be shared publicly, however, a data sample of app-fingerprints from 20,000
randomly selected individual, including the hashed id of the apps used in a given month can be found at https://
doi.org/10.11583/DTU.13650797.v1. Additionally, we offer the possibility to reproduce our results by spending
a research visit at Sony Mobile Communications.
Estimating uniqueness. To estimate the uniqueness of app-fingerprints, we apply the unicity f ramework11
on s samples of 10,000 randomly selected individuals. For each individual we select n apps (without replace-
ment) from their app-fingerprint. With the popularity based attack, apps with low user base are selected to
increase the uniqueness of the app usage pattern. The person is then said to be unique if they are the only indi-
vidual in the dataset whose app-fingerprint contains those apps. In cases where n is larger the the total length
of a person’s app-fingerprint we instead select min(n, |fingerprint|) number of apps. Uniqueness for a sample si
is then estimated as the fraction of the users that have unique traces. Overall uniqueness is the average of the
s samples, and error-bars are given by the standard deviation. We use s = 20. To study cultural differences, we
apply the unicity framework above on s = 60 samples of 20,000 randomly selected individuals from the same
country (see Supplementary Information for other sample sizes).
Model of cultural differences. We model dependencies between country unicity and app-ecosystem
dependent and control variables as a linear model. To explore monotonic dependencies which not necessary are
linear, we rank transform all variables, such that rank 1 is the highest possible value of each variable. The model
is defined as U = β0 + βX + ǫ, where X is a matrix of the rank transformed variables, β0 is the intercept, and ǫ
denotes the residuals (see SI section 3.1 for details). To understand the uncertainty of our analysis, we bootstrap
over 10,000 samples to get 95% confidence intervals and report the average R2 value over the samples. We build
separate models for the random and popularity attack schemes using n = 5 apps.
Received: 21 July 2020; Accepted: 5 January 2021
References
1. Zuboff, S. The Age of Surveillance Capitalism: The Fight for the Future at the New Frontier of Power (Profile Books, London, 2019).
2. Agrawal, R., Imieliński, T. & Swami, A. Mining association rules between sets of items in large databases. SIGMOD Rec. 22, 207–216
(1993). https://doi.org/10.1145/170036.170072.
3. Chen, Y., Pavlov, D. & Canny, J. F. Large-scale behavioral targeting. In Proceedings of the 15th ACM SIGKDD International Confer-
ence on Knowledge Discovery and Data Mining 209–218 (ACM, 2009).
4. Mislove, A., Viswanath, B., Gummadi, K. P. & Druschel, P. You are who you know: Inferring user profiles in online social networks.
In Proceedings of the Third ACM International Conference on Web Search and Data Mining 251–260 (ACM, 2010).
5. Dodds, P. S. & Danforth, C. M. Measuring the happiness of large-scale written expression: Songs, blogs, and presidents. J. Happi-
ness Stud. 11, 441–456 (2010).
6. Conte, R. et al. Manifesto of computational social science. Eur. Phys. J. Spec. Top. 214, 325 (2012).
7. Lazer, D. et al. Computational social science. Science 323, 721–723 (2009).
8. Narayanan, A. & Shmatikov, V. Robust de-anonymization of large sparse datasets. In IEEE Symposium on Security and Privacy,
2008. SP 2008 111–125 (IEEE, 2008).
9. Blumberg, A.J. & Eckersley, P. On locational privacy, and how to avoid losing it forever. Electron. Front. Found. 10, 1–7 (2009).
10. Eckersley, P. How unique is your web browser? In International Symposium on Privacy Enhancing Technologies Symposium 1–18
(Springer, 2010).
Scientific Reports | (2021) 11:3861 | https://doi.org/10.1038/s41598-021-82294-1 7
Vol.:(0123456789)www.nature.com/scientificreports/
11. De Montjoye, Y.-A., Hidalgo, C. A., Verleysen, M. & Blondel, V. D. Unique in the crowd: The privacy bounds of human mobility.
Sci. Rep. 3, 1376 (2013).
12. De Montjoye, Y.-A., Radaelli, L., Singh, V. K. et al. Unique in the shopping mall: On the reidentifiability of credit card metadata.
Science 347, 536–539 (2015).
13. Mayer, J., Mutchler, P. & Mitchell, J. C. Evaluating the privacy properties of telephone metadata. Proc. Natl. Acad. Sci. 113,
201508081 (2016).
14. Eagle, N. & Pentland, A. S. Reality mining: Sensing complex social systems. Pers. Ubiquitous Comput. 10, 255–268 (2006).
15. Stopczynski, A. et al. Measuring large-scale social networks with high resolution. PLoS ONE 9, e95978 (2014).
16. International Telecommunication Union. Measuring the information society report (2018).
17. Intelligence, G. The Mobile Economy 2019 (GSM Association, London, 2019).
18. Enge, E. Mobile vs desktop usage: Mobile grows but desktop still a big player (2017). https://w ww.s tonet emple.c om/m
obile-v s-d
eskt
op-usage-mobile-grows-but-desktop-still-a-big-player/.
19. PageFair. The state of the blocked web—2017 global adblock report (2017). https://pagefair.com/blog/2017/adblockreport/.
20. Scoccia, G. L., Kanj, I., Malavolta, I. & Razavi, K. Leave my apps alone! A study on how android developers access installed apps
on user’s device. In Proceedings of the 7th IEEE/ACM International Conference on Mobile Software Engineering and Systems (2020).
21. Binns, R. et al. Third party tracking in the mobile ecosystem. In Proceedings of the 10th ACM Conference on Web Science 23–31
(2018).
22. Seneviratne, S., Seneviratne, A., Mohapatra, P. & Mahanti, A. Predicting user traits from a snapshot of apps installed on a smart-
phone. ACM SIGMOBILE Mob. Comput. Commun. Rev. 18, 1–8 (2014).
23. Malmi, E. & Weber, I. You are what apps you use: Demographic prediction based on user’s apps. In Tenth International AAAI
Conference on Web and Social Media (2016).
24. Ramirez, E., Brill, J., Ohlhausen, M. K., Wright, J. D. & McSweeny, T. Data brokers—A call for transparency and accountability.
Federal Trade Commission Tech. Report (2014). www.ftc.gov/system/files/documents/reports/data-brokers-call-transparency-
accountability-report-federal-trade-commission-may-2014/140527databrokerreport.pdf.
25. Kaggle. TalkingData Mobile User Demographics (accessed 2020-10-01); https://w ww.k aggle.c om/c/t alkin gdata-m
obile-u
ser-d
emog
raphics (2016).
26. Sweeney, L. K-anonymity: A model for protecting privacy. Int. J. Uncertain. Fuzziness Knowl. Based Syst. 10, 557–570 (2002).
27. Achara, J. P., Acs, G. & Castelluccia, C. On the unicity of smartphone applications. In Proceedings of the 14th ACM Workshop on
Privacy in the Electronic Society 27–36 (ACM, 2015).
28. AppBrain. Google Play statistics (accessed 2017-04-18); https://www.appbrain.com/stats (2017).
29. De Nadai, M., Cardoso, A., Lima, A., Lepri, B. & Oliver, N. Strategies and limitations in app usage and human mobility. Sci. Rep.
9, 10935 (2019).
30. Dunbar, R. I. Neocortex size as a constraint on group size in primates. J. Hum. Evol. 22, 469–493 (1992).
31. Alessandretti, L., Sapiezynski, P., Sekara, V., Lehmann, S. & Baronchelli, A. Evidence for a conserved quantity in human mobility.
Nat. Hum. Behav. 2, 485 (2018).
32. Barbaro, M., Zeller, T. & Hansell, S. A face is exposed for aol searcher no. 4417749. New York Times 9, 8For (2006).
33. Barth-Jones, D. C. The ‘re-identification’ of Governor William Weld’s medical information: a critical re-examination of health data
identification risks and privacy protections, then and now. Available at SSRN: https://ssrn.com/abstract=2076397 (2012).
34. Sweeney, L., Abu, A. & Winn, J. Identifying participants in the personal genome project by name. Available at SSRN: https://ssrn.
com/abstract=2257732 (2013).
35. Tockar, A. Riding with the stars: Passenger privacy in the nyc taxicab dataset. Neustar Research, September 15, 2014.
36. Kossinets, G. & Watts, D. J. Empirical analysis of an evolving social network. Science 311, 88–90 (2006).
37. Sekara, V., Stopczynski, A. & Lehmann, S. Fundamental structures of dynamic social networks. Proc. Natl. Acad. Sci. 113, 9977–9982
(2016).
38. Garcia, D. et al. Analyzing gender inequality through large-scale facebook advertising data. Proc. Natl. Acad. Sci. 115, 6958–6963
(2018).
39. Posner, R. A. The economics of privacy. Am. Econ. Rev. 71, 405–409 (1981).
40. Martin, K. The penalty for privacy violations: How privacy violations impact trust online. J. Bus. Res. 82, 103–116 (2018).
41. Regulation (EU) 2016/679 of 27 April 2016 on the protection of natural persons with regard to the processing of personal data
and on the free movement of such data, and repealing Directive 95/46/EC (General Data Protection Regulation). Off. J. Eur. Union
L119, 1–88 (2016).
42. Gulyás, G. G., Acs, G. & Castelluccia, C. Near-optimal fingerprinting with constraints. Proc. Priv. Enhanc. Technol. 2016, 470–487
(2016).
Acknowledgements
The authors would like to thank Sune Lehmann for useful discussions and feedback.
Author contributions
V.S. and H.J. conceived the study. V.S., L.A., E.M. and H.J. designed measures and analyses. V.S. collected and
curated the data. V.S., L.A., H.J. and E.M. conducted the analysis. All authors wrote the manuscript.
Competing interests
The authors declare no competing interests.
Additional information
Supplementary Information The online version contains supplementary material available at https://doi.org/
10.1038/s41598-021-82294-1.
Correspondence and requests for materials should be addressed to V.S. or H.J.
Reprints and permissions information is available at www.nature.com/reprints.
Publisher’s note Springer Nature remains neutral with regard to jurisdictional claims in published maps and
institutional affiliations.
Scientific Reports | (2021) 11:3861 | https://doi.org/10.1038/s41598-021-82294-1 8
Vol:.(1234567890)www.nature.com/scientificreports/
Open Access This article is licensed under a Creative Commons Attribution 4.0 International
License, which permits use, sharing, adaptation, distribution and reproduction in any medium or
format, as long as you give appropriate credit to the original author(s) and the source, provide a link to the
Creative Commons licence, and indicate if changes were made. The images or other third party material in this
article are included in the article’s Creative Commons licence, unless indicated otherwise in a credit line to the
material. If material is not included in the article’s Creative Commons licence and your intended use is not
permitted by statutory regulation or exceeds the permitted use, you will need to obtain permission directly from
the copyright holder. To view a copy of this licence, visit http://creativecommons.org/licenses/by/4.0/.
© The Author(s) 2021
Scientific Reports | (2021) 11:3861 | https://doi.org/10.1038/s41598-021-82294-1 9
Vol.:(0123456789)You can also read