16 years of topographic surveys of rip-channelled high-energy meso-macrotidal sandy beach - Nature
←
→
Page content transcription
If your browser does not render page correctly, please read the page content below
www.nature.com/scientificdata

               OPEN           16 years of topographic surveys
Data Descriptor               of rip-channelled high-energy
                              meso-macrotidal sandy beach
                                                    1✉
                              Bruno Castelle           , Stéphane Bujan1, Vincent Marieu          1
                                                                                                      & Sophie Ferreira2

                              Sandy beaches are highly dynamic environments buffering shores from storm waves and providing
                              outstanding recreational services. Long-term beach monitoring programs are critical to test and
                              improve shoreline, beach morphodynamics and storm impact models. However, these programs
                              are relatively rare and mostly restricted to microtidal alongshore-uniform beaches. The present 16-
                              year dataset contains 326 digital elevation models and their over 1.635 × 10⁶ individual sand level
                              measurements at the high-energy meso-macrotidal rip-channelled Truc Vert beach, southwest France.
                              Monthly to bimonthly topographic surveys, which coverage progressively extended from 300 m to
                              over 2000 m to describe the alongshore-variable changes, are completed by daily topographic surveys
                              acquired during a 5-week field campaign. The dataset captures daily beach response at the scale of a
                              storm to three large cycles of interannual variability, through the impact of the most energetic winter
                              since at least 75 years and prominent seasonal erosion/recovery cycles. The data set is supplemented
                              with high-frequency time series of offshore wave and astronomical tide data to facilitate its future use in
                              beach research.

                              Background & Summary
                              Sandy beaches buffer shores from storm waves and surge. They constantly evolve in response to storm, seasonal,
                              and interannual variations in incident wave conditions1,2, anthropogenic forcings3–5, changes in natural sand
                              supply6,7, to morphological adjustment of nearby tidal inlets or estuary mouth8,9, with sometimes a profound
                              influence of geological settings7,10–13. Permanent video stations can infer daily shoreline proxy at reasonably low
                              cost over years/decades14,15. However, the more costly sand level measurements can provide more accurate and
                              richer insight into beach change through quantification of e.g. beach volume16–18, beach state and shape19,20 or
                              shoreline position for different proxies in tidal environments2,21. Multi-annual/decadal high-resolution (months)
                              topographic datasets of sandy beach systems are, however, scarce. They are limited to microtidal environ-
                              ments22–24, alongshore-uniform beaches25–27, and/or sectors influenced by coastal structures28–30 and/or by beach
                              nourishment30. Monitoring programs of meso- to macro-tidal beaches are based on single of widely spaced tran-
                              sect(s)17,31–33, with the exception of the embayed beach of Perranporth, UK34. Depending on sand grain size and
                              the tide range relative to modal wave conditions35, meso-macrotidal surf beaches can exhibit a strongly along-
                              shore non-uniform intertidal and subaerial morphology due to the presence of rip channels, with a typical length-
                              scale of 100 s of meters36. Therefore, such beaches need to be surveyed with adequately spaced transects and large
                              enough spatial coverage to comprehensively describe morphological changes.
                                  Truc Vert is a high-energy meso-macrotidal sandy beach located in southwest France (Fig. 1). It is a remote
                              beach located more than three kilometers from the first inland carpark beach entry. Apart from the backing
                              coastal dune which has been reprofiled in the early 80 s37, Truc Vert has never been nourished or affected by hard
                              structures and tourism. This motivated the first topographic measurements in the late 90 s, surveying irregularly
                              in time a single profile with a theodolite38. Only in 2003 when a RTK-GNSS receiver was acquired, equipping
                              an ATV since 2005, did the surveys were set monthly and the spatial coverage increased to 300 m. The surveys
                              subsequently became bimonthly, with the alongshore coverage increasing over the years before stabilizing at
                              approximately 2200 m. This dataset was used, for instance, to develop beach state classification39,40, to address
                              the intense beach-dune erosion and recovery from the outstanding winter of 2013/201417,18,41–43 and to address
                              the links between the dominant modes of climate variability on beach response18. It was also used to develop and

                              1
                                CNRS/Univ. de Bordeaux, UMR EPOC, Talence, France. 2CNRS/Univ. de Bordeaux, UMS POREA, Talence, France.
                              ✉e-mail: bruno.castelle@u-bordeaux.fr

  Scientific Data |   (2020) 7:410 | https://doi.org/10.1038/s41597-020-00750-5                                                                1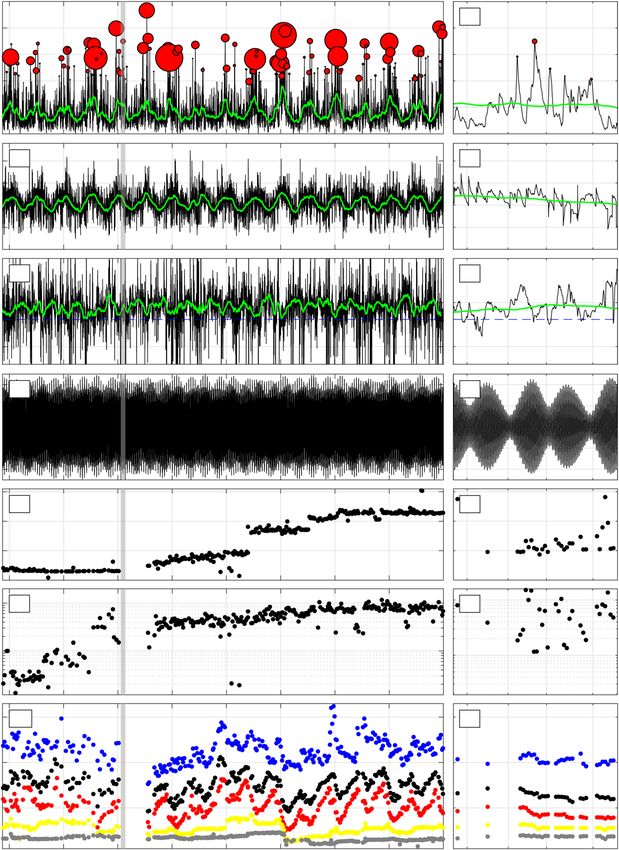
www.nature.com/scientificdata/ www.nature.com/scientificdata
44.76
45.5° (a) 20 km (b) (d)
45.25° 44.755
Latitude
45°
Truc Vert 44.75
44.75°
Wave
44.5° buoy
Latitude (°)
44.745
3500 m
44.25°
xl
-1.25° -0.75° -0.25° 0
Longitude 44.74
yl
(c)
44.735
44.73
-1.255° -1.25° -1.245° -1.24° -1.235°
Longitude (°)
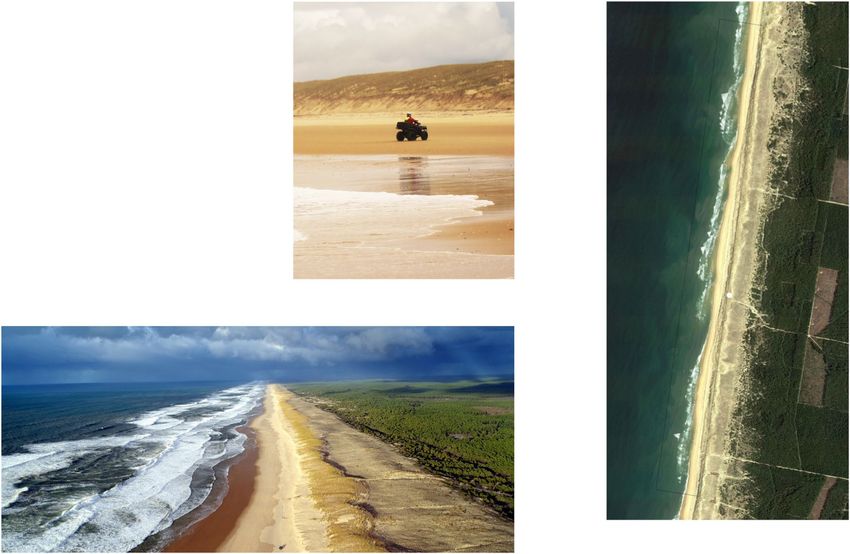
Fig. 1 Survey site. (a) Location map of Truc Vert beach, southwest France with location of nearby wave buoy.
(b) GNSS-equipped ATV used to perform the monthly to bimonthly surveys since 2003. (c) Aerial view
showing the remote Truc Vert beach with prominent rip channels. (d) Survey zone and reference frame used at
Truc Vert beach.
improve a range of state-of-the art shoreline change models from the time scale of hours to decades2,21,44,45, to vali-
date remotely-sensed shoreline estimation from publicly available satellite images46, to identify the morphological
controls on spine injuries and drowning on surf beaches47,48, and to address the uncertainties in past and future
multi-decadal shoreline evolutions49,50. In addition, a couple of intensive field experiments have been performed
at Truc Vert beach51. In particular, in 2008 during the 5-week ECORS field measurements52 Truc Vert beach was
surveyed daily to capture beach changes at the scale of a single storm53.
The bimonthly beach morphology survey program at Truc Vert exceeded 16 years in 2020. It covers a wide
range of storms and of isolated extreme events53, an anomalous winter with severe storm clustering17,41 and a few
cycles of large interannual beach variability. This monitoring program is also entering a new era as, since 2016,
4 km of coastal dunes are now surveyed at least quarterly54,55, together with notches dug in the dune to reinstate
dune mobility and address plant community restoration along with biological monitoring37. With the growing
interest in long-term beach datasets23,30 and growing need of validation data for a wealth of coastal models56, it is
timely to facilitate the unrestricted use of this unique high-energy meso-macrotidal beach dataset, including the
daily surveys during the ECORS’08 field campaign. The archived dataset includes all the raw survey points and
suitably interpolated digital elevation models (DEMs), and time series of astronomical tide and offshore wave
forcing. The beach survey dataset will be updated on a dedicated repository on an annual basis.
We anticipate that this dataset will be of interest for coastal modellers working on shoreline change, rip chan-
nel morphodynamics and beach erosion and recovery from the time scale of day to decades. In particular, with
the recent development of tens of hybrid shoreline change models, this dataset is an ideal benchmark to test and
compare shoreline models and perform ensemble-based simulations56 and probabilistic shoreline forecast. It will
also be used for validation of satellite remote sensing data of coastal change, which is particularly challenging in
meso-macrotidal energetic environments46.
Methods
Study site. The remote beach of Truc Vert is located in southwest France (Fig. 1a,c). The ocean wave exposed
coastline of southwest France covers approximately 270 km of sandy beaches, which are backed by vegetated
coastal dunes57,58, except along a few small coastal resorts9. The wave climate is generated in the north Atlantic
Ocean predominantly by eastward tracking extra tropical cyclones44,59. Incident wave energy is strongly season-
ally modulated with the monthly-averaged significant wave height Hs (peak wave period Tp) ranging from 1.11 m
(9 s) in July, with a dominant west-northwest direction, to 2.4 m (12.8 s) in January, with a dominant west direc-
tion42. Boreal winter wave activity and storms also show a strong interannual variability, with moderate winters
Scientific Data | (2020) 7:410 | https://doi.org/10.1038/s41597-020-00750-5 2www.nature.com/scientificdata/ www.nature.com/scientificdata
alternating with extreme winters characterised by spatial and temporal severe storm clustering17,41. This large
interannual variability is driven by natural modes of climate variability, particularly the West Europe Pressure
Anomaly60. Positive WEPA reflects the intensification and southward shift of the sea level pressure gradient
between the Azores high and the Icelandic low. This interannual variability in incident wave energy shows a sig-
nificant increase in winter-mean wave height, variability, and periodicity over the last 70 years61.
Truc Vert beach is meso-macrotidal. The tide is semi-diurnal, with an annual mean spring tidal range of
approximately 3.7 m and a largest astronomical tidal range of approximately 5 m42. Nearshore tide-driven currents
are, however, negligible compared to wave-driven currents except for extremely low-energy waves and large tide
range in the vicinity of the rip channels62.
The sediment consists primarily of medium quartz sand with a median diameter of approximately 350 μm63,64.
Beach sediment exhibits a large variability of 200–700 μm correlated with a wide range of bedforms including
bar/rip channels, cusps and megaripples65. Truc Vert beach is intermediate double barred39. The outer bar is
subtidal and modally crescentic66,67, while the inner intertidal bar is classified modally as transverse bar and rip
and tending to low tide terrace in summer40. The inner and outer bar mean rip spacing is approximately 400 and
700 m, respectively, although with large spatial and temporal variability68. The inner-bar rip channels enforce a
large alongshore variability in beach morphology43 with megacusp embayment facing rip channels throughout
the year. In contrast, the outer bar can drive larger scale beach variability under severe storms, which can poten-
tially persist for years41,43.
Truc Vert beach is located in an approximately 20-km sector where the dune foot shoreline has been relatively sta-
ble over the last 70 years, in contrast with chronically eroding sectors further north9. However, the recent 2013/2014
winter, which was exceptional in terms of storminess and wave energy along the Atlantic coast of Europe17,69, caused
severe beach and dune erosion at Truc Vert41,42. Erosion was highly variable alongshore, with the formation of local-
ized megacusp embayments enforced by the outer bar variability in both depth and cross-shore position, with the
erosion dune scarp height exceeding 6 m in its centre where the dune retreat reached 30 m.
Topographic surveys. Monthly to bimonthly monitoring program. Topographic surveys have been per-
formed from September 2003 until December 2019, with a 1-year gap in 2008 due to equipment breakdown. This
corresponds to 295 beach topographic surveys in 16.25 years. Topographic surveys were conducted at spring low
tide using a RTK-GNSS by running cross-shore transects and, most of the time, a couple of alongshore transects
depicting relevant features such as low tide mark, berm crest and dune toe (Fig. 2a). The distance between each
transect varied roughly from 20 to 80 m, depending on local beach morphological patterns to be depicted and
on the alongshore length covered. Most of the time, the inner bar was not entirely surveyed in the cross-shore
direction as the water level was too high (wave runup) and/or the bar crest was too low. Sand level elevation was
referenced to benchmarks of the French National Geodesic Service (NGF-IGN 69), which was transformed into
elevation relative to MSL by substracting 0.4 m.
Spatial interpolation of sand level measurements is required to both generate a DEM on a given grid and to
further compute the alongshore-averaged beach profile. For this, we first designed a regular grid in local coor-
dinates (Fig. 1d), which has been used in most Truc Vert beach morphological studies21,41–43,54,67. In this local
scheme, the cross-shore xl coordinate is positive onshore and the alongshore yl coordinate is positive to the south,
with the xy origin being the ECORS’08 camera system position. The angle of rotation between the north and the
yl axis in the local scheme is 10.8°. In order to accurately depict the prominent megacusps and rip channels at
Truc Vert and to cope with occasional highly irregular survey transects (in both the cross-shore and alongshore
directions, see for instance Fig. 2a), ordinary kriging with anisotropy70 was used. The semi-variogram model was
based on the von Karman auto-covariance function, with an exponent v = 0.7. For each survey a mask was also
designed which, together with anisotropic interpolation, prevented from the formation of spurious interpolation
in the deep rip channels that were not surveyed, and spurious cuspate features with a spacing equalling that of the
transects at the limits of the survey area. Interpolation was performed on a regular grid (Fig. 1d) with an along-
shore and cross-shore mesh size of 20 m and 2 m, respectively, with an anisotropy ratio between xl and yl direc-
tions set to 10 (see an example of generated DEM in Fig. 2a,c). Such local scheme and interpolation technique
enable to robustly address the alongshore variability in beach profile along the entire beach and to easily compute
relevant alongshore-averaged beach proxies (Fig. 2b).
The alongshore coverage increased over time in line with the evolution of the arising research questions
(Fig. 3i). The alongshore coverage of the topographic surveys was about 350 m from 2003 to 2008, to between 600
and 1000 m from 2009 to 2013, to approximately 1700 m from 2013 to 2015, to approximately 2000 m in 2015
before stabilizing at approximately 2200 m since early 2016 (Fig. 3i). Since 2009, this corresponds to thousands of
sand level measurements per survey, with an average of approximately 7500 since 2015 (Fig. 3k), for a total of over
1.456 × 10⁶ points. Figure 3m shows the time series of different shoreline proxies defined as the intersection of the
alongshore-averaged profile with a given elevation datum. Seasonal cycles are prominent in the shoreline position
for proxies z = 1.5 m and 3 m with typical amplitude of approximately 50 m. In contrast, shoreline proxy z = 6 m,
which approximately corresponds to the dune toe position barely evolves and only retreated rapidly during the
outstanding winter of 2013/2014.
ECORS’08 experiment. The ECORS’08 experiment was a 5-week large multi-institutional nearshore field exper-
iment conducted at Truc Vert from March 3 to April 8, 200852. During this experiment, almost daily topographic
surveys were collected71. In addition to the ATV survey areas, a walking operator also sometimes collected topo-
graphic data in moderate water depths. Here we analysed the topographic dataset and the couple of topographic
surveys performed just before this experiment using the same method as detailed above. The alongshore cov-
erage of the surveys was irregular but was at least 1000 m (Fig. 3j), for a total of 31 surveys made on average of
approximately 5800 individual sand elevation measurements (Fig. 3l). Due to the sequence of storms during the
Scientific Data | (2020) 7:410 | https://doi.org/10.1038/s41597-020-00750-5 3www.nature.com/scientificdata/ www.nature.com/scientificdata
6
(a) (c)
1000
Alongshore distance yl (m)
5
500
0 4
-500
3
Elevation (m)
Northing
-1000
2
8
(b) 1
6
Elevation z (m)
4 0
100 m
2
-1
0
-2 -2
50 100 150 200 250 300 Easting
Cross-shore distance xl (m)
Fig. 2 Example of topographic survey product. (a) Example of Truc Vert beach survey with colour bar and grey
dots indicating AMSL elevation in metres and individual survey points, respectively, (b) superimposed 20-m
spaced beach profiles (grey) and their alongshore average (black) with the horizontal error bars indicating the
±1 cross-shore standard deviation, (c) axis equal DEM.
experiment, erosion of the upper part of the beach was observed, as well as large changes in alongshore variable
morphology (not shown). This daily morphological dataset complements the monthly to bimonthly long term
monitoring program.
Waves. Because there is no continuous wave buoy measurements nearby Truc Vert covering the entire mon-
itoring period, we resorted to 20 years of continuous hourly numerical wave hindcast (2000–2019) to estimate
incident wave conditions. We used the grid point co-located with the CANDHIS directional wave buoy located
(1° 26.8′W, 44° 39.15′N in Fig. 1a) moored in approximately 54-m depth, which intermittently collected direc-
tional wave measurements since 2001. Data from two spectral wave model Wavewatch III (WW372) hindcasts
implemented on the same unstructured grid were combined, with a resolution increasing from 10 km offshore to
200 m along the French Atlantic coast73,74. To further improve the accuracy of the wave forcing at Truc Vert, wave
hindcast was corrected against the CANDHIS buoy measurements (see Section Technical Validation).
Astronomical tides. Astronomical tides were derived at 10-min intervals using the tidal analysis package
T Tide. A coastal hydrodynamic hindcast of the Bay of Biscay75 was used. Tide hindcast offshore of Truc Vert in
approximately 7-m depth at spring low tide from January 2006 to January 2020 was used to perform the harmonic
analysis. The tide time series was validated against 20 days of interspersed tide measurements offshore of Truc
Vert during the ECORS’08 measurements.
Data Records
The data can be obtained from the Open Science Framework Repository76. All files are in NetCDF format77, and
provide detailed metadata for each variable within the file, using CF (Climate and Forecast) conventions 1.8 with
Standard Name Table v75. The core data set in the repository is formed by 326 DEMs, all interpolated on the
same regular grid, along with their raw sand level measurements from September 10, 2003 to December 26, 2019.
Surveys performed in the frame of the long-running monitoring program are discriminated from those collected
Scientific Data | (2020) 7:410 | https://doi.org/10.1038/s41597-020-00750-5 4www.nature.com/scientificdata/ www.nature.com/scientificdata
10
(b)
8
6
Hs (m)
4
2
0
20 (c) (d)
15
Tp (s)
10
5
0
350
(e) (f)
300
θ (°)
250
2
(g) (h)
1
η (m)
0
-1
-2
3000
(i) (j)
2000
W (m)
1000
0
10 4 (k) (l)
Nd
10 3
200 (m) (n)
150
S (m)
100
2004 2006 2008 2010 2012 2014 2016 2018 Feb 15 Mar 1 Mar 15 Apr 1
Date Date (2018)
Fig. 3 Time series products for the long-term monitoring program (left-hand panels) and ECORS’08 field
experiment (right-hand panels). (a,b) Hs with bubbles indicating storm events (Hs > Hs95%, whereby the size of
the bubbles is proportional to storm duration based on Hs75% cut-off either size of storm maximum, (c,d) Tp, (e,f)
θ with their 2-month moving average shown in thick green) and in (e,f) the dashed blue line indicating shore-
normal incidence at Truc Vert (280.8°). (g,h) (b) η, (i,j) survey alongshore coverage, (k,l) number of collected
sand elevation points, (m,n) mean shoreline cross-shore position for different proxies z = 0, 2, 4 and 6 m.
daily during the ECORS’08 experiment. The metadata of the topographic surveys are given in Table 1. This dataset
is completed with hourly time series of wave conditions co-located with the offshore CANDHIS buoy in 54-m
depth, and astronomical tide levels at 10-min interval (Table 2). Given that some shoreline change models need
wave conditions up to 3 years prior to the start of shoreline measurements to accurately compute equilibrium
Scientific Data | (2020) 7:410 | https://doi.org/10.1038/s41597-020-00750-5 5www.nature.com/scientificdata/ www.nature.com/scientificdata
Dataset Parameter [unit] Number of files Data file(s)
Grid coordinates long[°], latg[°], xlg[m], ylg[m], xg[m], yg[m] 1 Grids.nc
ECORS’08 topographic data lon[°], lat[°], xl[m], yl[m], x[m], y[m], z[m], zg[m] 31 ECORS08_TrucVert_yyyy-mm-dd.nc
Monitoring topographic data lon[°], lat[°], xl[m], yl[m], x[m], y[m], z[m], zg[m] 295 Monitoring_TrucVert_yyyy-mm-dd.nc
Table 1. Datasets. Beach surveys with individual elevation sand level measurements and DEMs.
Sample
Dataset Parameter [unit] Time series frequency Data file
Astronomical tide tideTime[days], Tide[m] 01/2000–01/2020 10 min Astronomical_Tide_TrucVert_2000–2020.nc
waveTime[days],
Waves waveHs[m], waveTp[s], 01/2000–01/2020 1 hr Waves_TrucVert_2000–2020.nc
waveDm[°]
Table 2. Datasets. Wave condition and astronomical tide.
conditions2,21,50, wave and tide time series start on January 1, 2000, that is, more than three years before the first
topographic survey.
Technical Validation
Topographic surveys. All sand level measurements were performed using a RTK-GNSS (Trimble 5700
then Trimble NetR9 for the reference receiver, and Trimble R6 then Trimble R8s for the mobile GNSS receiver)
equipping the ATV (Fig. 1b). The horizontal and vertical accuracy is 8 mm and 15 mm, respectively. However,
given that additional small errors can be due to e.g. antenna positioning, presence of ripples and megaripples, an
accuracy of approximately 2.5 cm in the horizontal and 10 cm in the vertical is conservative. All surveys recorded
the position of a fixed reference point on the top of dune, which was used for vertical and horizontal accuracy
verification on each survey. All surveys were quality checked. Rare survey points outliers were manually removed.
Eight topographic surveys were removed from the current dataset due to RTK-GNSS malfunctions and varying,
irredeemable, elevation drift in time. The spatial interpolation to generate the DEM can also result in vertical
errors. A comparison (not shown) on a 600-m stretch of Truc Vert beach of the DEM generated from a topo-
graphic survey performed on September 18, 2020 with that using high-resolution UAV-photogrammetry DEM54
performed the same day shows standard error of 7 cm. Therefore we estimate that the interpolation error is well
under 10 cm. Raw sand level measurements are provided so that scientists can test other interpolation techniques.
Wave hindcast. The HOMERE73 (1994–2017) and NORGAS-UG74 (2008–2019) hindcasts were combined.
HOMERE and NORGAS-UG hindcasts have been extensively validated with directional buoys and satellite
altimeters, showing excellent skill73,74. We provided additional correction by calibrating wave conditions offshore
of Truc Vert against the wave buoy measurements. We used in situ wave data collected intermittently between
January 2008 and October 2019 resulting in a total of approximately 8.5 years of hourly wave data (n = 73,672).
Peak wave period, significant wave height and mean wave direction were linearly regressed against measure-
ments. After correction, Hs hindcast shows strong agreement with measured wave data with for HOMERE
(NORGAS-UG) a coefficient of determination R2 = 0.94 (0.93) and a root mean square error RMSE = 0.25 m
(0.26 m). Accuracy decreases for Tp (R2 = 0.25, RMSE = 1.7 s for HOMERE and R2 = 0.37, RMSE = 1.6 s for
NORGAS-UG). The decrease in accuracy for Tp can be partly explained by discontinuities in measured and
modelled peak wave period data, which can vary substantially under mixed sea/swell regimes and when there is
bimodality in the wave spectra. Corrected mean wave direction hindcast showed good agreement, with R2 = 0.71,
RMSE = 9.5° for both HOMERE and NORGAS-UG. The resulting continuous corrected wave time series com-
bines HOMERE (2000–2017) and NORGAS-UG (2018–2019) corrected hindcasts.
Tide levels. Tide hindcast was validated against approximately 20 days of interspersed water level measure-
ment at 5-min interval collected at Truc Vert during the ECORS’08 measurements. Given that these measure-
ments also include non-tidal residuals, the non-tidal residuals of the hindcast were included in the comparison.
Water levels show a very good agreement with measured tide with R2 = 0.99 and RMSE = 0.12 m. It is important
to note that this validation was characterised by high waves and storm winds, with storm surge reaching 0.22 m.
Usage Notes
Tide data. The astronomical tide data does not take into account non-tidal effects on sea levels such as storm
surge, which can be estimated using coastal model hindcast. The 2006–2020 hindcast from the MARC platform
indicates that such non tidal effects in water level at Truc Vert are small, with a standard deviation of 0.09 m and
a maximum of 0.6 m occurring on February 28, 2010 at 2AM during the peak of storm Xynthia. In addition, in
order to estimate shoreline water levels at the shore, the user must account for wave setup or runup that is not
observed in such water level hindcast, but can be estimated from the wave time series with wave set-up or runup
empirical formulas78.
Scientific Data | (2020) 7:410 | https://doi.org/10.1038/s41597-020-00750-5 6www.nature.com/scientificdata/ www.nature.com/scientificdata
Wave data. Wave conditions are provided approximately 10 km from the coast in 54-m depth, offshore of
Truc Vert. Given that the offshore bathymetry is essentially uniform alongshore, wave dissipation and alongshore
variability of inshore wave energy enforced by offshore wave refraction is limited. Therefore wave conditions
computed at the Candhis buoy can be considered as a good proxy for the wave conditions arriving at Truc Vert42.
Estimation of breaking wave conditions can however be performed using computationally cheap empirical for-
mula (e.g79) owing to the shore-parallel bathymetric iso-contours, like for instance in50.
Sand elevation data. The DEMs provide ready-to-use binned morphological data on a relevant local grid,
which can be easily processed to derive a wealth of alongshore-variable or alongshore-averaged morphological
proxies. However, the raw sand elevation data provided along with the DEMs can be used directly or combined
with other interpolation techniques.
Complementary dataset. Additional wave buoy data at http://candhis.cetmef.developpement-durable.
gouv.fr/. Additional tide data at http://refmar.shom.fr/en/ARCACHON_EYRAC. Additional sea level and
storm surge hindcast from the MARC platform (Modelling and Analysis for Research in Coastal environment)
at https://marc.ifremer.fr. Additional Lidar topographic data at http://www.observatoire-cote-aquitaine.fr/
Mise-en-ligne-de-l-ensemble-des-millesimes-LiDAR. Bathymetric data collected during the ECORS’08 field
experiment at Truc Vert can be provided by the first author upon request.
Code availability
All data files created and used in processing are formatted in the Network Common Data Form (NetCDF),
providing detailed metadata for each variable within the file, and can be read using MATLAB, Python, Fortran,
C, C++, Java, and other languages. A Code file used to interpolate the raw sand elevation data is included in
the repository folder. Code is written in MATLAB (R2019a) and is fully commented. Although MATLAB is a
proprietary language, the.m files can be read with a text viewer.
Received: 14 August 2020; Accepted: 29 October 2020;
Published: xx xx xxxx
References
1. Yates, M. L., Guza, R. T. & O’Reilly, W. C. Equilibrium shoreline response: Observations and modeling. Journal of Geophysical
Research 114 (2009).
2. Splinter, K. D. et al. A generalized equilibrium model for predicting daily to interannual shoreline response. Journal of Geophysical
Research 119 (2014).
3. Ranasinghe, R. & Turner, I. L. Shoreline response to submerged structures: A review. Coastal Engineering 53, 65–79 (2006).
4. Ojeda, E., Ruessink, B. & Guillen, J. Morphodynamic response of a two-barred beach to a shoreface nourishment. Coastal
Engineering 55, 1185–1196 (2008).
5. Garel, E., Sousa, C., Ferreira, O. & Morales, J. Decadal morphological response of an ebb-tidal delta and down-drift beach to artificial
breaching and inlet stabilisation. Geomorphology 216, 13–25 (2014).
6. Aagaard, T., Davidson-Arnott, R., Greenwood, B. & Nielsen, J. Sediment supply from shoreface to dunes: linking sediment transport
measurements and long-term morphological evolution. Geomorphology 60, 205–224 (2004).
7. Cooper, J. A. G. & Pilkey, O. H. Sea-level rise and shoreline retreat: time to abandon the Bruun Rule. Global and Planetary Change
43, 157–171 (2004).
8. de Swart, H. & Zimmerman, J. Morphodynamics of tidal inlet systems. Annual Review of Fluid Mechanics 41, 203–229 (2009).
9. Castelle, B. et al. Spatial and temporal patterns of shoreline change of a 280-km high-energy disrupted sandy coast from 1950 to
2014: Sw france. Estuarine, Coastal and Shelf Science 200, 212–223 (2018).
10. Schupp, C. A., McNinch, J. E. & List, J. H. Nearshore shore-oblique bars, gravel outcrops, and their correlation to shoreline change.
Marine Geology 233, 63–79 (2006).
11. Gallop, S. L., Bosserelle, C., Pattiaratchi, C. & Eliot, I. Rock topography causes spatial variation in the wave, current and beach
response to sea breeze activity. Marine Geology 290, 29–40 (2011).
12. Loureiro, C., Ferreira, O. & Cooper, J. A. G. Geologically constrained morphological variability and boundary effects on embayed
beaches. Marine Geology 329–331, 1–15 (2012).
13. Robinet, A., Castelle, B., Idier, D., Harley, M. & Splinter, K. Controls of local geology and cross-shore/longshore processes on
embayed beach shoreline variability. Marine Geology 422, 106118 (2020).
14. Harley, M. D., Turner, I. L., Short, A. D. & Ranasinghe, R. Assessment and integration of conventional, rtk-gps and image-derived
beach survey methods for daily to decadal coastal monitoring. Coastal Engineering 58, 194–205 (2011).
15. Pianca, C., Holman, R. & Siegle, E. Shoreline variability from days to decades: Results of long-term video imaging. Journal of
Geophysical Research: Oceans 120, 2159–2178 (2015).
16. Scott, T. et al. The extreme 2013/2014 winter storms: Beach recovery along the southwest coast of england. Marine Geology 382,
224–241 (2016).
17. Masselink, G. et al. Extreme wave activity during 2013/2014 winter and morphological impacts along the Atlantic coast of Europe.
Geophysical Research Letters 43, 2135–2143 (2016).
18. Dodet, G. et al. Beach recovery from extreme storm activity during the 2013-2014 winter along the atlantic coast of europe. Earth
Surface Processes and Landforms 44, 393–401 (2019).
19. Brander, R. W. Field observations on the morphodynamic evolution of a low-energy rip current system. Marine Geology 157,
199–217 (1999).
20. van Gaalen, J. F., Kruse, S. E., Coco, G., Collins, L. & Doering, T. Observations of beach cusp evolution at melbourne beach, florida,
usa. Geomorphology 129, 131–140 (2011).
21. Castelle, B. et al. Equilibrium shoreline modelling of a high-energy meso-macrotidal multiple-barred beach. Marine Geology 347,
85–94 (2014).
22. Wijnberg, K. M. & Terwindt, J. H. Extracting decadal morphological behaviour from high-resolution, long-term bathymetric
surveys along the holland coast using eigenfunction analysis. Marine Geology 126, 301–330 (1995).
23. Turner, I. et al. A multi-decade dataset of monthly beach profile surveys and inshore wave forcing at narrabeen, australia. Scientific
Data 3 (2016).
Scientific Data | (2020) 7:410 | https://doi.org/10.1038/s41597-020-00750-5 7www.nature.com/scientificdata/ www.nature.com/scientificdata
24. Quartel, S., Kroon, A. & Ruessink, B. G. Seasonal accretion and erosion patterns of a microtidal sandy beach. Marine Geology 250,
19–33 (2008).
25. Rozynski, G. Long-term shoreline response of a nontidal, barred coast. Coastal Engineering 52, 79–91 (2005).
26. Ruessink, B. G., Pape, L. & Turner, I. L. Daily to interannual cross-shore sandbar migration: Observatuions from a multiple bar
system. Continental Shelf Research 29, 1663–1677 (2009).
27. Kuriyama, Y. Process-based one-dimensional model for cyclic longshore bar evolution. Coastal Engineering 62, 48–61 (2012).
28. Larson, M. & Kraus, N. C. Temporal and spatial scales of beach profile change, duck, north carolina. Marine Geology 117, 75–94
(1994).
29. Kuriyama, Y. Medium-term bar behavior and associated sediment transport at Hasaki, Japan. Journal of Geophysical Research 107
(2002).
30. Ludka, B. et al. Sixteen years of bathymetry and waves at san diego beaches. Scientific data 6, 161 (2019).
31. de Alegria-Arzaburu, A. R. & Masselink, G. Storm response and beach rotation on a gravel beach, slapton sands, U.K. Marine
Geology 278, 77–99 (2010).
32. Suanez, S., Cariolet, J.-M., Cancouet, R., Ardhuin, F. & Delacourt, C. Dune recovery after storm erosion on a high-energy beach:
Vougot beach, brittany (france). Geomorphology 139–140, 16–33 (2012).
33. Lemos, C. et al. Equilibrium modeling of the beach profile on a macrotidal embayed low tide terrace beach. Ocean Dynamics 68,
1207–1220 (2018).
34. Stokes, C., Davidson, M. & Russell, P. Observation and prediction of three-dimensional morphology at a high-energy macrotidal
beach. Geomorphology 243, 1–13 (2015).
35. Masselink, G. & Short, A. D. The effect of tide range on beach morpho-dynamics and morphology: a conceptual model. Journal of
Coastal Research 9, 785–800 (1993).
36. Brander, R. & Short, A. Morphodynamics of a large-scale rip current system at muriwai beach, new zealand. Marine Geology 165,
27–39 (2000).
37. Castelle, B. et al. Nature-based solution along high-energy eroding sandy coasts: preliminary tests on the reinstatement of natural
dynamics in reprofiled coastal dunes. Water 11 (2019).
38. de Melo Apoluceno, D., Howa, H., Dupuis, H. & Oggian, G. Morphodynamics of ridge and runnel systems during summer. Journal
of Coastal Research SI 36, 222–230 (2002).
39. Castelle, B., Bonneton, P., Dupuis, H. & Sénéchal, N. Double bar beach dynamics on the high-energy meso-macrotidal French
Aquitanian Coast: a review. Marine Geology 245, 141–159 (2007).
40. Sénéchal, N. et al. Morphodynamic response of a meso- to macro-tidal intermediate beach based on a long-term dataset.
Geomorphology 107, 263–274 (2009).
41. Castelle, B. et al. Impact of the winter 2013–2014 series of severe Western Europe storms on a double-barred sandy coast: Beach and
dune erosion and megacusp embayments. Geomorphology 238, 135–148 (2015).
42. Castelle, B., Bujan, S., Ferreira, S. & Dodet, G. Foredune morphological changes and beach recovery from the extreme 2013/2014
winter at a high-energy sandy coast. Marine Geology 385, 41–55 (2017).
43. Castelle, B., Marieu, V. & Bujan, S. Alongshore-variable beach and dune changes on the timescales from ays (storms) to decades
along the rip-dominated beaches of the gironde coast. Journal of Coastal Research SI 88, 157–171 (2019).
44. Robinet, A. et al. Statistical modeling of interannual shoreline change driven by North Atlantic climate variability spanning 2000-
2014 in the Bay of Biscay. Geo-Marine Letters 1–12 (2016).
45. Robinet, A., Idier, D., Castelle, B. & Marieu, V. A reduced-complexity shoreline change model combining longshore and cross-shore
processes: The lx-shore model. Environmental Modelling & Software 109, 1–16 (2018).
46. Vos, K., Harley, M. D., Splinter, K. D., Simmons, J. A. & Turner, I. L. Sub-annual to multi-decadal shoreline variability from publicly
available satellite imagery. Coastal Engineering 150, 160–174 (2019).
47. Castelle, B. et al. Environmental controls on surf zone injuries on high-energy beaches. Natural Hazards and Earth System Sciences
19, 2183–2205 (2019).
48. Castelle, B. et al. Wave and tide controls on rips current activity and drowning incidents in southwest france. Journal of Coastal
Research SI 95, 769–774 (2020).
49. Le Cozannet, G. et al. Quantifying uncertainties of sandy shoreline change projections as sea level rises. Scientific Reports 9 (2019).
50. D’Anna, M. et al. Impact of model free parameters and sea-level rise uncertainties on 20-years shoreline hindcast: the case of truc
vert beach (sw france). Earth Surface Processes and Landforms n/a (2020).
51. Castelle, B. et al. Dynamics of wave-induced currents over an alongshore non-uniform multiple-barred sandy beach on the
Aquitanian Coast, France. Continental Shelf Research 26, 113–131 (2006).
52. Sénéchal, N. et al. The ECORS-Truc Vert’08 nearshore field experiment: presentation of a three-dimensional morphologic system in
a macro-tidal environment during consecutive extreme storm conditions. Ocean Dynamics 61, 2073–2098 (2011).
53. Coco, G. et al. Beach response to a sequence of extreme storms. Geomorphology 204, 493–501 (2014).
54. Laporte-Fauret, Q. et al. Low-cost uav for high-resolution and large-scale coastal dune change monitoring using photogrammetry.
Journal of Marine Science and Engineering 7 (2019).
55. Laporte-Fauret, Q. et al. Coastal dune morphology evolution combining lidar and uav surveys, truc vert beach 2011–2019. Journal
of Coastal Research 95, 163–167 (2020).
56. Montaño, J. et al. Blind testing of shoreline evolution models. Scientific Reports 10 (2020).
57. Laporte-Fauret, Q. et al. Classification of atlantic coastal sand dune vegetation using in situ, uav, and airborne hyperspectral data.
Remote Sensing 12 (2020).
58. Lerma, A. N. et al. Pluriannual beach-dune evolutions at regional scale: Erosion and recovery sequences analysis along the aquitaine
coast based on airborne lidar data. Continental Shelf Research 189, 103974 (2019).
59. Charles, E. et al. Present wave climate in the bay of biscay: Spatiotemporal variability and trends from 1958 to 2001. Journal of
Climate 25, 2020–2039 (2012).
60. Castelle, B., Dodet, G., Masselink, G. & Scott, T. A new climate index controlling winter wave activity along the atlantic coast of
europe: The west europe pressure anomaly. Geophysical Research Letters 44, 1384–1392 (2017).
61. Castelle, B., Dodet, G., Masselink, G. & Scott, T. Increased winter-mean wave height, variability, and periodicity in the northeast
atlantic over 1949-2017. Geophysical Research Letters 45, 3586–3596 (2018).
62. Bruneau, N., Bertin, X., Castelle, B. & Bonneton, P. Tide-induced flow signature in rip currents on a meso-macrotidal beach. Ocean
Modelling 74, 53–59 (2014).
63. Lorin, J. & Viguier, J. Hydrosedimentary conditions and present evolution of aquitaine coast. Bull. Inst. Géol. Bassin Aquitaine 41,
95–108 (1987).
64. Pedreros, R., Howa, H. & Michel, D. Application of grain size trend analysis for the determination of sediment transport pathways
in intertidal areas. Marine Geology 135, 35–49 (1996).
65. Gallagher, E. L., MacMahan, J. H., Reniers, A., Brown, J. & Thornton, E. B. Grain size variability on a rip-channeled beach. Marine
Geology 1–4, 43–53 (2011).
66. Lafon, V. et al. Morphodynamics of nearshore rhythmic sandbars in a mixed energy environment (SW France): II. Physical forcing
analysis. Estuarine, Coastal and Shelf Science 65, 449–462 (2005).
Scientific Data | (2020) 7:410 | https://doi.org/10.1038/s41597-020-00750-5 8www.nature.com/scientificdata/ www.nature.com/scientificdata
67. Almar, R. et al. Two- and three-dimensional double-sandbar system behaviour under intense wave forcing and a meso-macro tidal
range. Continental Shelf Research 30, 781–792 (2010).
68. Lafon, V., Dupuis, H., Howa, H. & Froidefond, J. Determining ridge and runnel longshore morphodynamics using SPOT imagery.
Oceanologica Acta 25, 149–158 (2002).
69. Davies, H. C. Weather chains during the 2013/2014 winter and their significance for seasonal prediction. Nature Geoscience 8,
833–837 (2015).
70. Sidler, R. & Holliger, K. Kriging and conditional geostatistical simulation based on scale-invariant covariance models. In Dipl. Natw.
ETH Thesis (2003).
71. Parisot, J.-P. et al. Evolution of a multi-barred sandy beaches in presence of very energetic events. Journal of Coastal Research SI 56,
1786–1790 (2009).
72. Tolman, H. L. User manual and system documentation of WAVEWATCH III version 4.18. In NOAA/NWS/NCEP/MMAB Technical
Note 316, 194pp. (2014).
73. Boudière, E. et al. A suitable metocean hindcast database for the design of marine energy converters. International Journal of Marine
Energy 3-4, e40–e52 (2013).
74. Michaud, H. et al. Improvements of the new French coastal wave forecasting system and application to a wave-current interaction study
(2016). Report SHOM & Meteo France.
75. Lazure, P., Garnier, V., Dumas, F., Herry, C. & Chifflet, M. Development of a hydrodynamic model of the bay of biscay. validation of
hydrology. Continental Shelf Research 29, 985–997 (2009).
76. Castelle, B., Bujan, S., Marieu, V. & Ferreira, S. 16 years of topographic surveys of rip-channelled high-energy meso-macrotidal
sandy beach. Open Science Framework. https://doi.org/10.17605/OSF.IO/JFTW8 (2020).
77. Rew, R. & Davis, G. Netcdf: an interface for scientific data access. IEEE Computer Graphics and Applications 10, 76–82 (1990).
78. Stockdon, H. F., Holman, R. A., Howd, P. A. & Sallenger, A. H. Jr. Empirical parameterization of setup, swash, and runup. Coastal
Engineering 53, 573–588 (2006).
79. Larson, M., Hoan, L. & Hanson, H. Direct formula to compute wave height and angle at incipient breaking. Journal of Waterway,
Port, Coastal and Ocean Engineering 136, 119–122 (2010).
Acknowledgements
The continuing beach monitoring program has been funded by Observatoire Aquitaine des Sciences de l’Univers
(OASU), Agence Nationale de la Recherche (ANR) through grants ANR-10-JCJC-602, ANR-14-ASTR-0004 and
ANR-17-CE01-0014, Service National d’Observation (SNO) Dynalit labeled by Centre National de la Recherche
Scientifique - Institut National des Sciences de l’Univers (CNRS-INSU) and Observatoire de la Côte Aquitaine
(OCA). The daily topographic data in 2008 was acquired in the frame of ECORS program supported by the
French “Service hydrographique et oceanographique de la marine” (Shom). NORGAS-UG wave hindcast data
provided by LOPS-Ifremer. French Centre d’Archivage National de Données de Houle In Situ (CANDHIS)
buoy network operated by French Centre d’Etudes et d’expertise sur les Risques, l’Environnement, la Mobilité et
l’Aménagement (CEREMA). We thank Hélène Howa for initiating the monitoring of Truc Vert in the late 90 s and
Nadia Sénéchal for leading the ECORS’08 experiment.
Author contributions
B.C. conceived of the public release and publication of the Truc Vert beach profile survey dataset, analyzed and
validated the dataset, produced the figures and drafted the manuscript; since 2009 has led the continuation,
expansion and funding of the monitoring program. V.M. designed the set-up and interpolation of the DEMs.
S.B. and S.F. performed over 97% of the topographic surveys. B.C., V.M. and S.B. all co-developed the design and
evolution of the monitoring program. All co-authors edited the text.
Competing interests
The authors declare no competing interests.
Additional information
Correspondence and requests for materials should be addressed to B.C.
Reprints and permissions information is available at www.nature.com/reprints.
Publisher’s note Springer Nature remains neutral with regard to jurisdictional claims in published maps and
institutional affiliations.
Open Access This article is licensed under a Creative Commons Attribution 4.0 International
License, which permits use, sharing, adaptation, distribution and reproduction in any medium or
format, as long as you give appropriate credit to the original author(s) and the source, provide a link to the Cre-
ative Commons license, and indicate if changes were made. The images or other third party material in this
article are included in the article’s Creative Commons license, unless indicated otherwise in a credit line to the
material. If material is not included in the article’s Creative Commons license and your intended use is not per-
mitted by statutory regulation or exceeds the permitted use, you will need to obtain permission directly from the
copyright holder. To view a copy of this license, visit http://creativecommons.org/licenses/by/4.0/.
The Creative Commons Public Domain Dedication waiver http://creativecommons.org/publicdomain/zero/1.0/
applies to the metadata files associated with this article.
© The Author(s) 2020
Scientific Data | (2020) 7:410 | https://doi.org/10.1038/s41597-020-00750-5 9You can also read