Dynamics of the COVID-19 epidemic in Ireland under mitigation
←
→
Page content transcription
If your browser does not render page correctly, please read the page content below
Cazelles et al. BMC Infectious Diseases  (2021) 21:735
https://doi.org/10.1186/s12879-021-06433-9

 RESEARCH ARTICLE                                                                                                                                      Open Access

Dynamics of the COVID-19 epidemic in
Ireland under mitigation
Bernard Cazelles1,2,3* , Benjamin Nguyen-Van-Yen3, Clara Champagne4,5 and Catherine Comiskey6

  Abstract
  Background: In Ireland and across the European Union the COVID-19 epidemic waves, driven mainly by the
  emergence of new variants of the SARS-CoV-2 have continued their course, despite various interventions from
  governments. Public health interventions continue in their attempts to control the spread as they wait for the
  planned significant effect of vaccination.
  Methods: To tackle this challenge and the observed non-stationary aspect of the epidemic we used a modified
  SEIR stochastic model with time-varying parameters, following Brownian process. This enabled us to reconstruct the
  temporal evolution of the transmission rate of COVID-19 with the non-specific hypothesis that it follows a basic
  stochastic process constrained by the available data. This model is coupled with Bayesian inference (particle Markov
  Chain Monte Carlo method) for parameter estimation and utilized mainly well-documented Irish hospital data.
  Results: In Ireland, mitigation measures provided a 78–86% reduction in transmission during the first wave
  between March and May 2020. For the second wave in October 2020, our reduction estimation was around 20%
  while it was 70% for the third wave in January 2021. This third wave was partly due to the UK variant appearing in
  Ireland. In June 2020 we estimated that sero-prevalence was 2.0% (95% CI: 1.2–3.5%) in complete accordance with
  a sero-prevalence survey. By the end of April 2021, the sero-prevalence was greater than 17% due in part to the
  vaccination campaign. Finally we demonstrate that the available observed confirmed cases are not reliable for
  analysis owing to the fact that their reporting rate has as expected greatly evolved.
  Conclusion: We provide the first estimations of the dynamics of the COVID-19 epidemic in Ireland and its key
  parameters. We also quantify the effects of mitigation measures on the virus transmission during and after
  mitigation for the three waves. Our results demonstrate that Ireland has significantly reduced transmission by
  employing mitigation measures, physical distancing and lockdown. This has to date avoided the saturation of
  healthcare infrastructures, flattened the epidemic curve and likely reduced mortality. However, as we await for a full
  roll out of a vaccination programme and as new variants potentially more transmissible and/or more infectious
  could continue to emerge and mitigation measures change silent transmission, challenges remain.
  Keywords: COVID-19, Ireland, Stochastic model, Time varying parameters, Mitigation

* Correspondence: cazelles@biologie.ens.fr
1
 UMMISCO, Sorbonne Université, Paris, France
2
 INRAE, Université Paris-Saclay, MaIAGE, Jouy-en-Josas, France
Full list of author information is available at the end of the article

                                           © The Author(s). 2021 Open Access This article is licensed under a Creative Commons Attribution 4.0 International License,
                                           which permits use, sharing, adaptation, distribution and reproduction in any medium or format, as long as you give
                                           appropriate credit to the original author(s) and the source, provide a link to the Creative Commons licence, and indicate if
                                           changes were made. The images or other third party material in this article are included in the article's Creative Commons
                                           licence, unless indicated otherwise in a credit line to the material. If material is not included in the article's Creative Commons
                                           licence and your intended use is not permitted by statutory regulation or exceeds the permitted use, you will need to obtain
                                           permission directly from the copyright holder. To view a copy of this licence, visit http://creativecommons.org/licenses/by/4.0/.
                                           The Creative Commons Public Domain Dedication waiver (http://creativecommons.org/publicdomain/zero/1.0/) applies to the
                                           data made available in this article, unless otherwise stated in a credit line to the data.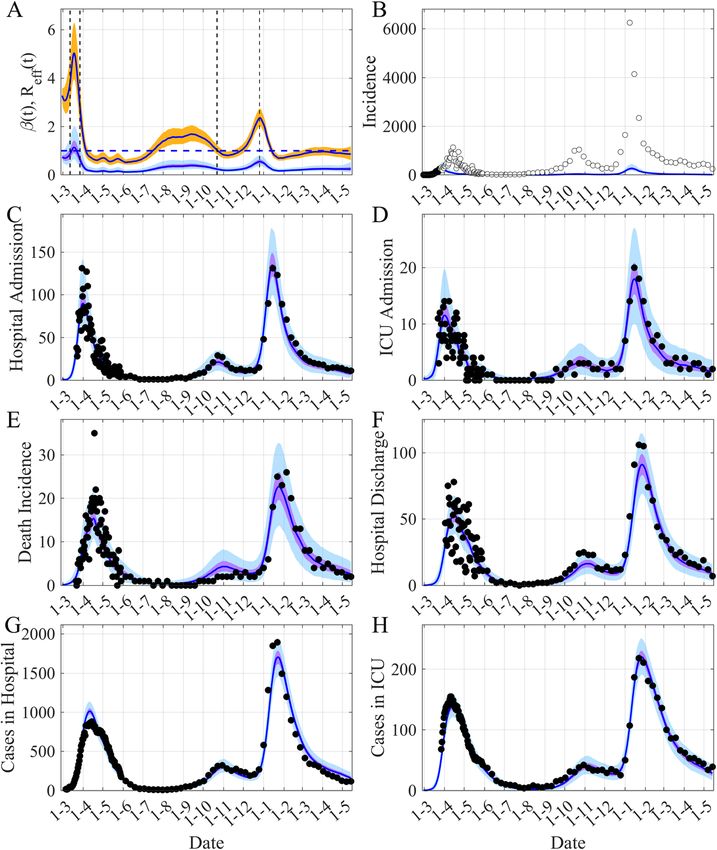
Cazelles et al. BMC Infectious Diseases   (2021) 21:735                                                         Page 2 of 10

Background                                                     follow changes in disease transmission owing, for ex-
In the last months of 2019, grouped pneumonia cases            ample, to Public Health interventions, which are of par-
were described in China. The etiological agent of this         ticular interest to us in the case the COVID-19
new disease, a betacoronavirus, was identified in January      epidemic.
and named SARS-CoV-2. Meanwhile this novel corona-
virus disease (COVID-19) spread rapidly from China             Materials and methods
across multiple countries worldwide. As of March 17,           Data
2020, COVID-19 was officially declared a pandemic by           Large uncertainties are associated with the reported
the World Health Organization. COVID-19 has now                number of cases of COVID-19 [4, 5]. The lower number
spread throughout most countries causing causing mil-          of reported cases is due to low detection and reporting
lions of cases, killing hundreds of thousands of people        rates, firstly because the testing capacity (RT-PCR la-
and causing socio-economic damage [1]. Until vaccin-           boratory capacity) was limited and has greatly varied
ation campaigns are widely implemented, the expansion          during the course of this epidemic. Secondly, it is due to
of COVID-19 with the appearance of newer, more trans-          features of this new virus, such as transmission before
missible and/or more infectious variants continue to           the onset of symptoms and important asymptomatic
threaten to overwhelm the healthcare systems of many           transmission, which results in a low fraction of infected
countries.                                                     people attending the health facilities for testing.
   The first case in Ireland was declared on the 29th of         This suggests that hospitalized data is likely to be the
February 2020 followed by a rapid increase in reported         most accurate COVID-19 related data. Thus we mainly
infections leading to a peak in daily incidence in the         focus on hospitalized data published by the Health Pro-
week of April 10th to 17th. This peak was followed by a        tection Surveillance Centre (HPSC) [6]. We also mainly
steady decline in daily cases reported until mid-August        focus on incidence data to avoid all defects related to
when a slow but steady increase in cases emerged. This         the use of cumulative data (see [7]), ie: daily hospitalized
increase was sustained and on Friday the 18th of Sep-          admission, daily ICU admission, daily deaths and daily
tember as a result of this increase the capital city,          hospital discharged. We also used “current bed used”
Dublin, was placed on a level 3 alert with movement re-        both in hospital and in ICU as these are state variables
strictions and various lockdown measures. On Septem-           of our model. Taking account of the large variability of
ber 25th a rural region in close proximity to the border       the daily observations, since the 1st of June 2020 we
of Northern Ireland was also placed on this level 3 alert      have only used a weekly average of the daily values
[2].                                                           observed.
   Our aim is to examine the dynamics of the COVID-19            Since hospitalized data is only available from the 22th
epidemic in Ireland using public data and a simple sto-        of March after the first mitigation measures (school clos-
chastic model. As occurs with the majority of epidemics,       ure) and that our aim was to model the dynamics of the
the COVID-19 epidemic has and continues to modify              epidemic before, during and after the NPI measures, we
greatly during its course. Taking account of the time-         used daily incident infectious data available before the
varying nature of the different mechanisms responsible         25th of March. Nevertheless this data was associated
for disease propagation is always a major challenge. To        with a low reporting rate and a large variance in the ob-
tackle this aspect, we have used a previously proposed         servational process used (see Inference part below).
framework [3]. This framework uses diffusion models
driven by fractional Brownian motion to model time-            Model
varying parameters embedded in a stochastic modified           A simple model of extended stochastic Susceptible-
SEIR model, coupled with Bayesian inference methods.           Exposed-Infectious-Recovered (SEIR) also accounting
This mechanistic modeling framework enables us to re-          for asymptomatic transmission and the hospital system
construct the temporal evolution of key parameters             has been developed (see eqs. A1-A3 in the Supporting
based only on the available data, under the non-specific       information and Fig. 1). It is similar to others, which
assumption that it follows a basic stochastic process          have been proposed to model and forecast the COVID-
constrained by the observations. The advantages of this        19 epidemic [8–11]. It includes the following variables:
approach are the possibility of (i) considering all the spe-   the susceptibles S, the infected non-infectious E, the in-
cific mechanisms of the transmission of the pathogen           fectious symptomatic I, the infectious asymptomatic A,
(e.g. asymptomatic transmission), (ii) using different         the removed people R, and the hospital variables: hospi-
datasets simultaneously, (iii) accounting for all the un-      talized people H, people in intensive care unit ICU, hos-
certainty associated with the data used and, most im-          pital discharge G, and deaths at hospital D. We have
portantly (iv) following the time-evolution of some of         also introduced Erlang-distributed stage durations (with
the key model parameters. This framework allows us to          a shape parameter equal to 2) for the E, I, A and H
Cazelles et al. BMC Infectious Diseases       (2021) 21:735                                                                                      Page 3 of 10

 Fig. 1 Flow diagram of the model, with λ’(t) = β(t).(I1 + q1.I2 + q2.(A1 + A2))/N then the force of infection is λ(t) = λ’(t).S(t). β(t) is the time-varying
 transmission rate, σ the incubation rate, γ the recovery rate, 1/κ the average hospitalized period, 1/δ the average time spent in ICU, τA the fraction
 of asymptomatics, τH the fraction of infectious hospitalized, τI the fraction of ICU admission, τD the death rate, q1 and q2 the reduction of
 transmissibility of I2 and Ai, qI the reduction of the fraction of people admitted in ICU and qD the reduction of the death rate. The subscripts 1
 and 2 are for the 2 stages of the Erlang distribution of the considered variable. The hospital discharge is the flow from H2 to R. Flows in blue are
 from hospital (Hi) and flow in red from ICU

compartments to mimic a gamma distribution for stage                             different infectious, its value is a function of both the
duration in these compartments discounting inappropri-                           fraction of asymptomatic infectious Ai(t), τA, and of
ate exponential stage durations (eqs. A1). As more and                           symptomatic infectious Ii(t), 1-τA:
more people are being vaccinated in Ireland, the effect
of vaccination is introduced in our model simply by con-                                           ð1 þ q 1 Þ                       βðt Þ S ðt Þ
                                                                                      Reff ðt Þ ¼             :ð1−τ A Þ þ q2 :τ A :      :
sidering the effect of vaccination on the depletion of sus-                                           2                              γ     N
ceptibles. For this, we removed from the susceptible
compartment the “effectively protected vaccinated                                where β(t) is the transmission rate, 1/γ is the infection
people” that are proportional to the number of people                            duration, τA is the fraction of asymptomatic individuals
vaccinated with one and/or two doses (see eq. A2). The                           in the population, (1-τA) the proportion of symptomatic
parameters are defined in Table 1 and in the Supplemen-                          infectious individuals, qi are the reduction in the trans-
tary information.                                                                missibility of some infected (I2) and asymptomatics (Ai)
  As the peaks of those hospitalized and those admitted                          and N is the population size.
to ICU are concomitant we consider that a weak frac-
tion, qI.τI of infectious with severe symptoms goes dir-                         Inference
ectly to ICU. Even if the majority of deaths occur in the                        As we used Brownian process for modeling the time-
ICU, a small fraction, qD.τD, can occur in hospital but                          varying transmission rate our model is stochastic, the
not in intensive care.                                                           likelihood is intractable and it is estimated with particle
  An interesting sub-product of our framework is the                             filtering methods (Sequential Monte Carlo, SMC). Then
possibility of estimating the time evolution of the effect-                      the particle filter is embedded in a Markov Chain Monte
ive reproduction number, Reff [12]. Reff is defined as the                       Carlo framework, leading to the particle Markov Chain
mean number of infections generated during the infec-                            Monte Carlo method (PMCMC) algorithm [13]. More
tious period of a single infectious case at time t. It can                       precisely, the likelihood estimated by SMC is used in a
be easily estimated using the steady-state form of a SEIR                        Metropolis Hasting scheme (particle marginal Metrop-
model. Taking into account the particularity of our                              olis Hastings) (see Supplementary information). The
model that considers different transmission capacity for                         priors of the inferred parameters are in Table 1.
Cazelles et al. BMC Infectious Diseases (2021) 21:735 Page 4 of 10
Table 1 Defnition of the different parameters and their priors and posteriors based on current literature [8–11] (see also Fig. A1). For
priors, some upper bound and/or lower bound have been imposed by the observations. U is for uniform distribution and tN for
truncated normal distribution (tN [mean,std.,limit inf,limit sup])
Parameters Definitions Prior or Posterior
constant value Median, [95%CI]
I1(0) Initial condition U[5,100] 42, [18–81]
S(0) Initial condition N = 5,176,000
E1(0), E2(0), I2(0), A1(0), A2(0), Initial conditions Use of steady-state conditions a
Other Initial Conditions Initials conditions 0
β(0) Initial condition of the transmission rate 0.70
ν Volatility of the Brownian process U[0.05,015] 0.133, [0.107–0.149]
1/σ average duration of the incubation tN[4,0.1,3,5] 3.99, [3.80–4.19]
1/γ average duration of infectious period tN[6,0.2,4.5,7.5] 6.00, [5.61–6.40]
1/κ average hospitalized period U [8, 20] 13.60, [12.15–15.15]
1/δ average time in ICU U [8, 20] 17.36, [14.86–19.57]
τA fraction of asymptomatics U[0.30,0.70] 0.487, [0.310–0.685]
τH fraction of hospitalization U[0.02,0.10] 0.027, [0.020–0.046]
τI fraction of ICU admission U[0.05,0.15] 0.030, [0.023–0.045]
τ□ death rate U[0.10,0.70] 0.411, [0.365–0.458]
q1 reduction of transmissibility 1.5. q2 but≤1
q2 reduction of transmissibility 0.55 [8]
qI reduction of ICU admission fraction 0.10
qD reduction of the death rate 0.20
ρI reporting rate for symptomatic infectious U[0.02, 0.15] 0.092, [0.062–0.142]
ρH reporting rate for hospitalized people U[0.95,1] 0.971, [0.951–0.997]
ρICU reporting rate for the ICU admission 0.96
ρG reporting rate for hospital discharge 0.96
ρD reporting rate for death 0.98
a
steady-state conditions are defined by: dE 1
dt ¼ dEdt2 ¼ dIdt2 ¼ dA
dt ¼ dt ¼ 0
1 dA2
For the inference the observations considered are daily Figure 2 illustrates the potential of the framework to
incident infectious at the beginning of the epidemic, new effectively describe the numerous observations of this
hospitalized patients, new ICU admission, new deaths complex epidemic. The main characteristic this frame-
and hospitalized discharges. Hospital observations are work offers is the ability to reconstruct the time vari-
only available after the lockdown (25th of March). ation of the transmission rate β(t) (Fig. 2A) that is
Because these are count processes, we model their needed to fit the observations. We can then compute
observations with Negative Binomial likelihoods (see the time-variation of Reff (Fig. 2A). The initial value of
Supplementary information). Current hospital data, ob- Reff is around 3.2 in accordance with numerous pub-
served, hospitalized patients (H1 + H2 + ICU) and ICU lished papers (e.g. [14]). The peak of Reff around the time
beds used (ICU) have also been used in the inference of the first hospital observations is presumably a com-
process and we make the assumption that these variables pensation effect of the model to accommodate diverging
follow a normal distribution (see Supplementary trends between reported case data and hospital data.
information). Then one can note a decrease of 78% of Reff between the
1st of March and the 1st of May and a decrease of 86%
between the 12th of March (school closure and lock
Results down of offices, restrictions on travel etc) and the 1st of
Figures 2 and 3 present our main results, Fig. 2 displays May (Fig. 2A). The reduction in the transmission follow-
the fit of the model and Fig. 3 shows the dynamic of the ing the second lockdown was around 20% (Fig. 2A).
model. The posteriors of the fitted parameters are in Nevertheless the reduction of Reff was again significant
Table 1 and in Fig. A1. (70%) for the large wave that was observed in JanuaryCazelles et al. BMC Infectious Diseases (2021) 21:735 Page 5 of 10 Fig. 2 Reconstruction of the observed dynamics of COVID-19 in Ireland. A The time evolution of both β(t) and Reff (t). B Simulated observed daily incident infectious. C-D New daily admissions to hospital and to ICU. (E) Daily new deaths. F Hospital discharges. G-H Cases in Hospital and in ICU each day. The black points are observations used by the inference process, the white points are the observations not used. The blue lines are the median of the posterior of the simulated trajectories, the mauve areas are the 50% Credible Intervals (CI) and the light blue areas the 95% CI. In (A) the orange area is the 50% CI of Reff, the vertical dashed lines show the date of the main NPI measures and the horizontal dashed-line Reff = 1. For all the graphs, the reporting rates are applied to the model trajectories (Fig. 3) as during the inference process for comparison to the observations 2021, largely due to the UK variant [15, 16] (Fig. 2A). has not taken into account in the inference process (Fig. Given the temporality of the decline compared to the 2B). We fit the model to the daily incident infectious up timing of the NPIs, these sharp decreases seem to be to March 25th only (black points on Fig. 2B), and plot the result of the implementation of the mitigation our daily incident infectious estimates with the corre- measures. sponding estimate of the reporting rate, with a median Another important characteristic of this epidemic is of 0.09 (95% CI: 0.06–0.14). These data highlight that the fact that the peak of daily hospital admission and the first peak in observed incident infectious comes 2–3 daily ICU admission are concomitant (Figs. 2G-H), this weeks late, and is higher than expected. This shows that concomitance has influenced the structure of the model it is important to take into account a delay in reporting, we developed. for instance using models for nowcasting [17, 18]. This A final important point concerns the observed daily also clearly illustrates that the reporting rate has greatly incident infectious. It is a source of data that the model evolved during the course of the epidemic, with part of
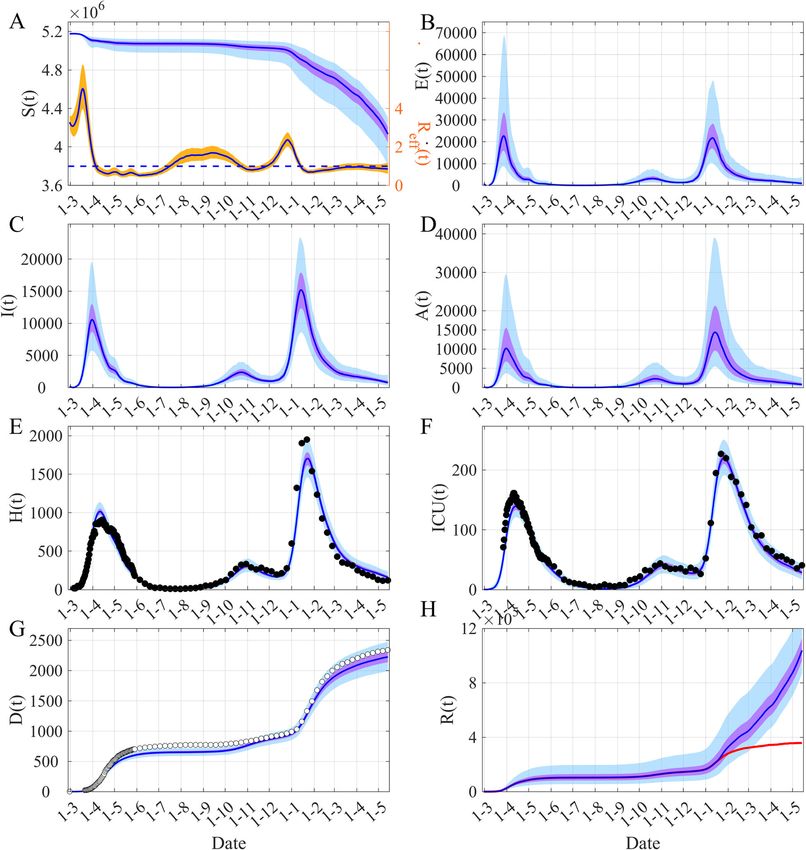
Cazelles et al. BMC Infectious Diseases        (2021) 21:735                                                                                       Page 6 of 10

 Fig. 3 Dynamics of COVID-19 in Ireland. A Time evolution of both susceptibles S(t) and Reff (t). (B) Infected non infectious, E(t) = E1(t) + E2(t). C
 Symptomatic infectious I(t) = I1(t) + I2(t). D Asymptomatic infectious A(t) = A1(t) + A2(t). (E) Hospitalized people H(t) = H1(t) + H2(t) + ICU(t). F People in
 ICU, ICU(t). G Cumulative death D(t). (H) Removed R(t). The blue lines are the median of the posterior of the simulated trajectories, the mauve
 areas are the 50% Credible Intervals (CI) and the light blue areas the 95% CI. In (A) the orange area is the 50% CI of Reff and the horizontal
 dashed-line indicates Reff = 1. In (H) the red line shows the median of R(t) when the “effectively protected vaccinated people” (see eq. A2) have
 been subtracted. The black points are observations used by the inference process, the white points are the observations not used

the increase maybe explained by a greater proportion of                           November 2020, the observed positive cases became
asymptomatics tested as time went on, whereas in the                              more consistent with the hospital data (Fig. 2B-D).
model the people tested are considered symptomatic. It                              Figure 3 displays the dynamic of the model. Fig-
is worth noting that as the epidemic progressed, after                            ures 3C-D show that the asymptomatic infectious are as
Cazelles et al. BMC Infectious Diseases (2021) 21:735 Page 7 of 10
important as symptomatics but with a larger uncertainty we provide estimations of the dynamics of the COVID-
due to lack of information available in the data. Indeed, 19 epidemic in Ireland and its key parameters. The main
the data used contain very little information on asymp- characteristics of our approach is accounting for non-
tomatics and we observe identical prior and posterior dis- stationarity by embedding time-varying parameters in a
tributions for the rate of asymptomatic, τA (see Fig. A1). stochastic model coupled with Bayesian inference. This
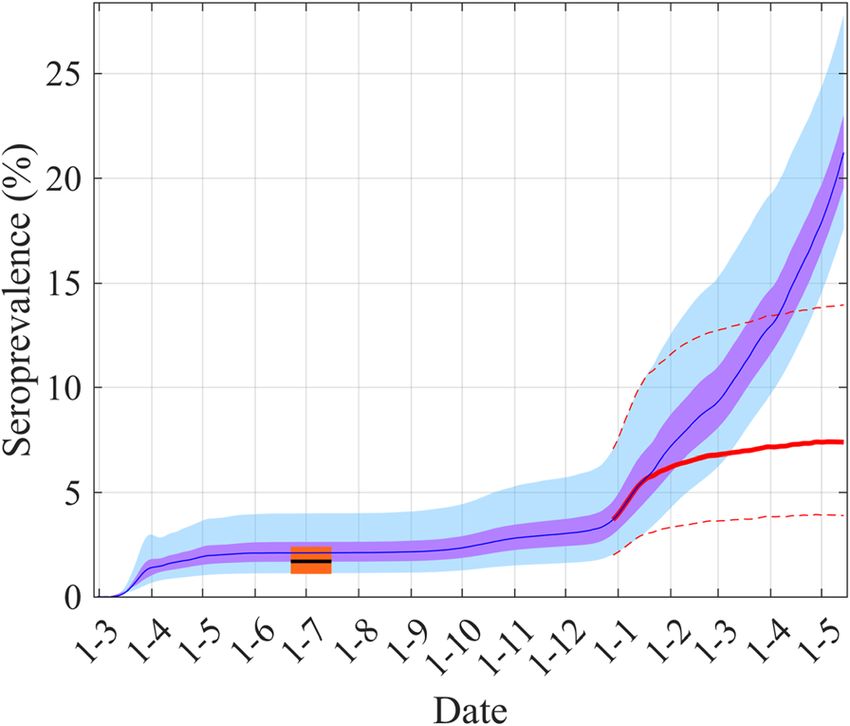
Our model also allows us to estimate the sero- mechanistic modeling framework enables us to recon-
prevalence (Fig. 4). Our estimation for the 1st July is struct the temporal evolution of the transmission rate of
2.1% (95% CI: 1.2–3.6%) and is in complete accordance the COVID-19 based only on the available data, under
with a survey study that shows a sero-prevalence of 1.7% the non-specific assumption that it follows a basic sto-
(95% CI: 1.1–2.4%) between 22nd June and 16th July chastic process constrained by the observations. We can
2020 [19]. Figure 4 displays our estimation of the time also describe the time evolving COVID-19 epidemic,
evolution of the sero-prevalence that shows a large in- quantifying the effects of mitigation measures on the
crease from the beginning of January 2020 due to the virus transmission during and after the three waves suf-
high propagation of the UK variant [15, 16] but, also, it fered, and also estimate the sero-prevalence.
would seem, due to the rolling out of the vaccination. With our approach that mainly uses well-documented
hospital data, we found a reduction of transmissibility of
Discussion the SARS-CoV-2 of 78–86% after the implementation of
The need globally to accurately model COVID-19 miti- the mitigation measures for the first wave. Our reduc-
gation strategies and asymptomatic transmission in tion estimations were around 20% for the second wave
order to plan for the burden on hospital admissions was in October–November 2020 but more than 70% for the
identified early in the pandemic [20]. Davies et al. [21] third wave in January–February 2021. These reductions
within their models in the United Kingdom have pre- in transmission may reflect the nature of the mitigation
dicted that extreme measures are probably required to measures introduced in the country. For the second
prevent an excess of demand on hospital beds, especially wave, these measures were less restrictive than during
those in ICUs during 2021. Similarly in France, Di the first and third wave, nevertheless the second wave
Domenico et al. [9] have used modeling techniques cali- was also less severe. These results are in accordance with
brated with hospital admission data to model the impact the results published on the effects of mitigation mea-
of mitigation strategies to predict the scale of the epi- sures in Europe during the first wave [14, 22]. For ex-
demic within the Ile-de-France region. In the same way, ample, Garchitorena et al. [22] by comparing 24 non-
pharmaceutical interventions found that the median de-
crease in viral transmission was 74%, which is enough to
suppress the epidemic and that a partial implementation
of different measures resulted in lower than average re-
sponse efficiency.
Our results also highlighted that the observed con-
firmed cases are only a small fraction of the total num-
ber of cases, only the tip of the iceberg (see [4]). This
underlines that human behavior in the face of testing as
well the delays in reporting, must be accounted for, for
instance using models for now-casting [17, 18]. For ex-
ample, in France it has been estimated that the detection
rate increased from 7% in mid-May to 40% by the end of
June, compared to well below 5% at the beginning of the
epidemic [23]. Then data from hospital system published
by health authorities are crucial for understanding the
course of this epidemic. These data are well measured,
Fig. 4 Estimation of the sero-prevalence and comparison with the but are observed with a delay in relation to contamin-
value from a serological survey study [19]. The blue lines are the
ation. Nevertheless, these delays can be easily account
median of the posterior of the simulated trajectories, the mauve
areas are the 50% CI and the light blue areas the 95% CI. The black for by mathematical models.
line, around June–July, is for the median value of the serological Our study is not without limitations. Our model like
survey, the orange area is for its 95%CI. The red line shows the all complex SEIR models developed for COVID-19 is
median of sero-prevalence without the effect of vaccination simply non-identifiable which means that it is likely that several
by subtracting from the removed (R(t)) the “effectively protected
solutions exist and we only present one of the most
vaccinated people” (see eq. A2) and the dashed red lines its 95%CI
likely. This point is always overlooked but see Li et al.Cazelles et al. BMC Infectious Diseases (2021) 21:735 Page 8 of 10 [8]. The major limitation is the use of the classical Undocumented infections particularly asymptomatic homogeneous mixing assumption in which all individ- infections are known to be the silent drivers of infec- uals are assumed to interact uniformly and ignores het- tion. Many studies [29–35] that have investigated the erogeneity between groups by sex, age, geographical impact of asymptomatic carriers on COVID-19 trans- region. In all cases taking an age structure and mixing mission state that, in a public health context, the si- matrix appears insufficient and heterogeneity of contact lent threat posed by the presence of asymptomatic is important (see [24]). However this kind of data is not carriers in the population results in the COVID-19 easily available. Another weakness is perhaps the neglect pandemic being much more difficult to control. These of age-structure in the model to simulate age-based pre- studies show that the population of individuals with dictions as we enter the time of children returning to asymptomatic COVID-19 infections is contributing to school. These weaknesses are however a future research driving the growth of the pandemic. Li et al. [8] esti- development given the performance of the current mate that in the early stages of the epidemic in China model. Nevertheless in our opinion, these limitations are 86% of all infections were undocumented (95% CI: compensated for taking non-stationarity of this epidemic 82–90%). However perhaps what is more important into account and by the fact that our results are mainly according to Li et al. [8] was that the transmission driven by hospital data, which is more accurate than the rate of undocumented infections per person was 55% number of infected cases. Precise data from serological the transmission rate of documented infections (95% studies at different time periods would significantly re- CI: 46–62%), yet, because of their greater numbers, duce the uncertainties of the model predictions [25, 26]. undocumented infections were the source of 79% of The key strength of the current Irish study is the fit of the documented cases. In Ireland, we can see from the model to the current observed data on hospitaliza- Fig. 3 that our model estimates that the number of tions, deaths and ICU cases that were likely to be the asymptomatic infectious is of the same order of mag- most accurate COVID-19 related data [27]. This allows nitude as the number of symptomatic infectious but us to present the first Irish modeling estimates of sero- with a larger uncertainty. This highlights that there is prevalence. The model presented predicted that in not enough information in the data to go beyond the Ireland as of the 1st July 2020 between 1.2 and 3.5% of published values that have been considered in the the population had been infected either as a symp- prior of τA. It also emphasizes the importance of tomatic or asymptomatic case. This is in complete ac- asymptomatic transmission, which is very difficult to cordance with preliminary national serological results, observe. However, considering this large uncertainty, which found that among 12 to 69 year olds living in the computation of the part of asymptomatic trans- Ireland the sero-prevalence rate was estimated be- mission is not relevant. tween 26th June and 20th July 2020 at 1.7% (95% CI: We also found other interesting results such as a sig- 1.1–2.4%) [19]. Due to the high number of infected nificant similarity between the trend of mobility and our people during the second wave and especially during estimation of the transmission between the epidemic the third wave, by mid-May 2021, the sero-prevalence waves (see Fig. A2 and [36]), highlighting the importance was estimated to be greater than 20%. This high value of following the evolution of mobility when relaxing also reflects the result of the rolling out of the na- mitigation measures to anticipate the future evolution of tional vaccination programme (Fig. 4). the spread of the SARS-CoV-2 [37]. For the first wave, our sero-prevalence predictions contrast with those of more densely populated areas. For Conclusions the first wave, estimated serological prevalence in the In this work we have used a stochastic framework United Kingdom based on a random sample of home that accounts for the time-varying nature of the based testing has found that 6.0% (95% CI: 5.8–6.1%) of COVID-19 epidemic by using time-varying parameters individuals tested positive, of these one third (32.2%, and hospital data to provide a description of this (95% CI, 31.0–33.4%)) reported no symptoms and were evolving epidemic. Our results demonstrate that asymptomatic [21, 28]. Overall the authors estimated Ireland has significantly reduced transmission by that 3.36 million (3.21 million to 3.51 million) people employing mitigation measures, physical distancing had been infected with SARS-CoV-2 in England by and and long lockdowns for wave 3. This has avoided the end of June 2020. This estimate was substantially the saturation of healthcare infrastructures, flattened higher than the recorded numbers in the UK of the epidemic curve during each wave and likely 315,000 cases. This is in accordance with observations greatly reduced mortality. Our framework that ac- from Spain where between April and May 2020, sero- counts for the non-stationarity of the transmission prevalence was 5% and only few cases of these people also offers the possibility of computing the time vary- had a PCR test [29]. ing Reff(t) and then to offer an interesting tool to
Cazelles et al. BMC Infectious Diseases            (2021) 21:735                                                                                          Page 9 of 10

follow the evolution of the COVID-19 epidemic. This                                    Author details
                                                                                       1
tool could prove particularly useful in analyzing this                                  UMMISCO, Sorbonne Université, Paris, France. 2INRAE, Université Paris-Saclay,
                                                                                       MaIAGE, Jouy-en-Josas, France. 3Eco-Evolution Mathématique, IBENS, UMR
new phase of this special epidemic, as new variants                                    8197, CNRS, Ecole Normale Supérieure, Paris, France. 4Swiss Tropical and
potentially more transmissible and/or more infectious                                  Public Health Institute, Basel, Switzerland. 5Universty of Basel, Basel,
could continue to emerge and mitigation measures                                       Switzerland. 6School of Nursing and Midwifery, Trinity College Dublin, The
                                                                                       University of Dublin, Dublin, Ireland.
change silent transmission.
                                                                                       Received: 30 October 2020 Accepted: 13 July 2021
Abbreviations
HPSC: Health protection surveillance centre; ICU: Intensive care units;
NPI: Non-pharmaceutical interventions; PMCMC: Particle markov chain monte
carlo; RT-PCR: Reverse transcription polymerase chain reaction;                        References
SEIR: Susceptible exposed infectious recovered; SMC: Sequential monte carlo            1. Who situation reports. 2020. https://www.who.int/emergencies/diseases/
                                                                                           novel-coronavirus-2019/situation-reports/
                                                                                       2. Health Protection Surveillance Centre (HPSC). COVID-19 Cases in Ireland.
Supplementary Information                                                                  2020. https://www.hpsc.ie/a-z/respiratory/coronavirus/novelcoronavirus/ca
The online version contains supplementary material available at https://doi.               sesinireland/ accessed 29th September 2020.
org/10.1186/s12879-021-06433-9.                                                        3. Cazelles B, Champagne C, Dureau J. Accounting for non-stationarity in
                                                                                           epidemiology by embedding time-varying parameters in stochastic models. PLoS
 Additional file 1: Model equation, Bayesian inference, Prior and                          Comput Biol. 2018;14(8):e1006211. https://doi.org/10.1371/journal.pcbi.1006211.
 Posterior distributions, Figs. A1-A2. Supplementary Fig. A1. Prior and                4. Richterich P. Severe underestimation of COVID-19 case numbers: effect of
 posterior distributions for the model inferences presented Fig. 2. I1(0)                  epidemic growth rate and test restrictions. MedRxiv. 2020;2020.04.13.
 initial value of infectious, ν is the volatility of the Brownian process of β(t),         20064220.
 1/σ the average duration of the incubation, 1/γ the average duration of               5. Pitzer VE, Chitwood M, Havumaki J, Menzies NA, Perniciaro S, Warren JL,
 infectious period, 1/κ the average hospitalized period, 1/δ the average                   et al. The impact of changes in diagnostic testing practices on estimates of
 time spent in ICU, τA the fraction of asymptomatics, τH the fraction of                   COVID-19 transmission in the United States. Am J Epidemiol. 2021:kwab089.
 infectious hospitalized, τI the fraction of ICU admission, τD the death rate,             https://doi.org/10.1093/aje/kwab089.
 ρI the reporting rate for the infectious, ρH the reporting rate for the               6. Health Protection Surveillance Centre (HPSC). Ireland's COVID-19 Data Hub.
 hospitalized people. The blue distributions are the priors and the discrete               2020. https://covid19ireland-geohive.hub.arcgis.com/
 histograms are the posteriors. Supplementary Fig. A2. Parallel trends in              7. King AA, Domenech de Cellès M, Magpantay FM, Rohani P. Avoidable errors
 our estimated Reff(t) (black lines) and Google Mobility (https://www.                     in the modelling of outbreaks of emerging pathogens, with special
 google.com/covid19/mobility/), retail and recreation mobility (continuous                 reference to Ebola. Proc R Soc B Biol Sci. 2015;282:20150347.
 blue line) and transport mobility (dashed blue line) in Ireland. The                  8. Li R, Pei S, Chen B, Song Y, Zhang T, Yang W, et al. Substantial
 mobility time series have been smoothed using moving average over a                       undocumented infection facilitates the rapid dissemination of novel
 7 days window. The vertical black dashed lines correspond to the start                    coronavirus (SARS-CoV-2). Science. 2020;368(6490):489–93. https://doi.org/1
 dates of the main mitigation measures.                                                    0.1126/science.abb3221.
                                                                                       9. Di Domenico L, Pullano G, Sabbatini CE, Boëlle PY, Colizza V. Impact of
                                                                                           lockdown on COVID-19 epidemic in Île-de-France and possible exit strategies.
Acknowledgments                                                                            BMC Med. 2020;18(1):240. https://doi.org/10.1186/s12916-020-01698-4.
We thank Una Ni Mhaoldhomhnaigh who extracted and managed the data                     10. Prem K, Liu Y, Russell TW, Kucharski AJ, Eggo RM, Davies N, et al. The effect
during the lockdown and edited some of the previous version of the manuscript.             of control strategies to reduce social mixing on outcomes of the COVID-19
                                                                                           epidemic in Wuhan, China: a modelling study. Lancet Public Health. 2020;
Authors’ contributions                                                                     5(5):e261–70. https://doi.org/10.1016/S2468-2667(20)30073-6.
BC and CaC contributed to conception and design of the study. BC, BNVY                 11. Prague M, Wittkop L, Clairon Q, Dutartre D, Thiébaut R, Hejblum BP.
and ClC constructed and ran the model. All authors analyzed the                            Population modeling of early COVID-19 epidemic dynamics in French
simulations. The first draft of the manuscript was written by BC and CaC, all              regions and estimation of the lockdown impact on infection rate. MedRxiv.
authors provided comments, edited and approved the final manuscript.                       2020;2020.04.21.20073536.
                                                                                       12. Cazelles B, Champagne C, Nguyen-Van-Yen B, Comiskey C, Vergu E, Roche
Funding                                                                                    B. A mechanistic and data-driven reconstruction of the time-varying
BC is partially supported by a grant ANR Flash Covid-19 from the “Agence Natio-            reproduction number: application to the COVID-19 epidemic. PLoS Comput
nale de la Recherche” (DigEpi). The funder has no role in study design, data collec-       Biol. 17(7):e1009211. https://doi.org/10.1371/journal.pcbi.1009211.
tion and analysis, decision to publish, and preparation of the manuscript.             13. Andrieu C, Doucet A, Holenstein R. Particle markov chain Monte Carlo
                                                                                           methods. J R Stat Soc Ser B. 2010;72(3):269–342. https://doi.org/10.1111/j.14
Availability of data and materials                                                         67-9868.2009.00736.x.
All surveillance data are available at the site from Health Protection                 14. Flaxman S, Mishra S, Gandy A, Unwin HJT, Mellan TA, Coupland H, et al.
Surveillance Centre (HPSC): https://www.hpsc.ie/a-z/respiratory/coronavirus/               Estimating the effects of non-pharmaceutical interventions on COVID-19 in
novelcoronavirus/casesinireland/epidemiologyofcovid-19inireland/                           Europe. Nature. 2020;584(7820):257–61. https://doi.org/10.1038/s41586-02
or https://covid19ireland-geohive.hub.arcgis.com/                                          0-2405-7.
The data used and the code are at https://www.dropbox.com/s/n0hi5                      15. Funk T, Pharris A, Spiteri G, Bundle N, Melidou A, Carr M, et al. COVID study
syu80nup5a/ssm_SEIAR_Ireland.zip?dl=0.                                                     groups. Characteristics of SARS-CoV-2 variants of concern B.1.1.7, B.1.351 or
                                                                                           P.1: data from seven EU/EEA countries, weeks 38/2020 to 10/2021. Euro
Declarations                                                                               Surveill. 2021;26:2100348.
                                                                                       16. Mallon PW, Crispie F, Gonzalez G, Tinago W, Leon AG, McCabe M, et al.
Ethics approval and consent to participate                                                 Whole-genome sequencing of SARS-CoV-2 in the Republic of Ireland during
Not applicable.                                                                            waves 1 and 2 of the pandemic. medRxiv. 2021;2021.02.09.21251402.
                                                                                       17. Höhle M. An der Heiden M. Bayesian nowcasting during the STEC O104: H4
Consent for publication                                                                    outbreak in Germany, 2011. Biometrics. 2014;70(4):993–1002. https://doi.
Not applicable.                                                                            org/10.1111/biom.12194.
                                                                                       18. Bird S, Nielsen B. Now-casting of COVID-19 deaths in English hospitals. 2020;
Competing interests                                                                        Nuffield College; (preprint) (available from: https://users.ox.ac.uk/~nuff0078/
The authors declare that they have no competing interests                                  Covid/).
Cazelles et al. BMC Infectious Diseases (2021) 21:735 Page 10 of 10
19. HSE. Preliminary report of the results of the Study to Investigate COVID-19
Infection in People Living in Ireland (SCOPI): A national sero-prevalence
study, June–July. 2020. Available from https://www.hpsc.ie/a-z/respiratory/
coronavirus/novelcoronavirus/scopi/SCOPI%20report%20preliminary%2
0results%20final%20version.pdf. Accessed 29 Sept 2020.
20. Anderson RM, Heesterbeek H, Klinkenberg D, Hollingsworth TD. How will
country-based mitigation measures influence the course of the COVID-19
epidemic? Lancet. 2020;395(10228):931–4. https://doi.org/10.1016/S0140-673
6(20)30567-5.
21. Davies NG, Klepac P, Liu Y, et al. Age-dependent effects in the transmission
and control of COVID-19 epidemics. medRxiv. 2020;2020.03.24.20043018.
22. Garchitorena A, Gruson H, Cazelles B, Roche B. Quantifying the efficiency of
non-pharmaceutical interventions against SARS-COV-2 transmission in
Europe. MedRxiv. 2020;2020.08.17.20174821.
23. Pullano G, Di Domenico L, Sabbatini CE, Valdano E, Turbelin C, Debin M, et al.
Underdetection of cases of COVID-19 in France threatens epidemic control.
Nature. 2021;590(7844):134–9. https://doi.org/10.1038/s41586-020-03095-6.
24. Britton T, Ball F, Trapman P. A mathematical model reveals the influence of
population heterogeneity on herd immunity to SARS-CoV-2. Science. 2020;
369(6505):846–9. https://doi.org/10.1126/science.abc6810.
25. Metcalf CJE, Farrar J, Cutts FT, Basta NE, Graham AL, Lessler J, et al. Use of
serological surveys to generate key insights into the changing global
landscape of infectious disease. Lancet. 2016;388(10045):728–30. https://doi.
org/10.1016/S0140-6736(16)30164-7.
26. Champagne C, Salthouse DG, Paul R, Cao-Lormeau VM, Roche B, Cazelles B.
Structure in the variability of the basic reproductive number (R0) for Zika
epidemics in the Pacific islands. eLife. 2016;5:e19874. https://doi.org/10.
7554/eLife.19874.
27. Abbott S, Hellewell J, Thompson RN, Sherratt K, Gibbs HP, Bosse NI, et al.
Estimating the time-varying reproduction number of SARS-CoV-2 using
national and subnational case counts. Wellcome Open Res. 2020;5:112.
28. Ward H, Atchison C, Whitaker M et al. Antibody prevalence for SARS-CoV-2
following the peak of the pandemic in England: REACT2 study in 100 000
adults. 2020. Available from https://www.imperial.ac.uk/media/imperial-
college/institute-of-global-health-innovation/Ward-et-al-120820.pdf
29. Pollán M, Pérez-Gómez B, Pastor-Barriuso R, Oteo J, Hernán MA, Pérez-
Olmeda M, et al. Prevalence of SARS-CoV-2 in Spain (ENE-COVID): a
nationwide, population-based seroepidemiological study. Lancet. 2020;
396(10250):535–44. https://doi.org/10.1016/S0140-6736(20)31483-5.
30. Aguilar JB, Faust JS, Westafer LM, Gutierrez JB. Investigating the impact of
asymptomatic carriers on COVID-19 transmission. medRxiv. 2020;2020.03.18.
20037994.
31. Comiskey C, Snel A, Banka S. The second wave: estimating the hidden
asymptomatic prevalence of Covid-19 in Ireland as we plan for imminent
immunisation. HRB Open Res Under Rev. 2021;4. https://doi.org/10.12688/
hrbopenres.13206.1.
32. Fox SJ, Pasco R, Tec M, Du Z, Lachmann M, Scott J, et al. The impact of
asymptomatic COVID-19 infections on future pandemic waves. MedRxiv.
2020;2020.06.22.20137489.
33. Moghadas SM, Fitzpatrick MC, Sah P, Pandey A, Shoukat A, Singer BH, et al.
The implications of silent transmission for the control of COVID-19
outbreaks. Proc Natl Acad Sci U S A. 2020;117(30):17513–5. https://doi.org/1
0.1073/pnas.2008373117.
36. Cazelles B, Comiskey C, Nguyen-Van-Yen B, Champagne C, Roche B. Parallel
trends in the transmission of SARS-CoV-2 and retail/recreation and public
transport mobility during non-lockdown periods. Int J Infect Dis. 2021;104:
693–5. https://doi.org/10.1016/j.ijid.2021.01.067.
37. Zachreson C, Mitchell L, Lydeamore MJ, Rebuli N, Tomko M, Geard N. Risk
mapping for COVID-19 outbreaks in Australia using mobility data. J R Soc
Interface. 2021;18(174):20200657. https://doi.org/10.1098/rsif.2020.0657.
34. Subramanian R, He Q, Pascual M. Quantifying asymptomatic infection and
transmission of COVID-19 in New York City using observed cases, serology,
and testing capacity. Proc Natl Acad Sci U S A. 2021;118(9):e2019716118.
https://doi.org/10.1073/pnas.2019716118.
35. ECDC. The role of asymptomatic and pre-symptomatic individuals update
august 10th 2020. 2020. Available from https://www.ecdc.europa.eu/en/
covid-19/latest-evidence/transmission. Accessed 25 Sept 2020.
Publisher’s Note
Springer Nature remains neutral with regard to jurisdictional claims in
published maps and institutional affiliations.You can also read