The TCR repertoire of α synuclein specific T cells in Parkinson's disease is surprisingly diverse
←
→
Page content transcription
If your browser does not render page correctly, please read the page content below
www.nature.com/scientificreports
OPEN The TCR repertoire
of α‑synuclein‑specific T
cells in Parkinson’s disease
is surprisingly diverse
Akul Singhania1, John Pham1, Rekha Dhanwani1, April Frazier1, Juliana Rezende Dutra2,
Karen S. Marder2, Elizabeth Phillips3,4, Simon Mallal3,4, Amy W. Amara5, David G. Standaert5,
David Sulzer2,6,7, Bjoern Peters1,8, Alessandro Sette1,8 & Cecilia S. Lindestam Arlehamn1*
The self-antigen α-synuclein (α-syn) was recently shown to be associated with Parkinson’s disease
(PD). Here we mapped the T cell receptor (TCR) repertoire of α-syn-specific T cells from six PD patients.
The self-antigen α-syn-specific repertoire was compared to the repertoire of T cells specific for
pertussis (PT), as a representative foreign antigen that most individuals are exposed to, revealing that
the repertoire for α-syn was as diverse as the repertoire for PT. The diversity of PT-specific clonotypes
was similar between individuals with PD diagnosis and age-matched healthy controls. We found that
the TCR repertoire was specific to each PD patient, and no shared TCRs among patients were defined,
likely due to differences in HLA expression that select for different subsets of epitope-specific TCR
rearrangements. This study provides the first characterization of α-syn-specific TCR clonotypes in
individuals with PD. Antigen-specific TCRs can serve as immunotherapeutics and diagnostics, and
means to track longitudinal changes in specific T cells, and disease progression.
Recognition of T cell epitopes is dependent on the expression of specific HLA molecules that bind the peptides
and the presence of T cells expressing specific T cell receptors (TCRs). TCRs are generated by somatic recom-
bination during lineage development. The theoretically possible combinatorial diversity of the TCR repertoire
has been estimated to be > 1015 distinct αβ receptors or clonotypes1, which is many more sequence combinations
than the number of T cells in an i ndividual2. The actual repertoire that emerges after the processes of positive and
negative selection is much more restricted, as many of the potentially autoreactive TCRs are e liminated3. We and
others have shown that the presence of a precursor repertoire of naïve T cells capable of recognizing an epitope
is a good predictor of the magnitude of response against an e pitope4–7. The CDR3 region of the TCR-β chain is
the most polymorphic and makes direct contact with the epitope, and sequencing of this region is sufficient to
generate a marker of epitope-specific T cells.
In humans, the development of immune responses in infection, vaccination, and disease results in the selec-
tive expansion of specific T c ells3. In the setting of autoimmune disease and non-mutated cancer antigens, the
TCR repertoire of epitope-reactive T cells is thought to be significantly less diverse8, as high affinity TCR clones
are thought to be eliminated and inactivated by thymic education, as well as central and peripheral tolerance3.
We previously described that individuals with Parkinson’s disease (PD) possess T cells that recognize specific
epitopes derived from the PD associated protein α-synuclein (α-syn)9, indicating the presence of autoimmune
features in this disease. Recently, we found that α-syn-reactive T cells are most abundant immediately after diag-
nosis of motor PD and may be present years before the diagnosis of motor P D10. In contrast to the case of PT, and
in accordance with the notion that the autoimmune repertoire is narrowed by thymic selection, the responses
to α-syn are weaker, requiring an in vitro amplification step to be detected. Moreover, this is consistent with the
relatively small size of α-syn, which contains two main epitope regions9.
1
Division of Vaccine Discovery, La Jolla Institute for Immunology, La Jolla, CA 92037, USA. 2Department of
Neurology, Columbia University Medical Center, New York, NY 10032, USA. 3Institute for Immunology and
Infectious Diseases, Murdoch University, Perth, WA 6150, Australia. 4Vanderbilt University School of Medicine,
Nashville, TN 37235, USA. 5Department of Neurology, University of Alabama at Birmingham, Birmingham,
AL 35233, USA. 6Department of Psychiatry, Columbia University Medical Center, New York, NY 10032,
USA. 7Department of Pharmacology, Columbia University Medical Center, New York, NY 10032, USA. 8Department
of Medicine, University of California San Diego, La Jolla, CA 92093, USA. *email: cecilia@lji.org
Scientific Reports | (2021) 11:302 | https://doi.org/10.1038/s41598-020-79726-9 1
Vol.:(0123456789)
www.nature.com/scientificreports/
Figure 1. Magnitude of responses against α-syn and PT peptides. Magnitude of responses (sum of IFNγ, IL-5,
and IL-10) against α-syn and PT peptides as SFC per 1 06 cultured PBMC (14-day in vitro expansion). Each
point and symbol represents one participant. Red symbols indicate participants that were selected for TCR
sequencing. Median ± interquartile range is shown.
Here we studied the TCR repertoire of α-syn T cells from PD patients and compared it to the repertoire of
T cells specific for PT (aP vaccine antigens) as a control. We further examined whether the increased frequency
of T cells responding to specific α-syn epitopes in PD subjects is associated with the presence of shared ‘public’
TCRs in PD patients recognizing these epitopes. As expected based on the wide diversity of HLA that select for
different subsets of epitope specific TCR rearrangements in the population, we found that the α-syn-specific TCR
repertoire differed among PD patients. We did not find any public TCRs, but rather we found that the TCR rep-
ertoire directed to the self-antigen α-syn was as diverse as the TCR repertoire directed to the foreign PT antigens.
Results
Similar numbers of clonotypes expand upon stimulation with α‑syn and PT peptide pools. We
have previously described the identification of α-syn and PT reactive T cells9,11. Briefly, to detect relatively rare
antigen-specific CD4 T cells, like α-syn-specific T cells, PBMCs were stimulated for 14 days in vitro with epitope
pools for α-syn or PT. After two weeks, cultures were harvested and stimulated with epitope pools, and ana-
lyzed for cytokine production in a triple-color IFNγ, IL-5 and IL-10 Fluorospot assay. In this study we tested 20
individuals with PD for T cell reactivity against α-syn and PT, as well as 55 age-matched HC against PT (Fig. 1).
We assumed that the vast majority of individuals in our cohort above 45 years of age will have been exposed to
or vaccinated against PT. As expected, 65/75 individuals responded to the PT peptide pool. Additionally, the
magnitude of response against PT was significantly higher (two-tailed Mann–Whitney p = 0.0002) than that for
α-syn-specific responses (Fig. 1). No difference was observed in the magnitude of response against PT when
comparing PD with age-matched HC (two-tailed Mann–Whitney p = 0.73) (Fig. 1). HC were not tested for α-syn
reactivity, as the α-syn reactivity is specific for PD, and HC react only occasionally and with significantly lower
magnitude9.
For TCR sequencing, we selected 6 of the individuals with PD who had α-syn-specific T cell reactivity as
determined by the Fluorospot assay (Fig. 1, red symbols; Table 1) and 7 age-, sex-, and recruitment site-matched
HC (Fig. 1, red symbols; Table 1). PBMC cultures, 2 million PBMCs were cultured per replicate, were harvested
and DNA was purified for TCR sequencing using the ImmunoSEQ service from Adaptive Biotechnologies. Each
sample included a culture replicate and as a comparison, the ex vivo repertoire of CD4 T cells was determined.
The productive repertoire of each sample, i.e., the unique in-frame rearrangements that do not contain a stop
codon, and the frequency of these productive clonotypes within the sample was assessed. The number of clo-
notypes covering eighty percent of the productive repertoire was similar between replicates of the same sample
(Fig. 2a, b). In PD, the number of clonotypes contributing to the productive repertoire was similar upon stimula-
tion with either the α-syn or PT peptide pools (Fig. 2a). In HC, however, a wider number of clonotypes covering
eighty percent of the productive repertoire following stimulation with PT peptides (Fig. 2b). As expected, all
donors exhibited a decrease in the number of productive rearrangements as a result of stimulation when com-
pared to the ex vivo samples (Fig. 2a, b), suggesting the selection and expansion of specific clonotypes upon
stimulation with peptide pools, leading to fewer unique rearrangements within the sample.
Stimulation with α‑syn and PT leads to the expansion of specific clonotypes. We next explored
the repertoire of α-syn- or PT-specific clonotypes in our samples. To this end, we compared the productive rep-
ertoire of samples stimulated with the peptide pools to the corresponding ex vivo CD4 samples, and identified
clonotypes that were significantly perturbed as a result of either α-syn or PT stimulation (Table 2 and Supple-
mentary Fig. 1). As expected, of the clonotypes that were significantly perturbed upon stimulation, the majority
expanded and had higher frequencies compared to the ex vivo CD4 samples (Supplementary Fig. 1).
Scientific Reports | (2021) 11:302 | https://doi.org/10.1038/s41598-020-79726-9 2
Vol:.(1234567890)
www.nature.com/scientificreports/
Individual PD participants accessed by TCR
Total cohort sequencing Total cohort Individual HC participants accessed by TCR sequencing
Characteristics PD 3450 3460 3486 3489 3529 3530 HC 3447 3452 3457 3459 3466 3487 3495
Participants enrolled, n 20 55
Age, median, range,
58.5 (51–73) 58 51 73 62 55 57 66 (53–92) 56 53 55 60 70 69 57
years
Sex, male, % (n) 60 (12) M F F M M F 49 (27) F F M M M F M
Caucasian, % (n) 95 (19) White White White White White Asian 93 (51) White White White White White White White
Age at diagnosis of PD,
55.5 (48–72) 54 50 72 60 54 57 N/A – – – – – – –
median, range, yr
Years since diagnosis,
1 (0–4) 4 1 1 2 1 0 N/A – – – – – – –
median, range, yr
UPDRS, median, range 24.5 (12–37) 28 12 23 37 26 16 N/A – – – – – – –
MoCA, median, range 25.5 (21–28) 28 27 28 21 24 23 N/A – – – – – – –
LED, median, range 250 (0–450) 400 450 0 450 100 0 N/A – – – – – – –
Total SFC (α-syn, sum of
– 1057 2950 460 2097 2103 3200 – – – – – – – –
IFNγ, IL-5 and IL-10)
Total SFC (PT, sum of
– 100 3278 8947 14,620 7330 8087 – 1167 1367 2323 4350 14,900 1257 11,987
IFNγ, IL-5 and IL-10)
Table 1. Summary of demographic characteristics of enrolled participants.
Figure 2. Similar number of clonotypes expand in response to α-syn and PT peptide pools. Number of TCR
clonotypes covering 80% of the productive repertoire. Ex vivo CD4 repertoire (blue) captured immediately
following thaw. Two replicates (red and yellow) were sequenced for each peptide pool stimulation (14-day
in vitro expansion). Each point and symbol represents one participant. a PD n = 6, b HC n = 7.
In our assays, we included replicate samples to allow identification of the clonotypes that reproducibly
expanded within a single donor. Similar numbers of clonotypes were significantly expanded in each of the
replicate samples from a donor (− log2 OR > 1 and FDR p val < 0.05 in both replicates; Table 2, Fig. 3a–c, and
Supplementary Fig. 1). For α-syn stimulated samples an average of 176 clonotypes per replicate was found. In the
case of PT stimulated samples, we found similar number of expanded clonotypes per replicate when comparing
the two different cohorts, with an average of n = 186 clonotypes per replicate in PD and an average of n = 200
in HC. On average, the common clonotypes between the replicates corresponded to 30% of the total expanded
clonotypes in the donor (ranging from 15 to 55%; Table 2, Fig. 3a–c).
Stimulation with α‑syn or PT results in participant‑specific TCR expansion. Having determined
the overlap between replicates in in vitro stimulated cultures, we next investigated whether repertoire overlap
was detected between the 6 different PD subjects or the 7 different HC subjects. Based on the exact clonotype
rearrangement sequence, none of the clonotypes identified by α-syn or PT stimulation were observed across all
individuals, suggesting that the various subjects are associated with different individual repertoires (Supplemen-
tary Fig. 2).
We also assessed overlap between individuals using the GLIPH a lgorithm12, which clusters TCR sequences
based on similarities in enrichment for either 3-/4-mers, convergence groups (a set of multiple TCRs from one
or more individuals that bind the same antigen in a similar manner through similar TCR contacts), global con-
vergence (a pair of TCRs that share the same length CDR3 and differ by less than 1 amino acid in those CDR3
regions), and local convergence (a pair of TCRs that share in their CDR3 regions an amino acid motif that appears
enriched in their sample set). The GLIPH analysis revealed that there was higher similarity between replicate
samples within a single individual and essentially no overlap across individuals (Supplementary Table 1). The gen-
eral lack of overlap also reflects the HLA class II allele diversity in the test population (Supplementary Table 2).
Scientific Reports | (2021) 11:302 | https://doi.org/10.1038/s41598-020-79726-9 3
Vol.:(0123456789)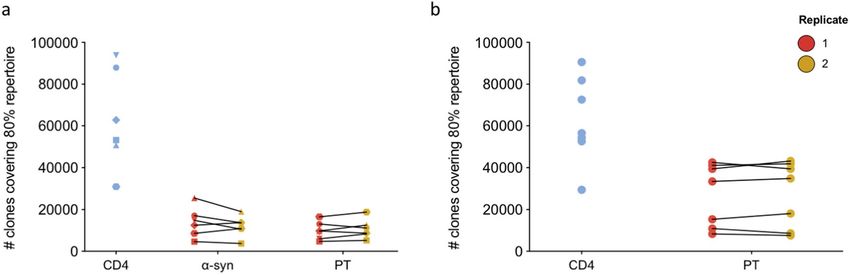
www.nature.com/scientificreports/

                                                                                                                No. of expanded clonotypes in    No. of antigen-specific
                                                 Total no. of clonotypes           No. of expanded clonotypes   both replicates (% of expanded   clonotypes (% of expanded in
           Specificity   Cohort   Participant    (replicate 1/2)                   (replicate 1/2)              repl. 1/2)                       both repl.)
                                  3450           25,885/21,702                     231/278                      56 (24/20)                       16 (29)
                                  3460           8772/5497                         124/67                       19 (15/28)                       5 (26)
                                  3486           36,306/25,617                     190/122                      48 (25/39)                       15 (31)
           α-syn
                                  3489           19,383/20,466                     199/197                      67 (34/34)                       17 (25)
                                  3529           13,444/16,356                     136/137                      33 (24/24)                       9 (27)
                                  3530           24,402/17,858                     225/204                      49 (22/24)                       13 (27)
                         PD
                                  3450           23,999/20,713                     287/226                      61 (21/27)                       23 (38)
                                  3460           6695/7273                         78/70                        17 (22/24)                       3 (18)
                                  3486           12,934/16,804                     93/108                       30 (32/28)                       5 (17)
           PT
                                  3489           16,772/18,366                     258/264                      75 (29/28)                       20 (27)
                                  3529           24,283/27,116                     122/135                      48 (39/36)                       17 (35)
                                  3530           12,932/16,636                     269/319                      47 (17/15)                       17 (36)
                                  3447           65,296/64,818                     135/134                      56 (41/42)                       –
                                  3452           60,026/64,994                     270/239                      45 (17/19)                       –
                                  3457           56,571/58,480                     299/363                      121 (40/33)                      –
           PT            HC       3459           37,002/41,917                     194/143                      78 (40/55)                       –
                                  3466           30,810/29,033                     241/221                      112 (46/51)                      –
                                  3487           64,542/61,252                     123/127                      50 (41/39)                       –
                                  3495           28,371/26,341                     122/182                      37 (30/20)                       –

                                                Table 2.  Clonotypes expanded upon stimulation with α-syn or PT peptides.

                                                Figure 3.  Similar numbers of expanded clonotypes in response to α-syn and PT stimulation. The number
                                                of expanded clonotypes in α-syn- and PT-stimulated PD (a, b) and HC (c) samples. For PD both absolute
                                                numbers (top) and normalized against total number of clonotypes in each replicate (bottom) is shown. Red
                                                indicates clonotypes that are unique in replicate 1, yellow indicates clonotypes that are unique in replicate 2.
                                                Grey indicates clonotypes that are common between the two replicates (− log2 OR > 1 and FDR p val < 0.05) and
                                                dark grey indicates antigen-specific clonotypes, i.e., number and proportion of clonotypes that expanded only
                                                in each antigen-stimulated culture excluding clonotypes that expanded irrespective of stimuli. d Percentage of
                                                α-syn- and PT specific clonotypes in PD (dark grey in bottom graphs). Yellow (replicate 1) and blue (replicate 2).
                                                Mean ± StDev is shown. Paired two-tailed t test.

          Scientific Reports |    (2021) 11:302 |                          https://doi.org/10.1038/s41598-020-79726-9                                                           4

Vol:.(1234567890)
www.nature.com/scientificreports/
Figure 4. α-Syn-specific clonotypes have a similar frequency to the overall expanded clonotypes. Frequency of
clonotypes expanded upon α-syn (a) or PT (b) stimulation in both replicates (excluding non-specific expansion
in response to both stimuli conditions) in the total productive repertoire (normalized to respective combined
total) in individual PD participants. c Percentage frequency of the expanded antigen-specific clonotypes for
α-syn and PT. Yellow and blue indicates individual replicates. Mean ± StDev is shown. Paired two-tailed t-test.
Definition of α‑syn‑ or PT‑specific clonotypes. To capture clonotypes that were specifically altered as
a result of α-syn stimulation and not due to effects associated with non-specific bystander activation in in vitro
culture, we compared the clonotypes significantly expanded in response to α-syn stimulation with those that
significantly expanded following PT stimulation in the PD participants. We focused on reproducible clonotypes
identified in both replicate samples following stimulation with α-syn (Table 2, Supplementary Fig. 1b). Of these
reproducible clonotypes (Fig. 3a, light gray bars), approximately 30% (25–31%) were specifically altered upon
α-syn stimulation and not by PT stimulation (Fig. 3a, dark gray bars, Supplementary Fig. 1c).
Next, we assessed whether these α-syn-specific clonotypes (Fig. 3a, dark gray bars) had a higher expansion
indicating a larger selection, compared to those clonotypes that were also reproducible between the two replicates,
but were non-specific. To assess this, we determined the total templates of each of the α-syn-specific clonotypes
and whether these templates corresponded to a higher frequency in the overall reproducible clonotype pool
identified in both replicates (α-syn-specific + non-specific). On average, α-syn-specific clonotypes (which made
up 30% of the reproducible clonotype pool) had an overall frequency of 28%, and the non-specific clonotypes
(which made up 70% of the reproducible clonotype pool) had a frequency of 72% (Fig. 4a). This indicates a
similar expansion and selection between these two clonotype groups.
Similar to the α-syn expansion, following PT stimulation (Table 2, Supplementary Fig. 1b), approximately
30% (17–38%) of the clonotypes were specifically altered upon PT stimulation in both replicates within a donor
(Fig. 3b, Supplementary Fig. 1c). There were no significant differences in the number of antigen-specific clono-
types expanded in response to α-syn or PT stimulation (Fig. 3d). However, in contrast to the α-syn-specific clono-
types, on average these PT-specific clonotypes made up 48% of the frequency of the total reproducible clonotype
pool, suggesting a greater expansion and selection of these clonotypes compared to the non-specific clonotypes
that had a frequency of 52% (Fig. 4b). There was a trend toward the specific clonotype expansion against α-syn
being more limited than that against PT (Fig. 4c), which may reflect general differences in response to foreign
and self-antigens. However, this increased expansion of PT-specific clonotypes compared to the α-syn-specific
clonotypes was true for some individuals, but not all (Fig. 4c).
Scientific Reports | (2021) 11:302 | https://doi.org/10.1038/s41598-020-79726-9 5
Vol.:(0123456789)www.nature.com/scientificreports/
Discussion
Here we report an analysis of PD patients in regard to the α-syn-specific TCR repertoire, an autoantigen recently
associated with PD9,13 and its p
rogression10. The rationale for this analysis originates from the fact that detection
of TCRs specifically associated with PD might provide a diagnostic tool, could generate insights into disease
pathogenesis, and pave the way for adoptive transfer applications.
In terms of the potential for TCR-based diagnostics, our study demonstrates that TCRs can be mapped to
α-syn responses in PD patients. Our stringent selection criteria of only focusing on clonotypes present in rep-
licate samples identifies the TCRs that are antigen-specific, and may not identify the complete antigen-specific
repertoire within an individual. Previous studies12,14 have found that within an epitope-specific repertoire, a por-
tion of the responding receptors cluster closely together based on shared motifs. To find shared TCR clonotypes
between individuals, we used direct sequence comparison, and the GLIPH algorithm12 applied to the clonotypes
identified in two replicates. We did not find evidence for shared TCR repertoires for either α-syn or PT in the
subjects studied, similar to findings for individuals with M S15. There are limited studies on autoantigen-specific
TCR repertoires. However, in a study by Eugster et al., where they investigated the TCR repertoire of GAD65
autoantigen-specific human CD4 T cells, they also found high diversity in the repertoire16. These findings are not
surprising, as these subjects were not matched based on their HLA expression. The response to α-syn, like any
other known human antigens, is mediated by multiple epitopes, so that different individuals typically respond
to different epitopes, which are restricted by diverse HLA alleles. While shared epitope-specific receptor chains
have been observed in individuals sharing the relevant HLA alleles17,18, this is relatively uncommon and does not
appear to be the case for PD associated α-syn-specific TCRs. Thus, while the present study provides a proof of
concept for the definition of PD associated α-syn-specific TCRs, further studies of HLA-matched individuals with
larger numbers of subjects will be required to thoroughly address diagnostic utility. Moreover, the involvement of
α-syn-specific T cell responses and associated α-syn-specific TCRs can be investigated in other synucleinopathies
such as multiple system atrophy (MSA) and dementia with Lewy Bodies (DLB).
The present study represents individual antigen-specific repertoires that can be considered as a sampling
from the possible collective repertoire. There is limited data on similar sequences within a collective repertoire
i.e., pooling of sequences from multiple individuals19.
It is noteworthy that clustered TCRs may be present due to an evolutionary focusing on particular epitopes,
as they have primarily been described in the responses to pathogens that have coexisted with humans for long
evolutionary periods, such as herpesviruses and Mycobacterium tuberculosis12,17.
To compare the specificity of TCR response in PD, we examined the TCR repertoires associated with α-syn
responses to those associated with PT. PT is a foreign antigen and we measured responses against the epitopes
from the antigens contained in the acellular Pertussis vaccine, from which 132 epitopes have been d efined11.
Vaccination and boosting with the TDaP vaccine (PT in combination with tetanus and diphtheria) is ubiquitous,
most individuals receives multiple booster immunizations throughout life, and therefore most human subjects
exhibit a vigorous T cell response to this PT peptide pool11,20. This is in contrast to influenza, where the vaccine
composition and peptide epitopes change every year, or to other ubiquitous pathogens (such as CMV) where
responsiveness is dependent on the individuals being chronically infected. Furthermore, the PT peptide pool is
associated with HLA class II restricted CD4 responses, like α-syn, and it has been extensively characterized11,20–23.
α-Syn, in contrast, is a small self-antigen with only 11 defined T cell epitopes, and so we expected to find a
much narrower repertoire for α-syn. Surprisingly, we found that the TCR repertoire for α-syn-specific T cells
is as restricted as that of PT-specific T cells, and concomitantly we found no difference in the PT-specific TCR
repertoire between PD and HC. α-Syn brain pathology is quite common in older adults and it is difficult to know
whether a HC will go on to develop PD in the future. For this reason, we did not compare α-syn-specific responses
between the cohorts, instead focusing on α-syn-specific clonotypes in comparison with PT. The result that the
α-syn and PT repertoire are similar is surprising, given the inherent differences in terms of nature of exposure,
and number of epitopes available. It should be noted that the size of the PT repertoire is likely a reflection of
repeated vaccine boosting and multiple re-exposures over an individual’s lifespan. It is possible that the overall
similar complexity of TCRs might reflect repeated (in the case of PT), or chronic (in the case of α-syn) exposure
and stimulation, progressively narrowing the repertoire to a similar degree.
In terms of the potential for adoptive therapy, it has been hypothesized that α-syn TCRs can be cloned into
“suppressive” IL-10 producing T cells, thus providing a counter balance to proinflammatory responses24. Our
study suggests that this is conceptually possible, but also highlights potential challenges arising from antigenic
and HLA diversity. It remains to determined whether T cells are actively participating in the disease process or if
they are merely responding to the death of neurons that release α-syn when they die. We hypothesize that α-syn-
specific T cells (or the specific TCRs) can potentially be used as a biomarker for early detection of PD (Fig. 5),
and thereby earlier intervention. Furthermore, if it is proven that the T cells actively participate in the disease
process and are involved in the neurodegeneration, we hypothesize that immunomodulatory interventions can
be used to modify the specific T cell responses (Fig. 5).
In conclusion, this study provides a first characterization of α-syn-specific TCR clonotypes in individuals
with PD. It is possible that further research that matches PD subjects of specific HLA alleles with antigen-specific
TCRs, could provide as immunotherapeutics, diagnostics, and means to track longitudinal changes in the specific
T cells and disease progression.
Methods
Ethics statement. All participants provided written informed consent for participation in the study. Ethi-
cal approval was obtained from the Institutional review boards at La Jolla Institute for Immunology (LJI; pro-
tocol numbers VD-118 and VD-124), University of Alabama (UAB; protocol number IRB-300001297), and
Scientific Reports | (2021) 11:302 | https://doi.org/10.1038/s41598-020-79726-9 6
Vol:.(1234567890)www.nature.com/scientificreports/
Figure 5. The potential role of α-syn-specific T cells in PD pathogenesis. α-syn-specific T cell reactivity
decrease as PD p rogresses10, with the highest reactivity present pre-diagnosis of motor PD. α-syn-specific T
cells can potentially be used as a biomarker for early detection and/or if they actively participate in the disease
process as targets for early intervention.
Columbia University Medical Center (CUMC; protocol number IRB-AAAQ9714). All research was performed
in accordance with relevant guidelines and regulations.
Study subjects. We recruited a total of 20 participants with PD from the UAB Movement Disorders Clinic
in Birmingham, Alabama and 55 age-matched healthy controls (HC) from the UAB Movement Disorders Clinic
(n = 10), the Alzheimer’s disease research center at CUMC (n = 25), and Precision Med, a Contract Research
Organization (n = 20). Cohort characteristics of PD and HC are listed in Table 1. Blood samples were collected
by trained staff. The PD cohort was recruited from the clinical practice of the UAB Movement Disorders Clinic.
Participants were enrolled by fellowship trained movement disorders specialists who identified subjects using
the UK Parkinson’s Disease Society Brain Bank criteria for PD. All subjects had clinically moderate to advanced
PD; 2 of three cardinal signs (rest tremor, rigidity, and/or bradykinesia); age at PD diagnosis 47–75, clear clinical
evidence of dopaminergic medication benefit, age at enrollment 48–90, and ability to provide informed consent.
The exclusion criteria included: atypical or secondary (i.e. medication-induced) parkinsonism or other neuro-
logical disorders; history of cancer within the past 3 years (except skin), known autoimmune disease (except
thyroid), or chronic immune-modulatory therapy. Age-matched HC were selected on the basis of age and ability
to provide informed consent. Exclusion criteria were the same as for PD donors, and in addition we excluded
self-reported family history of PD in a first-degree relative.
The selection of PD participants for the TCR repertoire analysis was based on their response to α-syn and
having sufficient numbers of available cells. The healthy controls were selected to be as closely matched to the
PD cohort as possible i.e., recruited at the same site, same age and sex.
Peptides. Peptides were synthesized by A&A, LLC (San Diego, CA) as purified material (> 95% by reversed
phase HPLC). α-Syn peptides were eleven 15-mers previously described as T cell epitopes9, which were com-
bined into one α-syn peptide pool10. These peptides represent the epitopes that were most frequently recognized
by individuals with PD9. PT peptides were 132 16-mers derived from B. pertussis antigens included in the aP vac-
cines (FHA, FIM2/3, PRN, and PT) from the Tohama I and 18,323 strains11,20. These were previously described
as T cell epitopes recognized by more than 5% of wP or aP vaccinated subjects11. The PT peptides were used as
one peptide pool. Peptides were aliquoted in small volumes and stored at − 20 °C to avoid multiple freeze–thaw
cycles.
PBMC isolation and in vitro expansion. Venous blood was collected in anticoagulant (e.g. heparin or
EDTA)-containing blood bags or tubes. Peripheral blood mononuclear cells (PBMC) were purified from whole
blood using Ficoll-PaqueTM density-gradient centrifugation, according to the manufacturer’s instructions (GE
Healthcare Bio-Sciences, Pittsburgh, PA). Cells were suspended in FBS containing 10% (vol/vol) DMSO and
cryopreserved in liquid nitrogen. For in vitro expansion, cryopreserved PBMCs were thawed in RPMI supple-
mented with 5% human serum (Gemini Bio-Products, West Sacramento, CA), 1% Glutamax (Gibco, Waltham,
MA), 1% penicillin/streptomycin (Omega Scientific, Tarzana, CA) and 50 U/ml Benzonase (Millipore Sigma,
Burlington, MA) as previously d escribed10. The cells were then washed and viability was evaluated using trypan
blue dye exclusion. Briefly, at a density of 2 × 10⁶ per mL, the cells were plated in each well of a 24 well plate in the
presence of α-syn (5 μg/ml) or PT (2 μg/ml) peptide pool and were incubated in a 37 °C humidified CO2 incuba-
tor for 2 weeks. Every 3–4 days, cells were supplied with 10 U/ml recombinant human IL-2.
After 14 days of culture, cells were harvested and used for Fluorospot assay (below) and TCR sequencing.
Cells for TCR sequencing were pelleted and frozen at − 80 °C until further processing. The Fluorospot assay
Scientific Reports | (2021) 11:302 | https://doi.org/10.1038/s41598-020-79726-9 7
Vol.:(0123456789)www.nature.com/scientificreports/
measured cytokine-specific reactivity against the different peptide pools. For TCR sequencing, the expanded
cells were all harvested and pelleted, and so cells that may produce cytokines other than the ones measured in
the Fluorospot assay were included as well.
Fluorospot assay. After 14 days of culture with α-syn or PT peptide pool, α-syn and PT-specific cellu-
lar responses were measured by IFNγ, IL-5 and IL-10 Fluorospot assay with all antibodies and reagents from
Mabtech (Nacka Strand, Sweden), as previously d escribed10. Plates were coated overnight at 4 °C with an anti-
body mixture containing mouse anti-human IFNγ (clone 1-D1K), mouse anti-human IL-5 (clone TRFK5) and
mouse anti-human IL-10 (clone 9D7). Briefly, 1 × 10⁵ cells were added to each well of pre-coated Immobilon-FL
PVDF 96-well plates (Mabtech) in the presence of 5 μg/ml peptide pool and incubated at 37 °C in humidified
CO2 incubator for 20–24 h. Cells from the in vitro culture stimulated with DMSO (corresponding to the per-
cent DMSO in the peptide pools) were used to assess non-specific/background cytokine production and PHA
stimulation at 10 μg/ml was used as a positive control. All conditions were tested in triplicates. Fluorospot plates
were developed according to manufacturer’s instructions (Mabtech). Briefly, cells were removed and plates were
washed 6 times with 200 μl PBS/0.05% Tween 20 using an automated plate washer. After washing, 100 μl of anti-
body mixture containing anti-IFNγ (7-B6-1-FS-BAM), IL-5 (5A10-WASP), and IL-10 (12G8-biotin) prepared
in PBS with 0.1% BSA was added to each well and plates were incubated for 2 h at room temperature. Plates
were again washed 6 times with 200 μl PBS/0.05% Tween 20 using an automated plate washer and incubated
with diluted fluorophores (anti-BAM-490, anti-WASP-640 and SA-550) for 1 h at room temperature. Finally,
plates were once more washed 6 times with 200 μl PBS/0.05% Tween 20 using an automated plate washer and
incubated with fluorescence enhancer for 15 min at room temperature. The plates were blotted dry and spots
were counted by computer-assisted image analysis (AID iSpot, Aid Diagnostica GMBH, Strassberg, Germany).
Responses were considered positive if the net spot-forming cells (SFC) per 1 06 PBMC were ≥ 100, the stimulation
index ≥ 2, and p ≤ 0.05 by Student’s t-test or Poisson distribution test.
Isolation of CD4 T cells. On day one when PBMCs were thawed, C D4+ T cells were isolated by nega-
tive selection using the CD4 purification T cell isolation kit II (Miltenyi Biotec, Bergisch Gladbach, Germany)
according to manufacturer’s instructions. Briefly, PBMCs were incubated together with the biotin-antibody
cocktail for 10 min at 4 °C and then with anti-biotin microbeads for 15 min at 4 °C. Unlabeled CD4+ T cells
were allowed to pass through the magnetic separation column. They were washed, pelleted, frozen and stored at
− 80 °C until further processing.
HLA typing. Participants were HLA typed by an ASHI-accredited laboratory at Murdoch University (Insti-
tute for Immunology & Infectious Diseases, Western Australia) as previously described10. HLA typing for class I
(HLA A; B; C) and class II (DQA1; DQB1, DRB1 3,4,5; DPB1) was performed using locus-specific PCR ampli-
fication of genomic DNA. Patient-specific, barcoded primers were used for amplification. Amplified products
were quantitated and pooled by subject and up to 48 subjects were pooled. An indexed (8 indexed MiSeq runs)
library was then quantitated using Kappa universal QPCR library quantification kits. Sequencing was performed
using an Illumina MiSeq using 2 × 300 paired-end chemistry. Reads were quality-filtered and passed through a
proprietary allele calling algorithm and analysis pipeline using the latest IMGT HLA allele database as a refer-
ence. The algorithm was developed by E.P. and S.M. and relies on periodically updated versions of the freely
available international immunogenetics information system (http://www.imgt.org) and an ASHI-accredited
HLA allele caller software pipeline, IIID HLA Analysis suite (http://www.iiid.com.au/laboratory-testing/).
TCR sequencing. DNA was extracted from the cultured cells or ex vivo CD4+ T cell samples using DNeasy
Blood and Tissue kit (Qiagen, Hilden, Germany) according to manufacturer’s instructions. Samples were sent to
Adaptive Biotechnologies (Seattle, WA) for TCRB sequencing according to their protocol. The ex vivo C D4+ T
cell samples were sequenced with “deep resolution” to cover a maximum number of clonotypes in the repertoire.
Samples that were stimulated with peptide pools for 14 days and then harvested were sequenced with “survey
resolution”. The identified CDR3 regions can be found in Dataset 1.
Data analysis. Pre-processing and quality control of the raw data was performed using the immunoSEQ
analyzer (Adaptive Biotechnologies, Inc.). Measurement metrics of processed data were exported in the tsv file
format and downstream data analysis was performed in Python v3.7.2 and in R v3.6.3. Only the productive rear-
rangements and the corresponding productive templates were considered for analysis. To identify clonotypes
that were expanded in culture, each of the culture replicates for every donor was compared to the correspond-
ing ex vivo CD4 sample. p values and odds-ratios were calculated using a two-sided Fisher exact test, using the
‘fisher exact’ function in the SciPy v1.3.025 and NumPy v1.16.126 extensions of Python. Clonotypes were consid-
ered significant if the -log2 odds ratios (OR) > 1 or < -1 and the false discovery rate (FDR) p value < 0.05, correct-
ing for multiple testing using the Benjamini–Hochberg method27, and calculated using the ‘fdrcorrection’ func-
tion from the statsmodels module v0.9.028 for Python. For visualization purposes, all −log10 FDR p values > 50
were set to 50. Sequence similarity by clustering was performed using GLIPH v1.0 with default parameters in
order to identify conserved motifs and the global similarity of complementarity-determining region 3 (CDR3)
sequences12.
Scientific Reports | (2021) 11:302 | https://doi.org/10.1038/s41598-020-79726-9 8
Vol:.(1234567890)www.nature.com/scientificreports/
Received: 11 August 2020; Accepted: 11 December 2020
References
1. Davis, M. M. & Bjorkman, P. J. T-cell antigen receptor genes and T-cell recognition. Nature 334, 395–402. https://doi.
org/10.1038/334395a0 (1988).
2. Arstila, T. P. et al. A direct estimate of the human alphabeta T cell receptor diversity. Science 286, 958–961. https: //doi.org/10.1126/
science.286.5441.958 (1999).
3. Goldrath, A. W. & Bevan, M. J. Selecting and maintaining a diverse T-cell repertoire. Nature 402, 255–262. https://doi.
org/10.1038/46218(1999).
4. Kotturi, M. F. et al. Naive precursor frequencies and MHC binding rather than the degree of epitope diversity shape CD8+ T cell
immunodominance. J. Immunol. 181, 2124–2133 (2008).
5. Quigley, M. F. et al. Convergent recombination shapes the clonotypic landscape of the naive T-cell repertoire. Proc. Natl. Acad.
Sci. U. S. A. 107, 19414–19419. https://doi.org/10.1073/pnas.1010586107 (2010).
6. Moon, J. J. et al. Naive CD4(+) T cell frequency varies for different epitopes and predicts repertoire diversity and response mag-
nitude. Immunity 27, 203–213. https://doi.org/10.1016/j.immuni.2007.07.007 (2007).
7. Jenkins, M. K. & Moon, J. J. The role of naive T cell precursor frequency and recruitment in dictating immune response magnitude.
J. Immunol. 188, 4135–4140. https://doi.org/10.4049/jimmunol.1102661 (2012).
8. Antunes, D. A. et al. Interpreting T-Cell Cross-reactivity through Structure: Implications for TCR-Based Cancer Immunotherapy.
Front. Immunol. 8, 1210. https://doi.org/10.3389/fimmu.2017.01210 (2017).
9. Sulzer, D. et al. T cells from patients with Parkinson’s disease recognize alpha-synuclein peptides. Nature 546, 656–661. https://
doi.org/10.1038/nature22815 (2017).
10. Lindestam Arlehamn, C. S. et al. alpha-Synuclein-specific T cell reactivity is associated with preclinical and early Parkinson’s
disease. Nat. Commun. 11, 1875. https://doi.org/10.1038/s41467-020-15626-w (2020).
11. Bancroft, T. et al. Th1 versus Th2 T cell polarization by whole-cell and acellular childhood pertussis vaccines persists upon re-
immunization in adolescence and adulthood. Cell. Immunol. 304–305, 35–43. https: //doi.org/10.1016/j.cellim m.2016.05.002 (2016).
12. Glanville, J. et al. Identifying specificity groups in the T cell receptor repertoire. Nature 547, 94–98. https://doi.org/10.1038/natur
e22976 (2017).
13. Lodygin, D. et al. Beta-Synuclein-reactive T cells induce autoimmune CNS grey matter degeneration. Nature 566, 503–508. https
://doi.org/10.1038/s41586-019-0964-2 (2019).
14. Dash, P. et al. Quantifiable predictive features define epitope-specific T cell receptor repertoires. Nature 547, 89–93. https://doi.
org/10.1038/nature22383 (2017).
15. Alves Sousa, A. P. et al. Comprehensive analysis of TCR-beta repertoire in patients with neurological immune-mediated disorders.
Sci. Rep. 9, 344. https://doi.org/10.1038/s41598-018-36274-7 (2019).
16. Eugster, A. et al. High diversity in the TCR repertoire of GAD65 autoantigen-specific human CD4+ T cells. J. Immunol. 194,
2531–2538. https://doi.org/10.4049/jimmunol.1403031 (2015).
17. Song, I. et al. Broad TCR repertoire and diverse structural solutions for recognition of an immunodominant CD8(+) T cell epitope.
Nat. Struct. Mol. Biol. 24, 395–406. https://doi.org/10.1038/nsmb.3383 (2017).
18. Thomas, P. G., Handel, A., Doherty, P. C. & La Gruta, N. L. Ecological analysis of antigen-specific CTL repertoires defines the
relationship between naive and immune T-cell populations. Proc. Natl. Acad. Sci. U S A 110, 1839–1844. https://doi.org/10.1073/
pnas.1222149110 (2013).
19. Bradley, P. & Thomas, P. G. Using T cell receptor repertoires to understand the principles of adaptive immune recognition. Annu.
Rev. Immunol. 37, 547–570. https://doi.org/10.1146/annurev-immunol-042718-041757 (2019).
20. da Silva Antunes, R. et al. Th1/Th17 polarization persists following whole-cell pertussis vaccination despite repeated acellular
boosters. J. Clin. Invest. 128, 3853–3865. https://doi.org/10.1172/JCI121309 (2018).
21. da Silva Antunes, R. et al. Lack of evidence supporting a role of IFN-beta and TGF-beta in differential polarization of Bordetella
pertussis specific-T cell responses. Cytokine 137, 155313. https://doi.org/10.1016/j.cyto.2020.155313 (2020).
22. da Silva Antunes, R. et al. Development and validation of a bordetella pertussis whole-genome screening strategy. J. Immunol. Res.
2020, 8202067. https://doi.org/10.1155/2020/8202067 (2020).
23. Burel, J. G. et al. Circulating T cell-monocyte complexes are markers of immune perturbations. Elife https://doi.org/10.7554/eLife
.46045(2019).
24. Lindestam Arlehamn, C. S., Garretti, F., Sulzer, D. & Sette, A. Roles for the adaptive immune system in Parkinson’s and Alzheimer’s
diseases. Curr. Opin. Immunol. 59, 115–120. https://doi.org/10.1016/j.coi.2019.07.004 (2019).
25. Jones, E., Oliphant, T. & Peterson, P. SciPy: Open source scientific tools for Python (2001).
26. Van Der Walt, S., Colbert, S. C. & Varoquaux, G. The NumPy array: a structure for efficient numerical computation. Computing
in Science & Engineering 13, 22 (2011).
27. Benjamini, Y. & Hochberg, Y. Controlling the false discovery rate: a practical and powerful approach to multiple testing. J. R. Stat.
Soc. Ser. B (Methodol.) 57, 289–300 (1995).
28. Seabold, S. & Perktold, J. in Proceedings of the 9th Python in Science Conference. 61 (Scipy).
Acknowledgements
This study was supported by NIH NINDS R01NS095435 (A.Se., D.S.), P50NS108675 (D.G.S., A.W.A.), NIH
NIAID U01AI141995 and U19AI142742 (A.Se.), NIH NIA P30 AG066462 (K.M.), the Parkinson’s (A.Se., D.S.),
Michael J Fox (A.Se., D.S.), and JPB (D.S.) Foundations, and UCSD-LJI Program in Immunology funding (A.Se.)
Author contributions
A.Si., B.P., D.S., A.Se., and C.S.L.A. participated in the design and direction of the study. A.Si., C.S.L.A., R.D.,
and J.P. performed and analyzed experiments. J.R.D., K.S.M., A.W.A., and D.G.S. recruited participants and
performed clinical evaluations. A.F. maintained patient data, records and assisted in participant recruitment.
E.J.P. .and S.A.M. coordinated and performed HLA typing. A.Si., B.P., A.Se., and C.S.L.A. wrote the manuscript.
All authors read, edited and approved the manuscript.
Competing interests
The authors declare no competing interests.
Scientific Reports | (2021) 11:302 | https://doi.org/10.1038/s41598-020-79726-9 9
Vol.:(0123456789)www.nature.com/scientificreports/
Additional information
Supplementary Information The online version contains supplementary material availlable at https://doi.
org/10.1038/s41598-020-79726-9.
Correspondence and requests for materials should be addressed to C.S.L.A.
Reprints and permissions information is available at www.nature.com/reprints.
Publisher’s note Springer Nature remains neutral with regard to jurisdictional claims in published maps and
institutional affiliations.
Open Access This article is licensed under a Creative Commons Attribution 4.0 International
License, which permits use, sharing, adaptation, distribution and reproduction in any medium or
format, as long as you give appropriate credit to the original author(s) and the source, provide a link to the
Creative Commons licence, and indicate if changes were made. The images or other third party material in this
article are included in the article’s Creative Commons licence, unless indicated otherwise in a credit line to the
material. If material is not included in the article’s Creative Commons licence and your intended use is not
permitted by statutory regulation or exceeds the permitted use, you will need to obtain permission directly from
the copyright holder. To view a copy of this licence, visit http://creativecommons.org/licenses/by/4.0/.
© The Author(s) 2021
Scientific Reports | (2021) 11:302 | https://doi.org/10.1038/s41598-020-79726-9 10
Vol:.(1234567890)You can also read