An Imaging Flow Cytometry Method to Measure Citrullination of H4 Histone as a Read-out for Neutrophil Extracellular Traps Formation
←
→
Page content transcription
If your browser does not render page correctly, please read the page content below
Bio-protocol 11(04): e3927.
                                           www.bio-protocol.org/e3927            DOI:10.21769/BioProtoc.3927

    An Imaging Flow Cytometry Method to Measure Citrullination of H4 Histone as a Read-out for
                                   Neutrophil Extracellular Traps Formation
         Emilia A. Barbu1, #, Venina M. Dominical2, #, Laurel Mendelsohn1 and Swee Lay Thein1, *

Sickle Cell Branch, National Heart, Lung, and Blood Institute, NIH, Bethesda, USA; 2Flow Cytometry
1

Core Facility, National Heart, Lung, and Blood Institute, NIH, Bethesda, USA
*For correspondence: sl.thein@nih.gov
Contributed equally to this work
#

[Abstract] The formation of neutrophil extracellular traps (NETs) is thought to play a critical role in
infections and propagating sterile inflammation. Histone citrullination is an essential and early step in
NETs formation, detectable prior to the formation of the hallmark extracellular DNA-scaffolded strands.
In addition to the classical microscopy method, new technologies are being developed for studies of
NETs and their detection, both for research and clinical purposes. Classical microscopy studies of NETs
are subjective, low throughput and semi-quantitative, and limited in their ability to capture the early steps.
We have developed this novel Imaging Flow Cytometry (IFC) method that specifically identifies and
quantifies citrullination of histone H4 as a NETs marker and its relationship with other alterations at
nuclear and cellular level. These include nuclear decondensation and super-condensation, multi-
lobulated nuclei versus 1-lobe nuclei and cell membrane damage. NETs markers can be quantified
following variable periods of treatment with NETs inducers, prior to the formation of the specific
extracellular DNA-scaffolded strands. Because these high throughput image-based cell analysis
features can be performed with statistical rigor, this protocol is suited for both experimental and clinical
applications as well as clinical evaluations of NETosis as a biomarker.
Keywords: NETs detection, NETs quantification, Imaging flow cytometry, NETosis, Histone H4
citrullination, Nuclear decondensation

[Background] Activated neutrophils are rapidly recruited to sites of infection and injury; they contribute
to host defense against pathogens and inflammation. About two decades ago, it was observed for the
first time that in response to pathogens, a fraction of the neutrophil population can undergo a distinct
type of cellular death, different from apoptosis or necrosis. This involves early chromatin decondensation,
co-localization of the nuclear and granular compartments and finally, release of this mix into the
environment. The extracellular DNA-scaffolded strands anchoring nuclear components (such as
histones) or cellular constituents, some with strong anti-pathogen properties like elastase or
myeloperoxidase (MPO), are known as “neutrophil extracellular traps” or NETs and have effective
antimicrobial activity (Brinkmann et al., 2004). More recent evidence shows that NETs also associate
with non-infectious conditions including cancers, systemic lupus erythematosus, sickle cell disease,
atherosclerosis, and thrombosis (Jorch and Kubes, 2017). It is yet not understood whether the NETs, or
any of their components (cell-free DNA or histones) contribute to the pathology of these disorders as

Copyright © 2021 The Authors; exclusive licensee Bio-protocol LLC.                                        1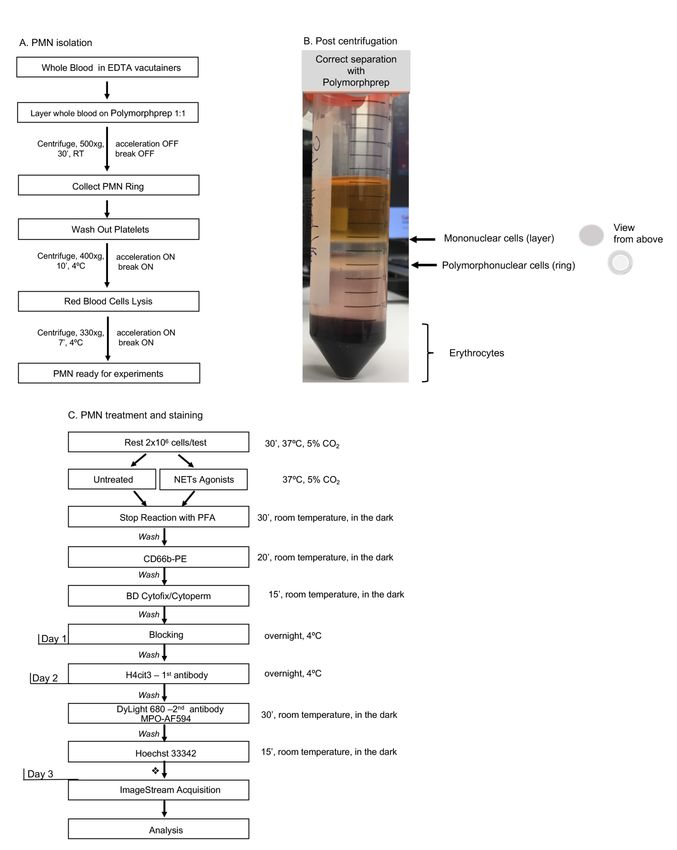
Bio-protocol 11(04): e3927.
                                           www.bio-protocol.org/e3927           DOI:10.21769/BioProtoc.3927

drivers, or whether they are by-products of an unbalanced immune response. NETs might also function
as biomarkers in certain diseases and provide information regarding the efficacy of a treatment regimen
(Barnado et al., 2016). NETs-associated components such as elastase or MPO are present in the
plasma of individuals with autoimmune diseases and also in infections, which complicates the specificity
of these molecules as biomarkers. In this light there is a great need for new methodologies for NETs
characterization that offers consistent criteria between studies, and are reliable for both mechanistic and
clinical applications.
  Other NETs detection and quantification methods are being developed in addition to the classical
widely used immunofluorescence microscopy technique. These include use of confocal microscopy that
provides information on the structure of the NETs (Santos et al., 2018), ELISA-based assay to quantify
the citrullinated histone 3 (H3cit) in human plasma (Thalin et al., 2017), high throughput live detection
of NETosis- and apoptosis-related nuclear changes using membrane-permeable and -impermeable
nuclear dyes in human neutrophils (Gupta et al., 2018), quantification of free chromatin (predominantly
associated with elastase) in human whole blood by using microfluidics (Muldur et al., 2018). Several
studies monitored NETs components (H3cit, MPO and extracellular DNA) in human and mice by using
conventional flow cytometry (Gavillet et al., 2015; Masuda et al., 2017; Lee et al., 2018; Zharkova et al.,
2019). While this technique allows high-throughput analysis it also does have noteworthy limitations,
regarding the choice of the probes, the preparation of the samples and the way gating impacts final
conclusions (Manda-Handzlik et al., 2016; Masuda et al., 2017). On the other hand, while Imaging Flow
Cytometry (IFC) does allow high-throughput analysis, it also combines visualization and analysis
features from both conventional flow cytometry and fluorescence microscopy (Basiji, 2016). NETs-
associated morphological nuclear changes (i.e., chromatin decondensation and DNA trails) and whether
and to what degree MPO co-localized with the nuclear compartment were investigated with IFC (Zhao
et al., 2015; Ginley et al., 2017; Pelletier et al., 2017). Thus, different markers and different methods are
currently employed to detect and quantify NETs in vitro. PAD4-mediated histone citrullination has been
long designated as a hallmark of NETs formation, and thus a desirable marker to follow. More recent
reports, however, predominantly in the mouse model, suggest that PAD4-mediated citrullination of
histone 3 (H3cit) is stimulus-dependent (Neeli and Radic, 2013; Claushuis et al., 2018; Guiducci et al.,
2018; Liang et al., 2018) and therefore the utility of this site as a NETs marker might be limited.
  Here, we describe in detail a novel IFC protocol that allows specific detection and quantification of
citrullination of histone 4 (H4cit3) as a NETs marker in whole neutrophils, prior to the release of the DNA
and the cytoplasmic protein strands into the extracellular space. Other analysis parameters that look at
nuclear and cellular morphological changes (nuclear decondensation and supercondensation, multi-
lobulated nuclei and cell membrane damage) can bring additional information on the behavior of the
analyzed neutrophil population. To establish our methodology we determined the responses of healthy
human neutrophils treated for 5 different periods of time (between 2 min and 60 min) with NETs agonists:
pharmacological inducers, PMA and calcium ionophore (a well-known inducer of histone citrullination,
and for our experimental conditions, the positive control), Hemin (an inducer present under hemolytic
conditions) and LPS and IL-8 (inducers associated with infectious pathogens). We used in vitro

Copyright © 2021 The Authors; exclusive licensee Bio-protocol LLC.                                       2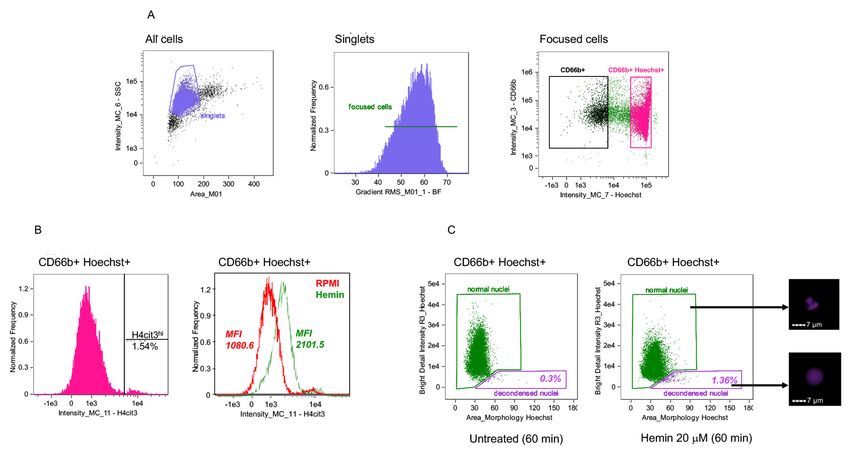
Bio-protocol 11(04): e3927.
                                           www.bio-protocol.org/e3927           DOI:10.21769/BioProtoc.3927

fluorescence microscopy to confirm the formation of DNA-elastase-MPO strands in healthy neutrophils
treated with the stimuli used for the IFC tests (Barbu et al., 2020). We further validated this technique in
untreated and Hemin-treated neutrophils from healthy donors and patients with sickle cell disease at
steady state (Barbu et al., 2019).
  The increased sensitivity and objective analysis make this methodology highly suitable for NETs
detection in both research and clinical studies, that explore mechanistic answers or possible therapeutic
strategies.
  This protocol has 4 major parts: one-step neutrophil purification, induction of NETosis, specific staining,
IFC acquisition and analysis (as highlighted in Figures 1A and 1C), with the first 3 steps requiring 3 days
and up to one week to complete all steps.

Copyright © 2021 The Authors; exclusive licensee Bio-protocol LLC.                                       3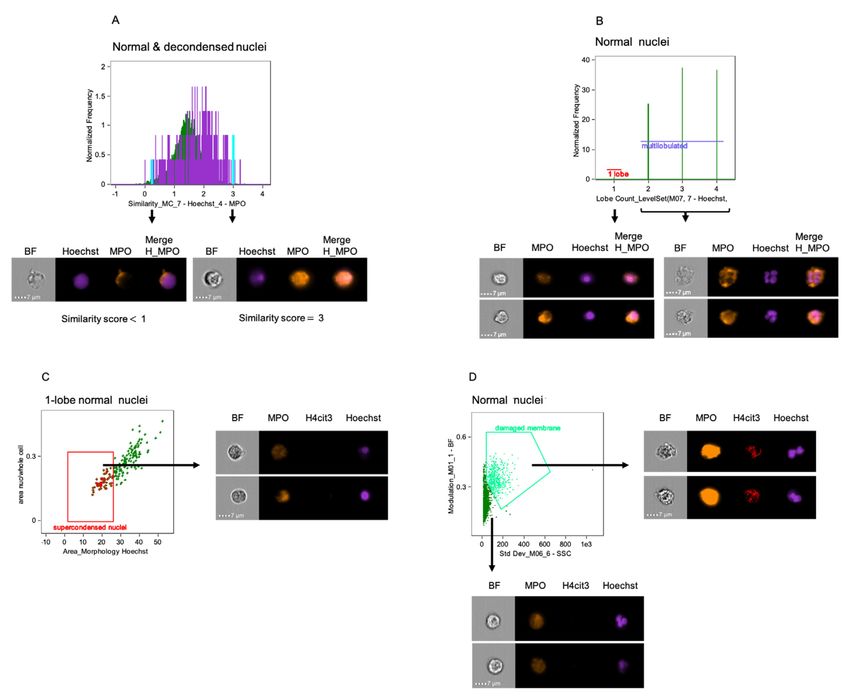
Bio-protocol 11(04): e3927.
                                           www.bio-protocol.org/e3927       DOI:10.21769/BioProtoc.3927

    Figure 1. Day-by-day description of the major steps for specific detection of NETosis markers
    by Imaging Flow Cytometry. A. One-step polymorphoponuclear (PMN) cells isolation from whole
    blood with Polymorphprep medium; with this method neutrophils purity should be consistently above
    80%. Total processing time: 90 min. B. An example of correct separation of whole blood by using
    Polymorphprep gradient medium. C. Detailed description of polymorphonuclear cells treatment and
    staining procedure. A time recommendation is not included for the neutrophil stimulation step as
    researchers should choose an appropriate treatment time according to their experimental purpose.
    Each washing step might need up to 20 min to complete, depending on the number of samples
    processed. This time should be taken into account while calculating total time required to complete
    all steps per day. ❖Short final wash followed by samples storage at 4 °C. Total stimulation and
    staining processing time for Day 1: 4+ h.

Materials and Reagents

    1. See Through, Lavender, 10.0 V, 16 × 100 mm, Plastic Tube with BD Hemograd Closure (BD,
         catalog number: BD366643)
    2. Polypropylene Conical Tubes, 50 ml (Fisher Scientific, Corning, catalog number: 07-203-510)
    3. Centrifuge tubes, 5 ml, conical bottom, sterile (Benchmark Scientific, catalog number: C1005-
         T5-ST)
    4. Centrifuge tubes 1.5 ml, mixed neon colors (USA Scientific, catalog number: 1415-1448)
    5. Rapid flow sterile disposable filter units with PES membrane, capacity 500 ml, pore size 0.45
         μm (Thermo Scientific Nalgene, catalog number: 09-740-63E)
    6. Aluminum foil
    7. Polymorphprep gradient medium (Cosmo Bio USA, catalog number: AXS-1114683)
         Note: Polymorphprep should be stored at room temperature, in the dark. Long term exposure
         to light affects its efficacy.
    8. RPMI-1640 without L-glutamine (Lonza, catalog number: 12-167F)
    9. L-glutamine 200 mM (Thermo Fisher, catalog number: 25030-081)
         Note: Aliquot in one-time use fractions and store at -80 °C. Thaw in water bath at 37 °C to
         dissolve the white sediment, then add to the RPMI to make the complete neutrophil medium.
    10. Stock 32% Paraformaldehyde (PFA) Aqueous Solution, EM Grade (Science Services, catalog
         number: E15714). Once open use within days
    11. Ultrapure 0.5 M EDTA pH 8.0 (Thermo Fisher, Invitrogen, catalog number: 15575020)
    12. DPBS 1×, no calcium chloride, no magnesium chloride (Gibco, catalog number: 141190-136)
    13. Cell Culture Grade Water (Corning, catalog number: 25-055-CV)
    14. Bovine Serum Albumin, heat shock fraction, protease free, pH 7.0, ≥98% (Millipore Sigma,
         catalog number A3294)
    15. Potassium Chloride Granular (Mallinckrodt, catalog number: 6858)

Copyright © 2021 The Authors; exclusive licensee Bio-protocol LLC.                                   4
Bio-protocol 11(04): e3927.
                                           www.bio-protocol.org/e3927         DOI:10.21769/BioProtoc.3927

    16. Dimethyl Sulfoxide (DMSO), ≥99.5% (GC), plant cell culture tested (Sigma-Aldrich, catalog
         number: D4540)
    17. Hemin from bovine, ≥90% (Millipore Sigma, catalog number: 9039)
         Note: Prepare a 40 mM stock in DMSO, aliquot in single use fractions and store at at -20 °C.
         Mix well when preparing the working solutions. Add a DMSO-only control with the tested
         samples.
    18. PMA, for use in molecular biology applications, ≥99%, HPLC (Millipore Sigma, catalog number:
         P1585)
         Note: Prepare a stock solution in DMSO and freeze single use aliquots at -20 °C.
    19. LPS-EB, Ultrapure, E. coli 0111:B4 (InvivoGen, catalog number: tlrl-3pelps)
         Note: Prepare a stock solution in ddH2O, aliquot and freeze at -20 °C. Limit the thaw-freeze
         cycles to three.
    20. Recombinant Human IL-8 (CXCL7, 77aa) (Peprotech, catalog number: 200-08)
    21. Calcium Ionophore A23187 ≥98% (TLC), powder (Millipore Sigma, catalog number: C7522)
    22. Anti-Human CD66b-PE, clone G10F5 (Biolegend, catalog number: 305106)
    23. Rabbit polyclonal anti-histone H4, citrulline 3 (H4cit3, Millipore Sigma, catalog number: 07-596)
         (see Notes)
    24. Goat anti-Rabbit IgG (H+L) Secondary Antibody, DyLight 680 (Thermo Fisher, catalog number:
         35568) (see Notes)
    25. MPO Polyclonal Antibody, AlexaFluor 594 conjugated (Bioss Antibodies, catalog number: bs-
         4943R-A594)
    26. Hoechst 33342 (BD Pharmingen, catalog number: 561908)
    27. Gelatin from Porcine Skin, powder, Type A, suitable for cell culture (Millipore Sigma, catalog
         number: G1890)
         Note: Prepare 2% stock and keep it at 4 °C for up to 6 months. Open in sterile hood only. Monitor
         for signs of bacterial or fungal contamination.
    28. BD Cytofix/Cytoperm kit (BD Biosciences, catalog number: 554722). Use only the
         Cytofix/Cytoperm solution in this protocol
    29. Wash Buffer (see Recipes)
    30. Blocking buffer (see Recipes)
    31. Paraformaldehyde 8% working solution (see Recipes)
    32. Porcine skin gelatin stock 2% (see Recipes)
    33. 0.6 M KCl (see Recipes)
    34. Neutrophils complete medium (see Recipes)

Equipment

    1. Water bath at 37 °C
    2. LabGard® ES, Class II, Type A2, Biological Safety Cabinet (NuAire, Plymouth, MN)

Copyright © 2021 The Authors; exclusive licensee Bio-protocol LLC.                                     5
Bio-protocol 11(04): e3927.
www.bio-protocol.org/e3927 DOI:10.21769/BioProtoc.3927
3. Benchtop Centrifuge with swinging bucket rotor (Beckman Coulter, model: Allegra X-14R)
4. Centrifuge (Thermo Fisher Scientific, model: Sorvall ST 16R)
5. CO2 Incubator (Thermo Fisher Scientific, model: Heracell VIOS 160i)
6. Amnis ImageStream Mark II imaging flow cytometer (Luminex Corporation, Austin, TX, USA)
Software
1. Amnis INSPIRE (Luminex Corporation, Austin, TX, USA) for data acquisition
2. Amnis IDEAS (Luminex Corporation, Austin, TX, USA) for data analysis, available for download
on the company’s website
Procedure
A. Neutrophil solation using Polymorphprep medium
Notes:
a. Choose a high yield one step neutrophil purification method as this NETs detection protocol
requires relatively high number of neutrophils (2 × 10⁶ per sample) with minimal background
activation.
b. The centrifugation step must be performed in a swing bucket rotor as the 500 × g speed has to
be reached in the middle of the tube, at the interface between the blood and the Polymorphprep
medium.
c. It is not uncommon that the Polymorphprep separation fails when using blood from female
donors. In our experience this separation works consistently with donors of both sexes that have
a MHCH (mean corpuscular hemoglobin concentration) value within the normal range.
d. Keep the purified neutrophils on ice at all times and use them for experiments within 2 h.
1. Collect whole blood in 10 ml EDTA (purple top) vacutainers and start neutrophil isolation within
1 h of the blood draw.
2. Equilibrate rotors and adaptors of the centrifuge to room temperature (18 °C to 22 °C). Set
“Acceleration” to one; set “Deceleration” to zero. Set centrifugation to 500 × g for 30 min.
3. Layer, very gently, undiluted whole blood on to the Polymorphprep medium always kept at room
temperature, at 1:1 ratio and proceed to centrifugation. Centrifuged tubes will have the following
layers from top to bottom: plasma, peripheral blood mononuclear cells – polymorphonuclear
cells (neutrophils) – red blood cells (as shown in Figure 1B).
4. Collect the neutrophil ring and gently re-suspend in 50 ml ice-cold DPBS. Centrifuge at 400 × g
for 10 min at 4 °C, with acceleration and deceleration set at maximum. Remove and discard
platelets-containing supernatant.
5. Flick the pellet to resuspend, then add 3 ml ice-cold sterile water and make sure the pellet is
fully re-suspended by gently pipetting up-and-down a few times. After 30 s restore osmolarity
Copyright © 2021 The Authors; exclusive licensee Bio-protocol LLC. 6Bio-protocol 11(04): e3927.
www.bio-protocol.org/e3927 DOI:10.21769/BioProtoc.3927
with 6 ml sterile ice-cold 0.6 M KCl. Fill up with ice-cold DPBS and centrifuge at 330 × g, 7 min
at 4 °C.
6. Discard the supernatant and re-suspend the pellet in complete neutrophil medium equilibrated
at room temperature (RPMI supplemented with 2 mM L-glutamine) at 4 × 10⁶ cells/ml.
B. Induction of NETosis
Notes:
a. Adapt the choice of NETs inducers and the length of the treatment according to the experimental
requirements.
b. Distinctive NETs agonists induce optimal responses at different lengths of the treatment period.
Five time points (2, 7, 15, 30 and 60 min) and 5 different agonists (calcium ionophore, Hemin,
LPS, IL-8 and PMA) have been tested in this protocol.
c. Allow purified neutrophils to rest before treatment with the NETs inducers to reduce their
background activation.
d. For each experiment prepare fresh 8% PFA dilution in 1× DPBS and keep it cold and in the dark
until needed (this will be further diluted to a final concentration of 4% in a further step. Do not
store for second use).
e. All steps below can be performed directly in 1.5 ml Eppendorf tubes if so chosen. However,
vigorously mixing the PFA into the cell suspension by pipetting can result in splashing and loss
of cells. Using 5 ml tubes provides more space for thorough mixing and to prevent loss of cells.
1. Add purified neutrophils, 2 × 10⁶ cells (in 500 μl of complete neutrophil medium) in a 5-ml sterile
tube and allow the purified neutrophils to equilibrate at room temperature.
2. Transfer tube to a 37 °C incubator at 5% CO2 and allow them to rest for at least 30 min without
closing the cap.
3. Add 100 μl of complete RPMI for the untreated control or the RPMI containing the NETs inducers
of choice, mix gently the same number of times in all tubes and return tubes to incubator for the
desired periods of time. Do not close the caps of the tubes during this incubation period.
4. Remove from incubator and stop reaction by adding 600 μl of freshly made 8% PFA in 1× DPBS
for a final concentration of 4% PFA, mix at least 5 times by pipetting, and allow to stand at least
30 min at room temperature, cover with aluminum foil.
5. Add 1ml Wash Buffer (WB) at room temperature and centrifuge at 1,120 × g for 5 min, at 4 °C.
Discard the PFA-containing supernatant into the designated chemical waste.
Note: To ensure that the PFA is removed, repeat this wash step one more time.
6. Gently re-suspended the pellet with 500 μl of WB and transfer it into 1.5 ml Eppendorf tube for
subsequent staining steps.
7. Repeat the washing of the 5-ml tube with another 500 μl of WB to make sure all cells have been
collected for staining.
C. NETosis staining technique for imaging flow cytometry
Copyright © 2021 The Authors; exclusive licensee Bio-protocol LLC. 7Bio-protocol 11(04): e3927.
www.bio-protocol.org/e3927 DOI:10.21769/BioProtoc.3927
Notes:
a. Remove the supernatant completely from cells at all steps, while paying attention not to lose
cells in the process.
b. Determine the optimal working dilutions for all the antibodies used in the staining panel by
titrating with a range of dilutions above and below of those recommended by the vendors (for
example, for a recommended dilution of 1:1,000, up to 5 different dilutions should be tested –
1:250; 1:500, 1:1,000, 1:2,000, 1:3,000). This is required as the lasers on different ImageStream
cytometers might have different powers.
c. Optimal H4cit3 dilution is defined as the concentration that provides the greatest separation of
the positive staining against the background (and has highest index score when antibody
titration is performed). Because the concentration of the antibody stock provided by the
company might vary between lots, the optimal H4cit4 dilution has to be determined for each
new lot of antibody.
d. Acquire the samples within 72 h of the end of the staining protocol. Longer wait times might
interfere with the strength of the signal, particularly for Hoechst (which leaks freely from the
stained cells with time). Our recommendation is to acquire them immediately.
e. Store stained cells at 4 °C in the dark and keep them on ice and in the dark during acquisition
on the ImageStream cytometer.
1. In the 1.5 ml Eppendorf tubes re-suspend fixed and thoroughly washed cells in 100 μl of 2%
BSA containing CD66b-PE, mix vigorously at least 5 times by pipetting and incubate for 20 min,
at room temperature, in the dark.
2. Washing step: Add 500 μl WB and centrifuge at 1,120 × g for 5 min, at 4 °C. Remove the
supernatant and repeat washing two more times.
3. Re-suspend washed pellet in 300 μl of BD Cytofix/Cytoperm, mix by pipetting up and down at
least 5 times, incubate 15 min at room temperature, in the dark.
4. Washing (step #2).
5. Re-suspend washed pellet in 500 μl of blocking buffer, mix by pipetting up and down at least 5
times, incubate overnight at 4 °C, in the dark.
6. Washing (step #2).
7. Re-suspend in 100 μl of 2% BSA containing anti-histone H4 citrulline 3 (H4cit3) primary antibody
at the optimal determined dilution. Pipet up and down at least 10 times and incubate overnight
at 4 °C.
Note: The concentration of this primary antibody is the limiting factor for the final strength of the
fluorescence signal (see note b above).
8. Washing (step #2).
9. Re-suspend pellet in 100 μl of 2% BSA containing secondary antibody DyLight 680, at the
determined optimal dilution and the anti-MPO-AlexaFluor 594 conjugated. Pipet up and down
at least 10 times and incubate for 30 min, at room temperature, in the dark.
Copyright © 2021 The Authors; exclusive licensee Bio-protocol LLC. 8Bio-protocol 11(04): e3927.
www.bio-protocol.org/e3927 DOI:10.21769/BioProtoc.3927
10. Washing (step #2).
11. Re-suspend in 200 μl of 2% BSA containing Hoechst diluted as suggested by the vendor
(1:1,000). Mix thoroughly by pipetting and incubate for 15 min, at room temperature, in the dark.
12. Add 500 μl WB and centrifuge at 1,120 × g for 5 min, at 4 °C. Remove supernatant.
13. Re-suspend in 50 μl WB for ImageStream (Imaging Flow cytometer) acquisition (see notes d
and e above).
D. Imaging flow cytometry acquisition.
Within the INSPIRE software, establish the acquisition settings and create a template to be used
with all experimental repeats.
1. Under the “Illumination” tab turn on the 785 laser (side scatter laser – SSC) and all other lasers
to be used in the experiment, based on the fluorochromes panel (a chart showing the laser
excitation wavelength and its corresponding dyes is available in the company’s website).
2. Under the “Magnification” section, adjust magnification to 60×.
3. Under the “Fluidics” section, slide the Speed/Sensitivity bar to the left (to ensure acquisition with
low speed and high sensitivity).
4. Under “File Acquisition”, create a new folder to save the acquired files (with a .rif extension –
raw image file).
5. Load a sample stained with all the colors and expected to yield the brightest signals for all the
dyes used (stimulated with PMA as an example – the rational here is to ensure the positive
fluorescent signal is within range and will not be saturating the channel).
6. Adjust the laser voltages based on the maximum of fluorescence without channel saturation of
each fluorochrome according to their correspondent laser excitation.
Note: When setting the channel-specific laser power, the optimal voltage of the laser is the one
that does not saturate the detectors (less than 4096 pixels in the generated image) and also
promotes a clear distinction between negative and positive population. A ‘Raw Max Pixel’ feature
of each of the used channels should be applied. This feature provides the highest value of the
pixels contained in the input mask.
7. Once the laser voltages are set, “Return” the sample and set it aside to re-acquire it after the
single color compensation control tubes have been acquired for spillover matrix calculation.
8. To generate a compensation matrix file, start the compensation wizard on Inspire and acquire
at least 1,000 events from each of the compensation control tubes.
Note: The customers portal on the Amnis ImageStream website provides detailed instructions
of how to run and validate compensation matrix using the Wizard in the INSPIRE (acquisition
software). A compensation matrix has to be applied to every acquired .rif file when first opened
for analysis in the IDEAS software (even when a compensation matrix was also applied during
the acquisition of that file with INSPIRE). Spillover compensation can be done during acquisition
or post-acquisition of data files. If the stop gates on acquisition of the files are based on
fluorescent signals, for example, acquisition based on 5,000 positive cells for CD66b, then it is
Copyright © 2021 The Authors; exclusive licensee Bio-protocol LLC. 9Bio-protocol 11(04): e3927.
www.bio-protocol.org/e3927 DOI:10.21769/BioProtoc.3927
advisable to perform compensation on INSPIRE (use the compensation wizard) to ensure that
the fluorescent signal is corrected for spillover in other fluorescent channels.
9. Create a dot plot of Area of the Brightfield (BF) versus intensity of Side Scatter (SSC) channels
and by clicking around the dots (clusters of populations) and evaluating the correspondent
imagery displayed in the gallery, the single cells can be found and boundaries determined. In
this protocol, for purified neutrophils, the gate of single cells should be in the range of 50 µm2 to
200 µm2 area. This should exclude most of the debris, small particles (to the bottom and left)
and aggregates (slightly upper and right – please refer to Figure 2A).
Note: Due to the nature of neutrophils, we thought it would be easier to identify singlets by the
use of Area versus SSC; however, one can also use Area versus Aspect Ratio (AR) of BF to
determine single cells. Aspect Ratio is the ratio of width by the height, events closer to AR of 1
will be where the single events should be located.
10. From the gate above, create a histogram using the gradient RMS (root mean square) feature of
the BF (Channel 1 or 9), to select the cells in focus. Because this feature measures the
sharpness quality of an image, changes of pixel values of 40 and above, usually corresponds
to the cells in best focus. Selecting the bin and visualizing the correspondent cells within the bin
in the image gallery will help determine where to begin the focused gate in this histogram.
11. Set the “Acquisition” tab to acquire 20,000 single and focused cells (first and second plots
created, respectively).
12. Save this template to be used for subsequent acquisitions with the same settings for laser
powers, magnification and number of events acquired.
13. Type the name of the sample into the “Acquisition” tab.
14. “Load” the sample, confirm cells are centered and in focus and click “Acquire”.
Note: Follow one of the two available brightfield channels (channel 1 or channel 9) to confirm
the cells are centered (i.e., the cells are flowing in the middle of the channel) and in focus (the
images of the flowing cells are clear and crisp).
Data analysis
Notes:
a. Representative images for steps 3 to 5 are shown in Figure 2A.
b. For a full set of experimental results with our tested NETs agonist refer to our previous
publication (Barbu et al., 2020).
1. In the IDEAS analysis software, open the .rif extension file to be analyzed.
2. Apply the compensation matrix to be used.
Note: A previously made compensation matrix is stored as a .ctm file. IDEAS software will
prompt for selection of a compensation matrix for every .rif file that needs to be analyzed.
Navigate to the stored file and load it by using the instructions from the analysis software.
Copyright © 2021 The Authors; exclusive licensee Bio-protocol LLC. 10Bio-protocol 11(04): e3927.
www.bio-protocol.org/e3927 DOI:10.21769/BioProtoc.3927
3. Create a dot plot of area of the BF image (M01 – default mask) versus side scatter (SSC –
channel 6).
Note: Single neutrophils with high SSC and relatively big cellular area will appear as a distinct
clustered population. Check a few of the single cells to define the boundaries of the singlets
gate and exclude debris and mononuclear cells. The best way to determine and validate the
gate boundaries, besides the visible cluster of events in the graph, is to click on some dots in
the plot and visualize the correspondent imagery. When looking on Area axis, one should expect
single events to the right of the population of debris or smaller cells and to the left of doublets,
larger aggregates or even bigger cells, if the cell suspension may contain such cells.
4. Select the focused cells by using the focus quality feature in brightfield, Gradient RMS (Root
Mean Square).
5. Create a dot plot of signal intensity for granulocyte-specific marker CD66b versus Hoechst and
gate double positive events (CD66b+ Hoechst+) for further analysis.
6. In the CD66b+ Hoechst+ gate create a histogram for the intensity of the H4cit3 signal and
evaluate percent of H4cit3+ cells and/or mean/median intensity fluorescence for this marker
(Figure 2B).
Note: We recommend the use of median intensity fluorescence for this parameter.
7. On the nuclear channel (Hoechst) the CD66b+ Hoechst+ gate create a dot plot of ‘Area’ versus
the specific texture feature ‘Bright Detail Intensity_R3” (BDI_R3) to identify neutrophils with
decondensed nuclei from those with normal nuclei in the CD66b+ Hoechst+ gate (Figure 2C).
Note: BDI is a feature that calculates intensity of localized bright spots within the masked area
in the image (the description of this and other IDEAS features used in this protocol can be found
in the downloadable IDEAS ImageStream Analysis Software User’s Manual).
Figure 2. Gating strategy for identification of neutrophils and their nuclear NETosis
markers by using IDEAS software. A. Single cells identified with two-parameter dot-plot of
Copyright © 2021 The Authors; exclusive licensee Bio-protocol LLC. 11Bio-protocol 11(04): e3927.
www.bio-protocol.org/e3927 DOI:10.21769/BioProtoc.3927
area of Brightfield (BF – X axis) versus Intensity of Side Scatter on Channel 6 (SSC – Y axis)
(left panel). Focused singlets cells selected by using Gradient RMS (Root Mean Square) in
Brightfield (middle panel). Neutrophils (CD66b+ Hoechst+, in strawberry red) identified from
singlet focused cells in a two-parameter dot-plot of fluorescence of Hoechst on Channel 7 (X
axis) and CD66b on Channel 3 (Y axis) (right panel). B. Representative histograms showing the
percentage of H4cit3hi cells in the CD66b+ Hoechst+ gate and H4cit3 median fluorescence
intensity (MFI). In the right panel the neutrophils were left untreated in RPMI (red) or were
treated with 20 uM Hemin for 15 min (green). C. Decondensed nuclei (purple) and normal nuclei
(green) identified with a dot-plot of area of nucleus (morphology mask function of Hoechst
staining on Channel 7) versus Bright Detail Intensity R3 of the Hoechst staining (examples of
nuclei from the two gates are included on the right side of the panel). Neutrophils were left
untreated (left) or were treated with 20 μM Hemin for 60 min (right). Percentage of cells with
decondensed nuclei is shown. Scale bars = 7 μm.
8. Use Similarity feature on the nuclear dye channel (Hoechst) and MPO channel to determine the
degree to which the two images are linearly correlated within the masked nuclear area in cells
with normal and decondensed nuclei (Figure 3A).
Note: When located in the cytoplasm MPO staining has a dissimilar distribution compared to the
Hoechst-stained nuclear mask (i.e., low Similarity score, no co-localization). When the intensity
of both dyes at the nuclear location is high, the high Similarity values indicate co-localization.
9. Use the customized “Level Set” mask on the nuclear dye channel and the ‘LobeCount’ feature
to detect reduction in the percentage of cells with multi-lobulated nuclei and separately quantify
cells with variable number of lobes (1-lobe to 4-lobes) (Figure 3B).
10. In the 1-lobe gate create a dot plot of ‘Area of nucleus’ versus ‘Ratio of nuclear by the whole cell
areas’ to quantify nuclear supercondensation. Supercondensed nuclei have low values for both
parameters; (Figure 3C).
Note: See the stand-alone Notes chapter for instructions on how to construct this custom feature.
For better resolution of the nuclear area, custom masks should be used for the above-mentioned
parameters.
11. In the normal nuclei gate construct a dot plot of ‘Standard deviation’ (X axis) and ‘Modulation’
(Y axis) to assess changes in cell membrane texture. High values for Standard deviation in
darkfield (SSC channel) and for Modulation in brightfield indicate neutrophils with damaged
membranes (Figure 3D).
Note: The Standard Deviation Feature provides information on the complexity of an object.
Modulation Feature can quantify image quality and thus characterize cells’ texture.
Copyright © 2021 The Authors; exclusive licensee Bio-protocol LLC. 12Bio-protocol 11(04): e3927.
www.bio-protocol.org/e3927 DOI:10.21769/BioProtoc.3927
Figure 3. IDEAS software analysis features to identify and quantify additional nuclear and
cellular alterations. A. Similarity analysis feature for DNA (Hoechst – channel 7) and MPO
(AF-594 – channel 4) indicates co-localization of the nuclear compartment with type I granules
in neutrophils with normal nuclei (green) and decondensed nuclei (purple). Examples of cells
with low (< 1) and high (3) similarity scores, indicating low and high DNA-MPO co-localization,
respectively, are included (the position of their specific bins on the graph is highlighted in aqua).
B. Lobe Count feature identifies changes in the number of nuclear lobes based on nuclear
imagery and quantify the number of cells in each category. Representative images of neutrophils
with 1 lobe or multilobed nuclei are included. C. Dot-plot of Area of Nucleus (morphology mask
of Hoechst staining) on X axis versus ratio of the nucleus by the whole cell areas in the 1 lobe
nucleus gate identifies supercondensed nuclei with low nuclear area and consequently low ratio
when divided by the whole cell area. Representative images of cells with supercondensed nuclei
are presented. D. Neutrophils with damaged membranes (bright green) are distinguished with
two-parameter dot-plot of Standard Deviation Side Scatter on Channel 6 (X axis) versus
Modulation of Brightfield (Y axis). High scores for both features indicate complex and textured
objects. Included, representative imagery of cells within both gates. (BF = Brightfield; H =
Hoechst). Scale bars = 7 μm.
Copyright © 2021 The Authors; exclusive licensee Bio-protocol LLC. 13Bio-protocol 11(04): e3927.
www.bio-protocol.org/e3927 DOI:10.21769/BioProtoc.3927
12. Save file once all the analysis parameters have been established. For each .rif acquisition file,
two additional files (.daf and .cif) are created in the analysis step. Use the .daf for analysis. Do
not remove the .cif one (this is where all analysis data is stored).
13. Use “Batch Data File” under the “Tools” tab to assign all saved analysis parameters to the
remaining .rif file to be analyzed.
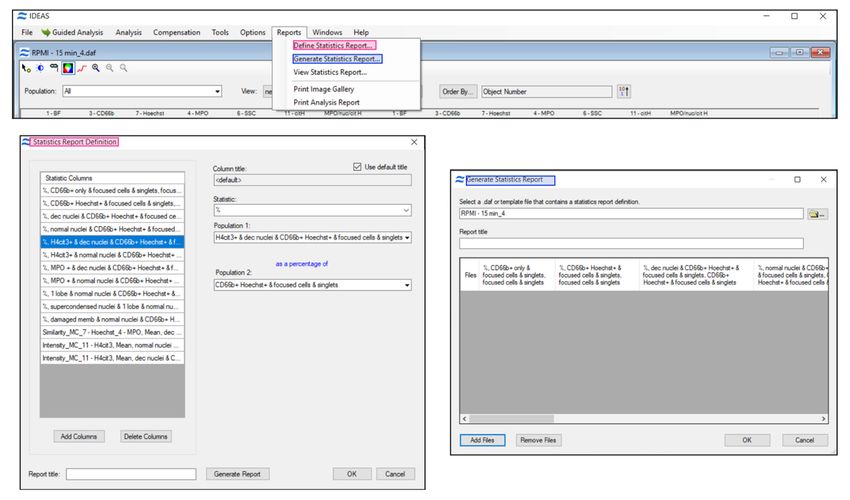
14. In the .daf analysis file use “Reports” to define a statistic report for all parameters of interest in
the target subpopulations and then “Generate Statistic Report” to apply it to all analyzed sample
files (Figure 4).
Figure 4. Define and generate a statistic report with all analysis parameters of interest.
Use “Add Files” function to apply all defined stats to the .daf analysis files. IDEAS software
generates and stores a .txt statistics file that can be opened with Excel for further processing.
Notes
1. In this protocol all steps (neutrophils isolation and stimulation, staining, detection and NETs
quantification) can critically impact the data quality.
2. Neutrophils are notorious for being easily activated during purification. Rest the purified
population for 30 min in the incubator prior to the NETs stimulation to reduce false positive data.
3. Confirm purification of neutrophil population by additional methods (e.g., cytospin).
4. Stop the NETs challenge step by adding PFA into the reaction mix, rather than spinning the tube
and removing the supernatant before adding the PFA to reduce activation by other means.
5. Confirm the lack of non-specific binding for the secondary antibody (DyLight 680) by running a
control tube with cells and secondary DyLight 680 antibody but no H4cit3 primary antibody.
Copyright © 2021 The Authors; exclusive licensee Bio-protocol LLC. 14Bio-protocol 11(04): e3927.
www.bio-protocol.org/e3927 DOI:10.21769/BioProtoc.3927
6. Use custom masks for the data analysis with the IDEAS software, as they represent more
accurately the region of interest. Validate the custom masks for total cell area and nucleus, by
confirming that the masks are indeed masking the region(s) of interest (i.e., not missing parts of
the target region or, on the opposite, masking ‘ghost’ regions outside of what is relevant for the
features) (Dominical et al., 2017).
7. Note that this protocol allows the identification of NETosis markers in whole neutrophils, prior to
the release of the DNA and the cytoplasmic proteins strings into the extracellular space. This
detail is crucial for deciding the length of the challenge with the NETs inducers for a peak number
of cells that respond to stimulus and can be acquired with the ImageStream cytometer. Lengthy
stimulation periods might lead to false negative results due to the fact that the cells have already
lysed and released their content and thus are no longer “visible” to the flow cytometer. This case
can be confirmed by independent assessments: for example, by the size of the pellet observed
in the staining tube, and the number of events in the CD66b+ Hoechst+ gate actively acquired by
the flow cytometer in the stimulated tube being reduced as compared to the untreated control.
8. To generate a custom feature to evaluate nuclear supercondensation:
a. In the IDEAS software, open a .daf extension file, select a Hoechst+CD66b+ double positive
cells.
b. On the top menu in IDEAS, select ‘Analysis’, then ‘Masks’. In the open pop-up window select
‘New’, then ‘Function’.
c. To create a mask for the nuclear staining: select the fluorescent channel for the nuclear
imagery for both the image and the channel boxes. In the drop-down menu of the function
masks, test which mask function fits best with the nuclear image by looking at the changes
of masking in the imaging box (usually “Morphology” works best as nuclear mask, as it
covers more accurately the nuclear stained region) (Dominical et al., 2017). Once the new
function mask is chosen, Click ‘Ok’.
d. Create a name for that mask or use the default name suggested by the software.
e. Click ‘Ok’ again to generate the mask.
f. To create a new mask press ‘New’.
g. Repeat steps b through e to mask the whole cell area by using CD66b imagery or BF
channel. “Object” or “Erode” function masks are good choices for masking the cell region.
h. Click ‘Close’ to close the mask window.
i. To apply new features on these new custom masks created, go back to ‘Analysis’ in the top
menu bar and select ‘Features’. Select “New” in the pop-up window.
j. ‘Feature Type’ box is available for choosing an option. Choose ‘Single’ and in the drop-down
menu in the side, choose the ‘Area’ feature.
k. Below the ‘Feature Type’ box, in the mask box, select the nuclear mask newly created. ‘Set
a Default Name’ or create a new name. Click ‘Ok’ when done.
l. Repeat steps i to k. Next use the ‘whole cell’ mask generated to input in the mask box of
the new area feature to create the new ‘Area of the whole cell’ feature.
Copyright © 2021 The Authors; exclusive licensee Bio-protocol LLC. 15Bio-protocol 11(04): e3927.
www.bio-protocol.org/e3927 DOI:10.21769/BioProtoc.3927
m. To calculate the ratio of these new features created, make a combined feature by selecting
‘New’ in that same feature window.
n. In the ‘Feature Type’ box select ‘Combined’.
o. In the ‘Features Box’ on the left, select the ‘nuclear area’ feature created.
p. Highlight the feature and on the right side of the window select the ‘arrow down’ to insert
that feature in the box.
q. Select “/” (forward slash) to calculate the ratio.
r. Highlight the ‘Area of the whole cell’ new feature created and press the arrow down to insert
this feature in the box after the ratio sign. The nuclear area is now divided by the whole cell
area.
s. Name the new feature. Click ‘Ok’ when done.
t. Click ‘Close’ to close the Features window. This new feature can be now applied in
histograms or two-parameters dot plot.
Recipes
1. 8% Paraformaldehyde (PFA) working solution
2.5 ml PFA 32% stock
Add 10 ml 1× DPBS, no calcium, no magnesium
2. Wash Buffer (WB)
10 g BSA (final concentration 2%)
2 ml EDTA from 0.5 M stock (final concentration 2 mM)
Add 500 ml 1× DPBS, no calcium, no magnesium
Filter through 0.45 μm pores
3. Blocking Buffer (BB) (keep sterile)
15 g BSA (final concentration 3%)
5 ml porcine skin gelatin stock (final concentration 0.2%)
Add 50 ml 1× DPBS, no calcium, no magnesium
Filter through 0.45 μm pores
4. Porcine skin gelatin stock 2%
2 g porcine skin gelatin
100 ml ddH2O
5. 0.6 M KCl (keep ice-cold)
37.28 g KCl granular
1,000 ml ddH2O
Filter through 0.45 μm pores
6. Neutrophils complete medium (keep sterile)
5 ml L-glutamine from 200 mM stock (final concentration 2 mM)
500 ml RPMI-1640 without L-glutamine
Copyright © 2021 The Authors; exclusive licensee Bio-protocol LLC. 16Bio-protocol 11(04): e3927.
www.bio-protocol.org/e3927 DOI:10.21769/BioProtoc.3927
Acknowledgments
Authors would like to thank Dr. Mariana Kaplan (NIAMS) and Dr. Phil McCoy and the NHLBI Flow
Cytometry Core, for their excellent scientific and technical advice; Jim Nichols and Darlene Allen for
assisting with the recruitment of blood donors and Dr. Laxminath Tumburu for his help with the
figures. This work was supported by the Intramural Research Program of the National Heart, Lungs,
and Blood Institute, NIH (to SLT).
Competing interests
The authors declare no competing financial or non-financial interests.
Ethics
Informed consent was obtained from all subjects who provided blood samples enrolled in the study
protocol NCT0004799, approved by the NHLBI Institutional Review Board.
References
1. Barbu, E. A., Dominical, V. M., Mendelsohn, L. and Thein, S. L. (2019). Neutrophils remain
detrimentally active in hydroxyurea-treated patients with sickle cell disease. PLoS One 14(12):
e0226583.
2. Barbu, E. A., Dominical, V. M., Mendelsohn, L. and Thein, S. L. (2020). Detection and
Quantification of Histone H4 Citrullination in Early NETosis With Image Flow Cytometry Version
4. Front Immunol 11: 1335.
3. Barnado, A., Crofford, L. J. and Oates, J. C. (2016). At the Bedside: Neutrophil extracellular
traps (NETs) as targets for biomarkers and therapies in autoimmune diseases. J Leukoc Biol
99(2): 265-278.
4. Basiji, D. A. (2016). Principles of Amnis Imaging Flow Cytometry. Methods Mol Biol 1389: 13-
21.
5. Brinkmann, V., Reichard, U., Goosmann, C., Fauler, B., Uhlemann, Y., Weiss, D. S., Weinrauch,
Y. and Zychlinsky, A. (2004). Neutrophil extracellular traps kill bacteria. Science 303(5663):
1532-1535.
6. Claushuis, T. A. M., van der Donk, L. E. H., Luitse, A. L., van Veen, H. A., van der Wel, N. N.,
van Vught, L. A., Roelofs, J., de Boer, O. J., Lankelma, J. M., Boon, L., de Vos, A. F., van 't
Veer, C. and van der Poll, T. (2018). Role of Peptidylarginine Deiminase 4 in Neutrophil
Extracellular Trap Formation and Host Defense during Klebsiella pneumoniae-Induced
Pneumonia-Derived Sepsis. J Immunol 201(4): 1241-1252.
Copyright © 2021 The Authors; exclusive licensee Bio-protocol LLC. 17Bio-protocol 11(04): e3927.
www.bio-protocol.org/e3927 DOI:10.21769/BioProtoc.3927
7. Dominical, V., Samsel, L. and McCoy, J. P., Jr. (2017). Masks in imaging flow cytometry.
Methods 112: 9-17.
8. Gavillet, M., Martinod, K., Renella, R., Harris, C., Shapiro, N. I., Wagner, D. D. and Williams, D.
A. (2015). Flow cytometric assay for direct quantification of neutrophil extracellular traps in blood
samples. Am J Hematol 90(12): 1155-1158.
9. Ginley, B. G., Emmons, T., Lutnick, B., Urban, C. F., Segal, B. H. and Sarder, P. (2017).
Computational detection and quantification of human and mouse neutrophil extracellular traps
in flow cytometry and confocal microscopy. Sci Rep 7(1): 17755.
10. Guiducci, E., Lemberg, C., Kung, N., Schraner, E., Theocharides, A. P. A. and LeibundGut-
Landmann, S. (2018). Candida albicans-Induced NETosis Is Independent of Peptidylarginine
Deiminase 4. Front Immunol 9: 1573.
11. Gupta, S., Chan, D. W., Zaal, K. J. and Kaplan, M. J. (2018). A High-Throughput Real-Time
Imaging Technique To Quantify NETosis and Distinguish Mechanisms of Cell Death in Human
Neutrophils. J Immunol 200(2): 869-879.
12. Jorch, S. K. and Kubes, P. (2017). An emerging role for neutrophil extracellular traps in
noninfectious disease. Nat Med 23(3): 279-287.
13. Lee, K. H., Cavanaugh, L., Leung, H., Yan, F., Ahmadi, Z., Chong, B. H. and Passam, F. (2018).
Quantification of NETs-associated markers by flow cytometry and serum assays in patients with
thrombosis and sepsis. Int J Lab Hematol 40(4): 392-399.
14. Liang, Y., Pan, B., Alam, H. B., Deng, Q., Wang, Y., Chen, E., Liu, B., Tian, Y., Williams, A. M.,
Duan, X., Wang, Y., Zhang, J. and Li, Y. (2018). Inhibition of peptidylarginine deiminase
alleviates LPS-induced pulmonary dysfunction and improves survival in a mouse model of lethal
endotoxemia. Eur J Pharmacol 833: 432-440.
15. Manda-Handzlik, A., Ostafin, M., Bystrzycka, W., Sieczkowska, S., Moskalik, A., Demkow, U.
and Ciepiela, O. (2016). Flow cytometric quantification of neutrophil extracellular traps:
Limitations of the methodological approach. Am J Hematol 91(3): E9-10.
16. Masuda, S., Shimizu, S., Matsuo, J., Nishibata, Y., Kusunoki, Y., Hattanda, F., Shida, H.,
Nakazawa, D., Tomaru, U., Atsumi, T. and Ishizu, A. (2017). Measurement of NET formation in
vitro and in vivo by flow cytometry. Cytometry A 91(8): 822-829.
17. Muldur, S., Marand, A. L., Ellett, F. and Irimia, D. (2018). Measuring spontaneous neutrophil
motility signatures from a drop of blood using microfluidics. Methods Cell Biol 147: 93-107.
18. Neeli, I. and Radic, M. (2013). Opposition between PKC isoforms regulates histone deimination
and neutrophil extracellular chromatin release. Front Immunol 4: 38.
19. Pelletier, M. G., Szymczak, K., Barbeau, A. M., Prata, G. N., O'Fallon, K. S. and Gaines, P.
(2017). Characterization of neutrophils and macrophages from ex vivo-cultured murine bone
marrow for morphologic maturation and functional responses by imaging flow cytometry.
Methods 112: 124-146.
Copyright © 2021 The Authors; exclusive licensee Bio-protocol LLC. 18Bio-protocol 11(04): e3927.
www.bio-protocol.org/e3927 DOI:10.21769/BioProtoc.3927
20. Santos, A., Martin, P., Blasco, A., Solano, J., Cozar, B., Garcia, D., Goicolea, J., Bellas, C. and
Coronado, M. J. (2018). NETs detection and quantification in paraffin embedded samples using
confocal microscopy. Micron 114: 1-7.
21. Thalin, C., Daleskog, M., Goransson, S. P., Schatzberg, D., Lasselin, J., Laska, A. C., Kallner,
A., Helleday, T., Wallen, H. and Demers, M. (2017). Validation of an enzyme-linked
immunosorbent assay for the quantification of citrullinated histone H3 as a marker for neutrophil
extracellular traps in human plasma. Immunol Res 65(3): 706-712.
22. Zhao, W., Fogg, D. K. and Kaplan, M. J. (2015). A novel image-based quantitative method for
the characterization of NETosis. J Immunol Methods 423: 104-110.
23. Zharkova, O., Tay, S. H., Lee, H. Y., Shubhita, T., Ong, W. Y., Lateef, A., MacAry, P. A., Lim,
L. H. K., Connolly, J. E. and Fairhurst, A. M. (2019). A Flow Cytometry-Based Assay for High-
Throughput Detection and Quantification of Neutrophil Extracellular Traps in Mixed Cell
Populations. Cytometry A 95(3): 268-278.
Copyright © 2021 The Authors; exclusive licensee Bio-protocol LLC. 19You can also read