Nanoscale Advances - Royal Society of ...
←
→
Page content transcription
If your browser does not render page correctly, please read the page content below
Volume 2
                                                                                         Number 5
                                                                                         May 2020

Nanoscale
                                                                                         Pages 1743–2204

Advances
rsc.li/nanoscale-advances

                            ISSN 2516-0230

                            PAPER
                            Hiroshi Yukawa, Masazumi Fujiwara, Yoshinobu Baba et al.
                            A quantum thermometric sensing and analysis system using
                            fluorescent nanodiamonds for the evaluation of living stem
                            cell functions according to intracellular temperature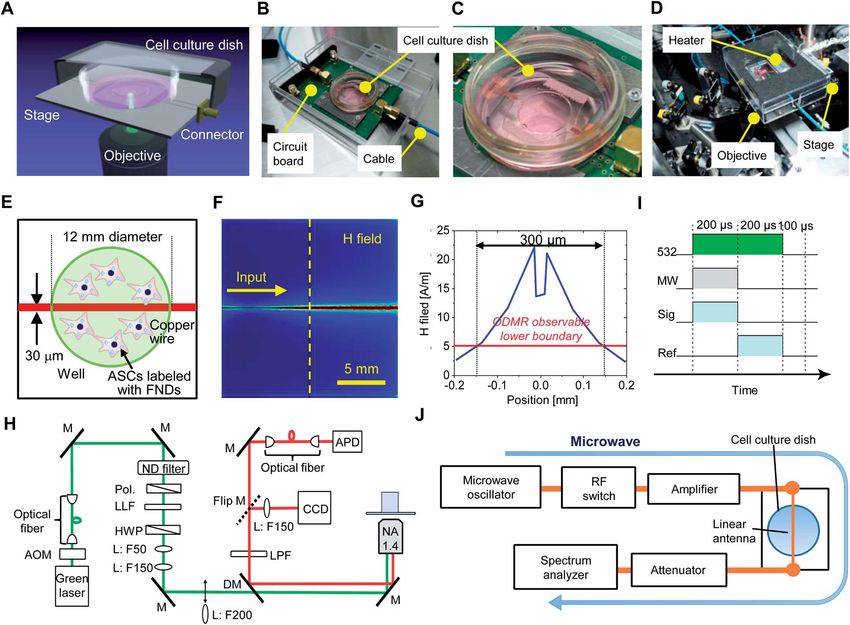
Nanoscale
Advances
This article is licensed under a Creative Commons Attribution-NonCommercial 3.0 Unported Licence.
View Article Online
PAPER View Journal | View Issue
A quantum thermometric sensing and analysis
Cite this: Nanoscale Adv., 2020, 2,
system using fluorescent nanodiamonds for the
Open Access Article. Published on 03 April 2020. Downloaded on 12/26/2020 7:42:42 PM.
1859 evaluation of living stem cell functions according
to intracellular temperature†
Hiroshi Yukawa, ‡*abc Masazumi Fujiwara, ‡*d Kaori Kobayashi,b Yuka Kumon,b
Kazu Miyaji,b Yushi Nishimura,cd Keisuke Oshimi,d Yumi Umehara,d Yoshio Teki, d
Takayuki Iwasaki,e Mutsuko Hatano,e Hideki Hashimotof and Yoshinobu Baba*abc
Intracellular thermometry techniques play an important role in elucidating the relationship between the
intracellular temperature and stem cell functions. However, there have been few reports on
thermometry techniques that can detect the intracellular temperature of cells during several days of
incubation. In this study, we developed a novel quantum thermometric sensing and analysis system
(QTAS) using fluorescent nanodiamonds (FNDs). FNDs could label adipose tissue-derived stem cells
(ASCs) at high efficiency with 24 h of incubation, and no cytotoxicity was observed in ASCs labeled with
less than 500 mg mL1 of FNDs. The peak of FNDs was confirmed at approximately 2.87 GHz with the
characteristic fluorescence spectra of NV centers that could be optically detected (optically detected
magnetic resonance [ODMR]). The ODMR peak clearly shifted to the high-frequency side as the
temperature decreased and gave a mean temperature dependence of (77.6 11.0) kHz C1, thus the
intracellular temperature of living ASCs during several days of culturing could be precisely measured
Received 21st February 2020
Accepted 30th March 2020
using the QTAS. Moreover, the intracellular temperature was found to influence the production of
growth factors and the degree of differentiation into adipocytes and osteocytes. These data suggest that
DOI: 10.1039/d0na00146e
the QTAS can be used to investigate the relationship between intracellular temperature and cellular
rsc.li/nanoscale-advances functions.
leading to various medical applications in regenerative medi-
1. Introduction cine. In particular, adipose tissue-derived stem cells (ASCs) have
Numerous types of stem cells, including induced pluripotent recently attracted considerable attention as a multipotent stem
stem (iPS) cells, embryonic stem (ES) cells, and somatic stem cell source for regenerative medicine,6,7 because large amounts
cells, have been established, and their medical applications in of ASCs can be obtained using methods that are relatively easy
regenerative medicine have been widely studied.1–5 Somatic to perform (e.g., lipoaspiration under local anesthesia) and
stem cells have already been conrmed to show great safety, because ASCs are known to produce large amounts of growth
factors (e.g., hepatocyte growth factor [HGF] and vascular
a
endothelial growth factor [VEGF]) in comparison to other
Institute of Nano-Life-Systems, Institutes of Innovation for Future Society, Nagoya
somatic stem cells.8–10 In addition, ASCs have the potential to
University, Nagoya, Japan. E-mail: h.yukawa@nanobio.nagoya-u.ac.jp; babaymtt@
chembio.nagoya-u.ac.jp self-renew and differentiate into many kinds of mesenchymal
b
Department of Biomolecular Engineering, Graduate School of Engineering, Nagoya cells including adipocytes and osteocytes.
University, Nagoya, Japan On the other hand, temperature is a very important param-
c
Institute of Quantum Life Science, National Institutes for Quantum and Radiological eter of the intracellular environment, since it can alter cell
Science and Technology, Chiba, Japan activities through the dynamics and reactivity of biomolecules.
d
Department of Chemistry, Graduate School of Science, Osaka City University, Osaka,
In recent years, the relationship between the temperature and
Japan. E-mail: masazumi@osaka-cu.ac.jp
e
the stem cell functions have been examined in a number of
Department of Electrical and Electronic Engineering, Graduate School of Engineering,
Tokyo Institute of Technology, Tokyo, Japan studies. Hossain et al. showed that mild heat exposure
f
School of Science and Technology, Kwansei Gakuin University, Hyogo, Japan increased the proliferation of neural stem/progenitor cells
† Electronic supplementary information (ESI) available. See DOI: (NCPCs) – possibly through the activation of the Akt pathway –
10.1039/d0na00146e and enhanced neuronal differentiation.11 Eskander et al.
‡ MT and HY contributed equally to the work presented here and should therefore showed that cold stimulation of stem cells of the apical papilla
be regarded as equivalent.
This journal is © The Royal Society of Chemistry 2020 Nanoscale Adv., 2020, 2, 1859–1868 | 1859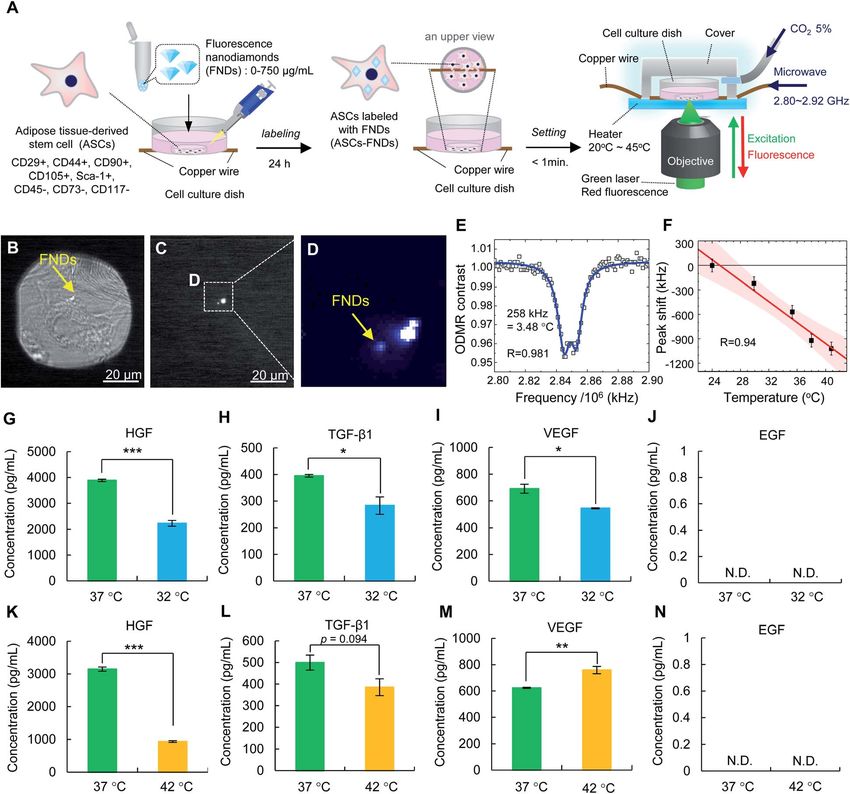
View Article Online
Nanoscale Advances Paper
(SCAP) signicantly increased the release of ATP (p < 0.01), and pass lter to remove the residual green laser scattering. The
that the supernatant collected aer cold stimulation of SCAP microscope was then coupled to an optical ber that acted as
was able to activate cultured trigeminal neurons.12 Velickovic a pinhole (1550HP, core diameter approximately 10 mm; Thor-
et al. also showed that bone marrow-derived mesenchymal stem labs, USA). Fiber-coupled uorescence was detected by an
This article is licensed under a Creative Commons Attribution-NonCommercial 3.0 Unported Licence.
cells could be driven to form beige-like adipocytes in vitro by avalanche photodiode (SPCM AQRH-14; Excelitas, USA).
exposure to a reduced temperature.13 However, the relationship Confocal uorescence scanning images were obtained by
between intracellular temperatures and stem cell functions scanning the sample with the piezo stage. Wide-eld uores-
remains unclear. cence images were obtained by switching the optical path to
Intracellular thermometry techniques therefore play an transfer images onto an EMCCD camera and defocusing the
important role in understanding the relationship between the green excitation laser.
intracellular temperature and stem cell conditions and func- Microwaves were generated from a microwave source
Open Access Article. Published on 03 April 2020. Downloaded on 12/26/2020 7:42:42 PM.
tions. Various kinds of intracellular thermometry techniques (SMB100A; Rohde & Schwarz, Germany) and amplied by 45 dB
have been reported, including thermo-sensitive uorescent (ZHL-16W-43+; Mini-circuit, USA). The microwaves were fed to
nanomaterials,14 micro/nano-scale thermoelectric couples,15 the microwave linear antenna (25 mm copper wire) in the in-
and infrared thermography.16 Among these, techniques using house-craed cell culture dishes. The typical microwave exci-
thermo-sensitive uorescent nanomaterials, including tation power used for the continuous-wave ODMR spectral
quantum dots (QDs), uorescent nanodiamonds (FNDs), gold measurement under impedance mismatch conditions was 35
nanoclusters and polymer nanoparticles, have been the main dBm (3.2 W). The magnetic eld distribution of the input
intracellular thermometric techniques applied due to their non- microwave was calculated by the nite-element method (COM-
invasiveness and high spatio-temporal properties in compar- SOL). The ODMR observable lower boundary of 5 A m1 was
ison to other techniques. However, there are few reports on determined by comparing the experimental results with the
thermometry techniques that can detect the intracellular simulation data. Avalanche photodiode (APD) detection was
temperature of stem cells during several days of incubation. gated for microwave irradiation ON and OFF using a radio-
Thus, we focused on uorescent quantum nanoparticles, frequency (RF) switch (ZYSWA-2-50DRS; Mini-circuit) and a bit
such as QDs and FNDs, which have evolved to elucidate various pattern generator (PBESR-PRO-300; Spincore, USA). The gate
biological activities both in vivo and in vitro.17,18 Fluorescent width of both gates was 200 ms. This was followed by an
quantum nanoparticles have excellent photostability with low initialization time of 100 ms, giving ION OFF
PL and IPL with a repetition
cytotoxicity and have proven useful in biological imaging and rate of 2 kHz. No external magnetic eld was applied in this
nanoscale thermometry.19–22 In particular, FNDs are expected to study.
provide unprecedented temperature sensitivity by exploiting the The measurement accuracy of the FND thermometers on the
coherent quantum properties of nitrogen vacancy (NV) centers. coverslip and in air was evaluated as previously reported using
sffiffiffiffiffiffiffiffiffiffiffiffiffiffiffiffiffiffiffiffiffiffiffiffiffiffiffiffiffiffiffiffiffiffiffiffiffiffiffiffiffiffiffiffiffiffiffiffiffiffi
NV centers possess unpaired electron spins in diamond lattice PN
structures that can be optically detected (optically detected dT ¼ ðTi Tdish Þ2 =ðN 1Þ, where Ti and Tdish are the
i¼1
magnetic resonance [ODMR]).23–26 The frequency of the ODMR
temperatures measured using the FND thermometers and the
depends on the temperature, which thereby enables the
dish temperature, respectively.21
measurement of nanoscale temperatures inside cells and
tissues.
In this study, we developed a novel quantum thermometric 2.2. Materials
sensing and analysis system (QTAS) by using FNDs that can FNDs were purchased from Adámas Nanotechnologies (Raleigh,
detect the intracellular temperature of stem cells during several VA, USA). Dulbecco's modied Eagle's medium (DMEM)/F12
days of culturing and investigated whether the intracellular and Hank's balanced salt solution were purchased from
temperature inuences the abilities of ASCs such as growth Thermo Fisher Scientic K.K. (Tokyo, Japan). Fetal bovine
factor production and differentiation. serum (FBS) was purchased from Trace Scientic Ltd. (Mel-
bourne, Australia). Collagenase Type I was purchased from
2. Methods Koken Co., Ltd. (Tokyo, Japan). A cell counting kit-8 (CCK-8) and
Hoechst33342 solution were purchased from DOJINDO Labo-
2.1. Quantum thermometry scheme ratories (Kumamoto, Japan). ELISA kits for mouse HGF, TGF-b1,
In-house-craed cell culture dishes were made of plastic dishes VEGF and EGF were purchased from R&D systems, Inc. (Min-
with a glass bottom (coverslips) in which copper wires (diam- neapolis, USA). Adipo-Inducer Reagent and Osteoblast-Inducer
eter: 30 mm) were placed. The dishes were sanitized with a UV Reagent were purchased from Takara Bio. Inc. (Shiga, Japan).
lamp before usage and then mounted on a three-axis scanning Phycoerythrin (PE)-conjugated anti-mouse CD29 and CD105,
piezo stage of a home-built confocal uorescence microscope. A lymphocyte antigen 6A/E (Ly-6A/E; also known as stem cell
continuous-wave 532 nm laser was used for excitation, with antigen-1 or Sca-1) antibodies, uorescein isothiocyanate
a typical excitation intensity of 4.7 W cm2. An oil-immersion (FITC)-conjugated anti-mouse CD45, CD90, and CD117 anti-
microscope objective with a numerical aperture of 1.4 was bodies, and allophycocyanin (APC)-conjugated anti-mouse
used for both excitation and uorescence collection. NV uo- CD44 antibodies were purchased from BD Biosciences (Tokyo,
rescence was ltered using a dichroic beam splitter and a long- Japan).
1860 | Nanoscale Adv., 2020, 2, 1859–1868 This journal is © The Royal Society of Chemistry 2020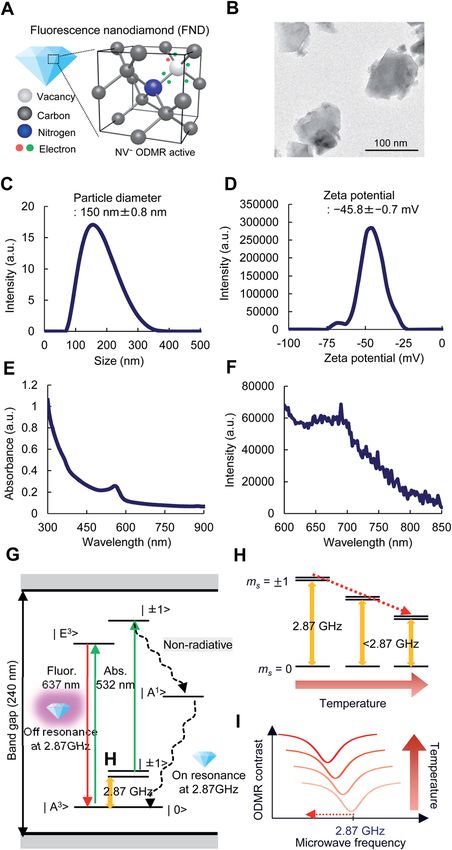
View Article Online
Paper Nanoscale Advances
2.3. Transmission electron microscopy 2.7. Transduction of FNDs into ASCs
The samples were adsorbed onto carbon-coated copper grids ASCs were incubated with FNDs (250 mg mL1) in a transduction
(400 mesh) and stained with 2% phosphotungstic acid solution medium (DMEM/F12 containing 2% FBS and 100 U mL1
(pH 7.0) for 10 s. The grids were then observed using a trans- penicillin/streptomycin) at 37 C. Aer 24 h of incubation, the
This article is licensed under a Creative Commons Attribution-NonCommercial 3.0 Unported Licence.
mission electron microscope (JEM-1400 Plus; JEOL Ltd., Tokyo, cells were washed 3 times using the transduction medium, and
Japan) at an acceleration voltage of 80 kV. Digital images (3296 the nuclei of ASCs were then stained with Hoechst33342 solu-
2472 pixels) were taken with a charge coupled device camera tion. The red uorescence derived from FNDs transduced into
(EM-14830RUBY2, JEOL Ltd.). ASCs was observed by high-speed multiphoton confocal laser
microscopy (A1MP+/A1RMP+; Nikon, Tokyo, Japan).
2.4. Particle properties
Open Access Article. Published on 03 April 2020. Downloaded on 12/26/2020 7:42:42 PM.
2.8. Observation of FND distribution in ASCs
The particle size and zeta potential distribution of FNDs in
water were measured using a dynamic light-scattering spectro- To observe the distribution of FNDs in ASCs, ASCs were incu-
photometer (ZETASIZER Nano-ZS; Malvern Instruments Ltd., bated at 37 C on 35 mm glass bottomed dishes (Matsunami
Hyogo, Japan). The particle size and zeta potential were ob- Glass Ind., Ltd., Osaka, Japan), and then FNDs (125 mg mL1)
tained from the peak of the size distribution graph. The were added into the dishes. Aer 24 h of incubation, the ASCs
absorbance spectra of FNDs were measured using an 8453A UV- were washed 3 times using the transduction medium, and the
visible spectrophotometer (Agilent Technology, Santa Clara, CA, nuclei were stained with Hoechst33342. The two- and three-
USA). The uorescence spectra were measured using a photonic dimensional distribution of FNDs in ASCs was conrmed
multichannel analyzer (PMA-12; Hamamatsu Photonics, Shi- using a super-resolution structured illumination microscope
zuoka, Japan). The excitation wavelength was 558 nm. (N-SIM; Nikon Co., Ltd.).
2.5. Isolation and culture of ASCs 2.9. The cytotoxicity of FNDs to ASCs
The methods used for the isolation and culture of ASCs have been ASCs (1 104 cells) were seeded in a 96-well plate (BD Falcon;
reported previously.10 In brief, 7 to 14 month-old female C57BL/6 BD Biosciences, Franklin Lakes, NJ, USA) with 100 mL of
mice were killed by cervical dislocation, and adipose tissue speci- culture medium and then cultured for 24 h at 37 C. FNDs
mens were isolated from the inguinal groove and washed with were transduced into ASCs in transduction medium. Aer
Hank's buffer to remove blood cells. All animal procedures were 24 h of incubation, the cells were washed 3 times with
performed in accordance with the Guidelines for Care and Use of transduction medium. The viable cells were then counted
Laboratory Animals of Nagoya University and approved by the using a cell counting kit-8 (CCK-8). CCK-8 reagent (10 mL) was
Animal Ethics Committee of Nagoya University. The adipose tissues added to each well, and the reaction was allowed to proceed
were cut nely and digested with type II collagenase at 37 C in for 2 h. The absorbance of the sample at 450 nm was
a shaking water bath for 90 min. Adipose tissue cells were sus- measured against a background control using a microplate
pended in cell culture medium (DMEM/F12 containing 20% FBS reader (Innite® 200 PRO; Tecan Japan Co., Ltd., Kawasaki,
and 100 U mL1 penicillin/streptomycin). The cells were centrifuged Japan).
at 1200 rpm for 5 min at room temperature to obtain pellets con-
taining the ASCs and then washed three times by suspension and 2.10. The proliferation of ASCs–FNDs
centrifuged in the culture medium. The primary cells were cultured ASCs (4 103 cells) were seeded in a 96 well plate with 100 mL of
for 4–5 days until they reached conuence; this was dened as culture medium for one day and then transduced with FNDs at
passage “0”. Cells from passages 2–5 were used in all experiments. various concentrations (0, 20, 50, 100, 500, and 750 mg mL1) for
24 h at 37 C. ASCs labeled with FNDs (ASCs–FNDs) were
2.6. Flow cytometry of ASCs washed three times with culture medium, and the medium was
then replaced with 100 mL of new culture medium. Aer 2, 5,
ASCs were incubated with antibodies for 30 min on ice. The anti-
and 7 days, the viable cells were counted using CCK-8. The
bodies used for detecting cell surface markers were as follows:
method was the same as that used to determine cytotoxicity.
phycoerythrin (PE)-conjugated anti-mouse CD29 (0.2 mg mL1) and
CD105 (0.2 mg mL1), lymphocyte antigen 6A/E (Ly-6A/E; also
known as stem cell antigen-1 or Sca-1; 0.2 mg mL1) antibodies, 2.11. Enzyme-linked immunosorbent assays
uorescein isothiocyanate (FITC)-conjugated anti-mouse CD45 ASCs (2 105 cells) were seeded in a cell culture dish with 1 mL
(0.5 mg mL1), CD90 (0.5 mg mL1), and CD117 antibodies (0.5 mg of culture medium overnight and then transduced with FNDs at
mL1) and allophycocyanin (APC)-conjugated anti-mouse CD44 a concentration of 5 mg mL1 for 24 h at 37 C. The ASCs–FNDs
antibodies (0.2 mg mL1). CD45 is a marker for pan-hematopoietic were washed three times with PBS, and then fresh transduction
cells. CD29 (b1 integrin) and CD44 (phagocytic glycoprotein-1) are medium (1 mL) was added into the cell culture dish and the
adhesion molecules and are used as markers for MSCs. CD90 (Thy- dish was incubated for 48 h (HGF, VEGF and epidermal growth
1) and CD105 (Endoglin) are markers for various stem cells, factor [EGF]) or 96 h (transforming growth factor-b1 [TGF-b1]) at
including MSCs. Flow cytometry was performed using a uores- 32 C, 37 C and 42 C. The culture supernatants were collected
cence activated cell sorter (FACS) (Calibur, BD Biosciences). aer incubation, and then the levels of mouse HGF, VEGF, TGF-
This journal is © The Royal Society of Chemistry 2020 Nanoscale Adv., 2020, 2, 1859–1868 | 1861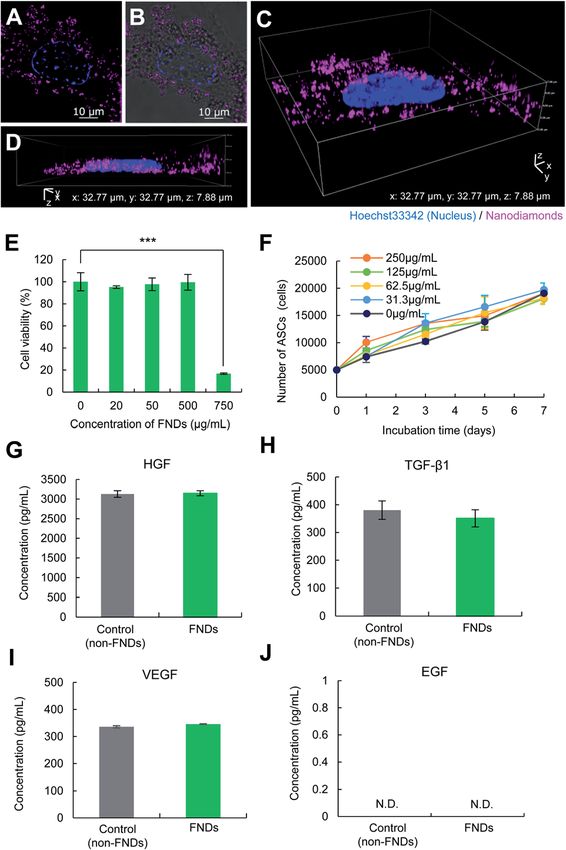
View Article Online
Nanoscale Advances Paper
b1, and EGF produced by ASCs or ASCs–FNDs in the medium 10% FBS. Differentiation was conrmed by the staining of any
were measured using specic kits according to the manufac- alkaline phosphatase activity.
turers' protocols.
2.13. The statistical analysis of cell properties
This article is licensed under a Creative Commons Attribution-NonCommercial 3.0 Unported Licence.
2.12. Adipogenic and osteogenic differentiation Numerical values are presented as the mean standard error.
Adipogenic differentiation was induced by culturing the cells for 3 Each experiment was repeated three times. Statistical signi-
days in DMEM (high glucose) containing 100 mM indometacin, cance was evaluated using an unpaired Student's t-test for
1 mM dexamethasone, 1 mM hydrocortisone, 10 mM insulin (I- comparisons between two groups; P values of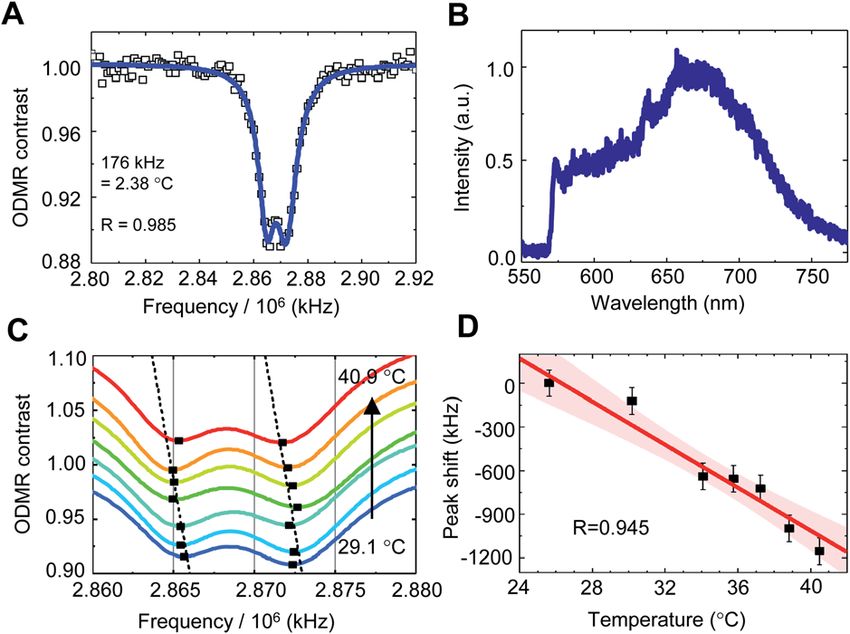
View Article Online
Paper Nanoscale Advances
uorescence microscope that was built in house are shown in
Fig. 1B–D. The cell culture dish (built in-house) was composed
of a plastic dish with a glass bottom (coverslip) with a copper
wire (diameter, 30 mm) located between the plastic dish and
This article is licensed under a Creative Commons Attribution-NonCommercial 3.0 Unported Licence.
coverslip. ASCs could be incubated in our cell culture dish for
several days. A schematic illustration of cells labeled with FNDs
in the dish is shown in Fig. 1E. The magnetic eld distribution
on the dish and a cross-section of the area indicated with the
vertical dashed line is shown in Fig. 1F. The area in which
ODMR could be effectively performed was approximately 300
mm around the copper wire located in the center of the dish
Open Access Article. Published on 03 April 2020. Downloaded on 12/26/2020 7:42:42 PM.
(Fig. 1G). A schematic diagram of the optical setup of the
confocal microscope in the QTAS is shown in Fig. 1H. A
microwave circuit diagram and the timing of the laser and
microwave are shown in Fig. 1I, while the diagram for photon
detection using the QTAS is shown in Fig. 1J.
3.2. Temperature stability of the QTAS
The temperature stability of the thermometry experiments was
measured by placing a tiny thermocouple on the surface of the
coverslips of the in-house-craed cell culture dishes (Fig. 2A–D).
The temporal temperature proles for 35 min at 3 different set
temperatures (36.6 C, 37.9 C, and 41.8 C) are shown in
Fig. 2A–C, respectively. A prole of the 12 h temperature
stability at 41.8 C is shown in Fig. 2D. These data suggested
that the stability was 0.1 C for 30 min and 0.2 C for 12 h.
3.3. Operating principles of the QTAS by using uorescent
nanodiamonds (FNDs)
A schematic drawing of FNDs with NV centers in the diamond
lattice structures is shown in Fig. 3A. The vacancy, carbon,
nitrogen, and electrons in a FND are shown by light gray, dark
Fig. 3 Schematic illustration of FND-based quantum thermometry. (A)
An illustration of the crystal structure of negatively charged NV centers
(NV) that are ODMR-active. (B) A transmission electron micrograph of
FNDs. (C) The size of FNDs. The average diameter of FNDs was 150
0.8 nm (range: 80 to 300 nm). (D) The zeta potential of FNDs. The
average zeta potential of FNDs was 45.8 0.7 mV (range: 75 to 25
mV). (E, F) The absorbance (E) and fluorescence (F) spectra of FNDs in
water. (G) A diagram of the energy levels of NV centers. The green, red,
yellow sinusoidal, and black dashed sinusoidal arrows represent optical
excitation, fluorescence emission, microwave excitation and inter-
system crossing relaxation, respectively. (H, I) Schematic illustrations of
the temperature dependence of the ODMR spectra. The fluorescence
intensity of FNDs is decreased when the electron-spin-resonant is
irradiated by microwaves at approximately 2.87 GHz (H). The ODMR
peak is shifted to the lower frequency side as the temperature
increases (I).
Fig. 2 The temperature stability of the thermometry experiments on
the surface of coverslips of the in-house-crafted cell culture dishes by gray, blue, and red or green circles, respectively. An image of
placing a tiny thermocouple. The temporal temperature profiles for FNDs under a transmission electron microscope (TEM) is
35 min at 3 different set temperatures (36.6 C (A), 37.9 C (B), and shown in Fig. 3B. FNDs had a rock-like shape, with an average
41.8 C (C)) were shown. A profile of the 12 h temperature stability at
diameter of 150 0.8 nm (range, 80–330 nm) (Fig. 3C). The
41.8 C was shown (D). The stability was 0.1 C for 30 min and
0.2 C for 12 h. average zeta potential of FNDs was 45.8 0.7 mV (range, 75
This journal is © The Royal Society of Chemistry 2020 Nanoscale Adv., 2020, 2, 1859–1868 | 1863
View Article Online
Nanoscale Advances Paper
to 25 mV) (Fig. 3D). The absorbance and uorescence spectra then varied from 40.9 C to 29.1 C (Fig. 4C). The ODMR peak
of FNDs in water are shown in Fig. 3E and F. Each FND particle clearly shied to the high-frequency side as the temperature
contained approximately 500 NV centers. decreased. These temperature-dependent measurements were
NV centers have a spin-triplet electronic ground state with performed for multiple FNDs (n ¼ 15) to calibrate the frequency
This article is licensed under a Creative Commons Attribution-NonCommercial 3.0 Unported Licence.
a long electron spin coherence time.23 NV centers deeply create shi of the ODMR of the FND quantum thermometers (Fig. 4D).
defect states, denoted as and for the ground and The solid line and the associated shaded areas were linearly
excited states, respectively, in a diamond band gap of 5.1 eV tted to the data and the 95% condence interval, which gives
(roughly 240 nm) (Fig. 3G). Optical transitions between these two a mean temperature dependence of (77.6 11.0) kHz C1 in
states absorb 532 nm green laser light and emit red-shied uo- close agreement with that reported previously.27
rescence in the range of 630–750 nm with a zero-phonon line of The ODMR measurements took 3–6 min depending on the
637 nm. The state has magnetic sublevels of with measurement parameters, such as the number of accumula-
Open Access Article. Published on 03 April 2020. Downloaded on 12/26/2020 7:42:42 PM.
zero-eld splitting of 2.87 GHz. There is a non-radiative intersystem tions, frequency resolutions and frequency sweep range. The
crossing between and the metastable singlet state temperature-induced uctuation of the ODMR peak position
. In the resonance induced by microwave excitation at 2.87 during the measurement was therefore estimated to be
GHz, a fraction of the electrons is non-radiatively decayed to approximately 3.5 kHz, an order of magnitude smaller than the
. Thus, the change in the uorescence between present accuracy of quantum thermometry. Note that the pH
and can be detected when the microwave frequency is and ionic strength had no signicant effect on the ODMR peak
resonant to this zero-eld splitting. The zero-eld splitting has shi, as conrmed previously.28
a temperature dependence due to the thermal expansion of the
lattice structures and provides local temperature information 3.5. Introduction of FNDs into ASCs
(Fig. 3H and I). The local temperature of ASCs was measured by
ASCs (CD29+, CD44+, CD90+, CD105+, Sca-1+, CD45, CD73,
measuring the frequency shi of the ODMR peak of the FNDs.
and CD117) were incubated with FNDs (125 mg mL1) for 24 h
and then observed using super-resolution structured illumina-
tion microscopy. The red uorescence derived from FNDs was
3.4. Calibration of the QTAS by using FNDs
observed in the ASCs (Fig. 5A and B). Three-dimensional images
To calibrate the temperature response of the QTAS, FNDs were were observed to further investigate the distribution of FNDs in
spin-coated on the surface of the glass bottom (coverslip) in ASCs. FNDs were widely distributed in ASCs, but none were
a cell culture dish, and their ODMR and uorescence spectra observed in the nucleus of ASCs (Fig. 5C and D). In addition,
were measured at 40.9 C (without cell culture medium) almost all ASCs were able to be labeled with FNDs with high
(Fig. 4A–D). A doubly split ODMR peak of FNDs was conrmed efficiency (Fig. S1A–D†), and FNDs were mainly introduced into
at approximately 2.87 GHz (Fig. 4A) with characteristic uores- ASCs via micropinocytosis in the endocytosis pathway.
cence spectra of NV centers (Fig. 4B). The temperature of the
glass bottom spin-coated with FNDs in the cell culture dish was
3.6. Cytotoxicity of FNDs to ASCs and the differentiation
ability of ASCs–FNDs
To examine the cytotoxicity of FNDs to ASCs, various concen-
trations (0, 20, 50, 100, 500, and 750 mg mL1) of FNDs were
transduced into ASCs for 24 h at 37 C. More than 95% of the
ASCs were observed to be alive at FND concentrations of #500
mg mL1. Signicant cytotoxicity was conrmed in ASCs trans-
duced with 750 mg mL1 of FNDs, and >75% of the cells were
dead (Fig. 5E). The inuence of FNDs on the proliferation rate of
ASCs was also investigated within the non-cytotoxic range of
concentrations. ASCs labeled with FNDs (ASCs–FNDs) exhibited
a growth rate that was nearly equal to that of normal (non-
labeled) ASCs. There were no signicant differences in the
proliferation of ASCs at these concentrations (Fig. 5F). These
data suggest that ASCs can be labeled with FNDs at concen-
trations of #500 mg mL1.
In addition, to examine the inuence of FNDs (125 mg mL1)
Fig. 4 Calibration of the ODMR peak shift of FNDs in the QTAS. (A) on the differentiation ability of ASCs into adipocytes and oste-
Typical ODMR spectrum of a single FND measured at 40.9 C. (B) The ocytes, normal ASCs (control) and ASCs–FNDs were differenti-
fluorescence spectrum of this FND. (C) A close-up of the ODMR peaks ated into adipocytes and osteoblasts. The differentiation
of this FND at temperatures from 29.1 C to 40.9 C. The dashed lines
abilities of ASCs–FNDs into both adipocytes and osteoblasts
were linearly fitted to the positions of the peaks. (D) The ODMR peak
shifted to the high-frequency side as the temperature decreased. The were similar to those of normal ASCs (Fig. S2A and B†). These
solid line and the associated shaded area are the linear fit and the 95% data suggest that FNDs (View Article Online
Paper Nanoscale Advances
functions of ASCs such as growth factor production and
differentiation.
3.8. Detection of the intracellular temperature of living
This article is licensed under a Creative Commons Attribution-NonCommercial 3.0 Unported Licence.
ASCs–FNDs using the QTAS
A schematic diagram of the measurement of the intracellular
temperature of living ASCs–FNDs using the QTAS is shown in
Fig. 6A. The changes of the intracellular temperature of living
ASCs could be detected by the QTAS during several days of
incubation. Two types of microscope images (white-light illu-
Open Access Article. Published on 03 April 2020. Downloaded on 12/26/2020 7:42:42 PM.
mination with FND uorescence and FND uorescence alone)
of living ASCs–FNDs in the cell culture dish are shown in Fig. 6B
and C. A few FNDs near the nucleus could be observed. The
corresponding confocal uorescence scanning micrograph of
the box (16 16 mm2) in Fig. 6C is shown in Fig. 6D. Yellow
arrows indicate the FNDs in ASCs, and the uorescence derived
from FNDs in ASCs could be observed (Fig. 6D). The ODMR
spectrum of FNDs in living ASCs (indicated by an arrow in
Fig. 6D) at 40.9 C was measured (Fig. 6E). This FND showed
a sharp ODMR peak prole, and the ODMR peak was tted with
a two-peak Lorentzian prole to determine the position of the
peak. When the dish temperature was then varied between
24.0 C and 40.9 C, a plot of the ODMR peak shi as a function
of temperature was obtained (Fig. 6F). Linear tting to the data
with an experimentally determined slope of (77.6 11.0) kHz
1
C (Fig. 4D) was carried out, which shows good agreement
with R2 ¼ 0.94. The accuracy was 79.4 kHz (1.0 C). In
addition, the changes in the intracellular temperature of xed
ASCs could be detected using the QTAS (Fig. S3†). The sensi-
pffiffiffiffiffiffi
Fig. 5 Influence of FND labeling of ASCs. (A–D) Two- and three- tivity of the QTAS was 2:2 C= Hz by considering the line-
dimensional fluorescence images of ASCs labeled with FNDs (ASCs– width, ODMR contrast and photon counts to be 12.1 MHz, 0.05
FNDs). Two-dimensional fluorescence images (A), a merged image and 2 Mcps, respectively.29 This sensitivity is comparable to
(bright field and fluorescence images) (B) and three-dimensional previous reports based on the same whole-spectrum method.22
fluorescence images (C, D). (E) The viability of ASCs–FNDs at different
These data showed that the QTAS successfully detected
concentrations of FNDs. (F) The proliferation rate of ASCs–FNDs with
non-cytotoxic concentrations of FNDs. (G, H) The comparison of the continuous temperature changes in living stem cells. Note that
production of growth factors (HGF [G], VEGF [H], TGF-b1 [I], and EGF the FND concentration of 5 mg mL1 was used for labeling ASCs
[J]) between ASCs (non-labeled) and ASCs–FNDs. The data are shown in this experiment to facilitate tracking the same FND for a long
as mean SD values. ***p < 0.001. time.
3.7. Inuence of FNDs on the stem cell ability of ASCs 3.9. Inuence of intracellular temperature on the stem cell
ASCs have an important ability to produce growth factors such abilities of ASCs
as HGF, TGF-b1, VEGF and EGF in regenerative medicine. To To conrm the inuence of the intracellular temperature on the
conrm the inuence of FNDs on the production of growth production ability of growth factors from ASCs, the levels of
factors from ASCs–FNDs, the HGF (Fig. 5G), TGF-b1 (Fig. 5H), HGF, TGF-b1, VEGF and EGF in the culture medium aer ASC
VEGF (Fig. 5I), and EGF (Fig. 5J) levels in the supernatant of the incubation were measured using appropriate ELISA kits
culture medium, the ASCs of which were incubated for 48 h or (Fig. 6G–N). The levels of HGF (Fig. 6G), TGF-b1 (Fig. 6H) and
96 h, were measured using each ELISA kit. The production of VEGF (Fig. 6I) from ASCs at 32 C were signicantly lower than
HGF, TGF-b1 and VEGF from ASCs–FNDs could be conrmed, those at 37 C. On the other hand, the levels of HGF (Fig. 6K)
and the levels were maintained at the same level as that from with a signicant difference and TGF-b1 (Fig. 6L) at 42 C were
non-labeled ASCs (control). On the other hand, the production lower than those at 37 C, while the level of VEGF (Fig. 6M) at
of EGF could not be conrmed in either normal ASCs (control) 42 C was signicantly higher than that at 37 C. On the other
or ASCs–FNDs. Moreover, to conrm the inuence of FNDs on hand, the production of EGF (Fig. 6J and N) from ASCs could
the differentiation ability of ASCs, ASCs–FNDs were differenti- not be detected under any of the temperature conditions.
ated into adipocytes and osteocytes at 37 C. ASCs–FNDs could Moreover, to conrm the inuence of intracellular temperature
be conrmed to differentiate into adipocytes and osteocytes. on the differentiation ability of ASCs, ASCs were differentiated
These data suggested that FNDs do not affect the stem cell into adipocytes and osteocytes at 32 C and 42 C for 2 weeks.
This journal is © The Royal Society of Chemistry 2020 Nanoscale Adv., 2020, 2, 1859–1868 | 1865View Article Online
Nanoscale Advances Paper
This article is licensed under a Creative Commons Attribution-NonCommercial 3.0 Unported Licence.
Open Access Article. Published on 03 April 2020. Downloaded on 12/26/2020 7:42:42 PM.
Fig. 6 Detection of the temperature change inside living ASCs–FNDs using the QTAS. (A) A schematic diagram of the measurement of the
temperature change inside living ASCs–FNDs using the QTAS. (B, C) Two types of micrographs of living ASCs–FNDs in an in-house-crafted cell
culture dish: white-light illumination with FND fluorescence (B) and FND fluorescence alone (white-light off) (C). (D) Confocal fluorescence
scanning image of the small box in (C). (E) The ODMR spectrum of the FND indicated by a yellow arrow in (D) at 40.8 C with fitted functions. (F)
The observed peak shifts as a function of the dish temperatures. The solid line and the associated shaded area are the linear fit and 95%
confidence interval. (G–J) The comparison of the production of growth factors (HGF [G], VEGF [H], TGF-b1 [I], and EGF [J]) by ASCs–FNDs
between at 37 C and 42 C. (K–N) The comparison of the production of growth factors (HGF [K], VEGF [L], TGF-b1 [M], and EGF [N]) by ASCs–
FNDs between at 37 C and 32 C. The data are shown as mean SD values. *p < 0.05, **p < 0.01, ***p < 0.001.
ASCs could not survive and differentiate into adipocytes and understanding the relationship between intracellular tempera-
osteocytes at either 32 C or 42 C (data not shown). These data ture and stem cell functions, because the temperature is not
suggested that intracellular temperature may affect the stem spatially uniform in realistic situations of stem cell trans-
cell functions of ASCs, such as their production of growth plantation. However, there are few reports on thermometry
factors and differentiation ability. techniques can detect intercellular temperature during several
days of incubation. We developed a novel QTAS for this
purpose. The in-house-craed cell culture dish used in the
4. Discussion QTAS was designed based on a 35 mm glass bottomed dish.
Coating the surface of the glass bottom with substances such as
In regenerative medicine, the development of an intracellular bronectin and gelatin was easy; thus, sensitive cells, including
thermometry technique for measuring the temperature of living stem cells, could be incubated in this in-house-craed cell
cells during several days of incubation is necessary for
1866 | Nanoscale Adv., 2020, 2, 1859–1868 This journal is © The Royal Society of Chemistry 2020View Article Online
Paper Nanoscale Advances
culture dish with high versatility. In addition, an in-house-built The QTAS enabled us to demonstrate quantum thermometry of
confocal uorescence microscope was incorporated in the ASCs by detecting the spectral peak shi of NV centers in FNDs on
QTAS, so the morphology of living cells could be observed in ODMR, which was dependent on the intracellular temperature. In
real time. On the other hand, living cells around the copper wire this study, the levels of growth factor production (HGF, VEGF and
This article is licensed under a Creative Commons Attribution-NonCommercial 3.0 Unported Licence.
located in the cell culture dish could be programmatically TGF-b1) were found to be signicantly changed by the intracellular
irradiated with microwaves. At present microwave irradiation temperature. Transient receptor potential (TRP) channels, which
can only be performed around the linear microwave antenna. respond to physical stimuli (temperature, osmotic pressure, and
The irradiation area could be increased up to several square mechanical stimulation) and which exchange intracellular signals,
millimeters by employing loop gap antenna structures. Thus, are considered to be thermometric sensors in cells. At present, the
the QTAS using FNDs was expected to be serve as a novel TRP channels are known to inuence the proliferation, differen-
quantum intracellular thermometry system. tiation and death mechanism of various types of cells. TRPV1,
Open Access Article. Published on 03 April 2020. Downloaded on 12/26/2020 7:42:42 PM.
We focused on FNDs as uorescence quantum nanoparticles, TRPM2 and TRPV8 in TRP channels, which can detect tempera-
because of their excellent photostability, low cytotoxicity and tures of 42 C and 37 C, were found to be expressed on ASCs (data
ODMR activity. The FNDs used in this study contained approxi- not shown); thus, the intracellular temperature was assumed to
mately 500 NV centers and the diameter was from approximately inuence the growth factor production through these TRP chan-
80 nm to 330 nm; thus, the FNDs could be introduced into stem nels. In addition to ASCs, this QTAS can be applied to other types
cells with low cytotoxicity and detect the intracellular temperature of cells, such as other stem cells, cancer cells, normal cells and
of the cells. However, the shapes of the ODMR spectra of FNDs were organoids, and is therefore expected to contribute to the elucida-
found to be heterogeneous, as shown in Fig. 4A. The spectral shape tion of the relationship between intracellular temperatures and
of the ODMR peak affects the precision of thermometry. The cell functions.39,40
double-peak structure in the ODMR spectra could not be perfectly
reproduced by the two-peak Lorentzian proles; thus, it was diffi- 5. Conclusions
cult to determine the peak position with high accuracy. We instead
measured the ODMR peak shi dependent on temperature in the We developed a novel QTAS using FNDs in order to elucidate the
broad range of 24–40 C, and achieved a thermometer accuracy of relationship between intracellular temperature and stem cell
1.0 C. If the ODMR peak did not have a peak split, then the same functions. ASCs could be labeled with FNDs at high efficiency
level of accuracy could be obtained with a higher precision of with 24 h of incubation, and no cytotoxicity was observed in
0.5 C. This also highlights the importance of the uniformity of ASCs labeled withView Article Online
Nanoscale Advances Paper
priority research). This work was also supported by a Grant-in- J. A. Capobianco and J. G. Solé, Nano Lett., 2010, 10, 5109–
Aid for Scientic Research on Innovative Areas “Chemistry for 5115.
Multimolecular Crowding Biosystems” (JSPS KAKENHI Grant 20 R. Tanimoto, T. Hiraiwa, Y. Nakai, Y. Shindo, K. Oka,
No. 17H06354). N. Hiroi and A. Funahashi, Sci. Rep., 2016, 6, 22071.
This article is licensed under a Creative Commons Attribution-NonCommercial 3.0 Unported Licence.
21 G. Kucsko, P. C. Maurer, N. Y. Yao, M. Kubo, H. J. Noh,
References P. K. Lo, H. Park and M. D. Lukin, Nature, 2013, 500, 54–58.
22 D. A. Simpson, E. Morrisroe, J. M. McCoey, A. H. Lombard,
1 Y. Shi, H. Inoue, J. C. Wu and S. Yamanaka, Nat. Rev. Drug D. C. Mendis, F. Treussart, L. T. Hall, S. Petrou and
Discovery, 2017, 16, 115–130. L. C. L. Hollenberg, ACS Nano, 2017, 11, 12077–12086.
2 M. Nakagawa, M. Koyanagi, K. Tanabe, K. Takahashi, 23 M. W. Doherty, N. B. Manson, P. Delaney, F. Jelezko,
T. Ichisaka, T. Aoi, K. Okita, Y. Mochiduki, N. Takizawa J. Wrachtrup and L. C. L. Hollenberga, Phys. Rep., 2013,
Open Access Article. Published on 03 April 2020. Downloaded on 12/26/2020 7:42:42 PM.
and S. Yamanaka, Nat. Biotechnol., 2008, 26, 101–106. 528, 1–45.
3 J. Andersen and S. P. Pașca, Nature, 2018, 563, 44–45. 24 P. Neumann, I. Jakobi, F. Dolde, C. Burk, R. Reuter,
4 L. Beccari, N. Moris, M. Girgin, D. A. Turner, P. Baillie- G. Waldherr, J. Honert, T. Wolf, A. Brunner and
Johnson, A. C. Cossy, M. P. Lutolf, D. Duboule and J. H. Shim, Nano Lett., 2013, 13, 2738–2742.
A. M. Arias, Nature, 2018, 562, 272–276. 25 M. Fujiwara, Y. Shikano, R. Tsukahara, S. Shikata and
5 Y. Mizunaga, S. Terai, N. Yamamoto, K. Uchida, T. Yamasaki, H. Hashimoto, Sci. Rep., 2018, 8, 14773.
N. Nishina, Y. Fujita, K. Shinoda, Y. Hamamoto and 26 M. Fujiwara, K. Yoshida, T. Noda, H. Takashima,
I. Sakaida, Cell Transplant., 2012, 21, 2363–2375. A. W. Schell, N. Mizuochia and S. Takeuchi,
6 C. X. Zheng, B. D. Sui, N. Liu, C. H. Hu, T. He, X. Y. Zhang, Nanotechnology, 2016, 27, 455202.
P. Zhao, J. Chen, K. Xuan and Y. Jin, Sci. Rep., 2018, 8, 5215. 27 V. M. Acosta, E. Bauch, M. P. Ledbetter, A. Waxman,
7 R. Doi, Y. Tsuchiya, N. Mitsutake, S. Nishimura, M. Matsuu- L. S. Bouchard and D. Budker, Phys. Rev. Lett., 2010, 104,
Matsuyama, Y. Nakazawa, T. Ogi, S. Akita, H. Yukawa, 070801.
Y. Baba, N. Yamasaki, K. Matsumoto, T. Miyazaki, 28 M. Fujiwara, R. Tsukahara, Y. Sera, H. Yukawa, Y. Baba,
R. Kamohara, G. Hatachi, H. Sengyoku, H. Watanabe and S. Shibata and H. Hashimoto, RSC Adv., 2019, 9, 12606.
T. Obata, Sci. Rep., 2018, 7, 8447. 29 G. Q. Liu, X. Feng, N. Wang, Q. Li and R. B. Liu, Nat.
8 D. Onoshima, H. Yukawa and Y. Baba, Adv. Drug Delivery Commun., 2019, 10, 1344.
Rev., 2015, 95, 2–14. 30 C. Foy, L. Zhang, M. E. Trusheim, K. R. Bagnall, M. Walsh,
9 H. Yukawa, M. Watanabe, N. Kaji, Y. Okamoto, M. Tokeshi, E. N. Wang and D. R. Englund, 2020, arXiv:1903.05717.
Y. Miyamoto, N. Noguchi, Y. Baba and S. Hayashi, 31 S. P. Blaber, C. J. Hill, R. A. Webster, J. M. Say, L. J. Brown,
Biomaterials, 2012, 33, 2177–2186. S. C. Wang, G. Vesey and B. R. Herbert, PLoS One, 2013, 8,
10 H. Yukawa, Y. Kagami, M. Watanabe, K. Oishi, Y. Miyamoto, e52997.
Y. Okamoto, M. Tokeshi, N. Kaji, H. Noguchi, K. Ono, 32 T. C. Hsu, K. K. Liu, H. C. Chang, E. Hwang and J. I. Chao,
M. Sawada, Y. Baba, N. Hamajima and S. Hayashi, Sci. Rep., 2014, 4, 5004.
Quantum dots labeling using octa-arginine peptides for 33 K. K. Liu, C. C. Wang, C. L. Cheng and J. I. Chao,
imaging of adipose tissue-derived stem cells, Biomaterials, Biomaterials, 2009, 30, 4249–4259.
2010, 31, 4094–4103. 34 J. S. Donner, S. A. Thompson, M. P. Kreuzer, G. Baffou and
11 M. E. Hossain, K. Matsuzaki, M. Katakura, N. Sugimoto, R. Quidant, Nano Lett., 2012, 12, 2107–2112.
A. A. Mamun, R. Islam, M. Hashimoto and O. Shido, PLoS 35 J. S. Donner, S. A. Thompson, C. Alonso-Ortega, J. Morales,
One, 2017, 12, e0190356. L. G. Rico, S. I. Santos and R. Quidant, ACS Nano, 2013, 7,
12 M. A. Eskander, K. Takimoto and A. Diogenes, Neuroscience, 8666–8672.
2017, 360, 61–67. 36 S. Kiyonaka, T. Kajimoto, R. Sakaguchi, D. Shinmi,
13 K. Velickovic, H. A. Lugo Leija, I. Bloor, J. Law, H. Sacks, M. Omatsu-Kanbe, H. Matsuura, H. Imamura,
M. Symonds and V. Sottile, Sci. Rep., 2018, 8, 4974. T. Yoshizaki, I. Hamachi, T. Morii and Y. Mori, Nat.
14 F. Vetrone, R. Naccache, A. Zamarrón, A. Juarranz de la Methods, 2013, 10, 1232–1238.
Fuente, F. Sanz-Rodrı́guez, L. Martinez Maestro, E. Martı́n 37 K. Okabe, N. Inada, C. Gota, Y. Harada, T. Funatsu and
Rodriguez, D. Jaque, J. Garcı́a Solé and J. A. Capobianco, S. Uchiyama, Nat. Commun., 2012, 3, 705.
ACS Nano, 2010, 4, 3254–3258. 38 T. Tsuji, K. Ikado, H. Koizumi, S. Uchiyama and K. Kajimoto,
15 S. Sadat, A. Tan, Y. J. Chua and P. Reddy, Nano Lett., 2010, 10, Sci. Rep., 2017, 7, 12889.
2613–2617. 39 T. Takebe, K. Sekine, M. Enomura, H. Koike, M. Kimura,
16 R. Legrand, M. Abi Ghanem, L. Plawinski, M.-C. Durrieu, T. Ogaeri, R. R. Zhang, Y. Ueno, Y. W. Zheng, N. Koike,
B. Audoin and T. Dehoux, Appl. Phys. Lett., 2015, 107, 263703. S. Aoyama, Y. Adachi and H. Taniguchi, Nature, 2013, 499,
17 W. W. Hsiao, Y. Y. Hui, P. C. Tsai and H. C. Chang, Acc. 481–484.
Chem. Res., 2016, 49, 400–407. 40 Q. Ding and C. A. Cowan, Cell Res., 2013, 23, 1242–1243.
18 H. Yukawa and Y. Baba, Anal. Chem., 2017, 89, 2671–2681.
19 L. M. Maestro, E. M. Rodrı́guez, F. S. Rodrı́guez, M. C. la
Cruz, A. Juarranz, R. Naccache, F. Vetrone, D. Jaque,
1868 | Nanoscale Adv., 2020, 2, 1859–1868 This journal is © The Royal Society of Chemistry 2020You can also read