Cooperative CO2-to-ethanol conversion via enriched intermediates at molecule-metal catalyst interfaces
←
→
Page content transcription
If your browser does not render page correctly, please read the page content below
Articles
https://doi.org/10.1038/s41929-019-0383-7
Cooperative CO2-to-ethanol conversion via
enriched intermediates at molecule–metal
catalyst interfaces
Fengwang Li 1,3, Yuguang C. Li 1,3, Ziyun Wang 1,3, Jun Li 1,2,3, Dae-Hyun Nam 1, Yanwei Lum1,
Mingchuan Luo1, Xue Wang 1, Adnan Ozden2, Sung-Fu Hung1, Bin Chen1, Yuhang Wang 1,
Joshua Wicks1, Yi Xu 2, Yilin Li1, Christine M. Gabardo 2, Cao-Thang Dinh 1, Ying Wang 1,
Tao-Tao Zhuang1, David Sinton 2 and Edward H. Sargent 1*
Electrochemical conversion of CO2 into liquid fuels, powered by renewable electricity, offers one means to address the need for
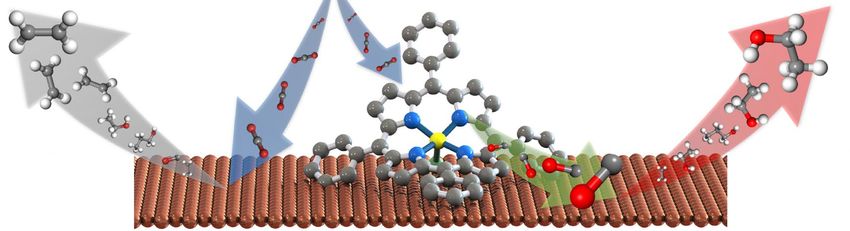
the storage of intermittent renewable energy. Here we present a cooperative catalyst design of molecule–metal catalyst inter-
faces with the goal of producing a reaction-intermediate-rich local environment, which improves the electrosynthesis of ethanol
from CO2 and H2O. We implement the strategy by functionalizing the copper surface with a family of porphyrin-based metallic
complexes that catalyse CO2 to CO. Using density functional theory calculations, and in situ Raman and operando X-ray absorp-
tion spectroscopies, we find that the high concentration of local CO facilitates carbon–carbon coupling and steers the reaction
pathway towards ethanol. We report a CO2-to-ethanol Faradaic efficiency of 41% and a partial current density of 124 mA cm−2
at −0.82 V versus the reversible hydrogen electrode. We integrate the catalyst into a membrane electrode assembly-based
system and achieve an overall energy efficiency of 13%.
T
he renewable-electricity-powered CO2 reduction reaction take the other steps away from their optima21,22. We sought therefore
(CO2RR) offers a means to store intermittent electricity as to add a further degree of freedom in catalyst design that would
dispatchable fuels and valuable chemical feedstocks1,2. Among influence predominantly one step. Specifically, we strove to increase
the various products (CO, formic acid, methane, ethylene, ethanol the reaction rate of one step without strongly modulating the oth-
and 1-proponal) formed from CO2RR, ethanol (a liquid fuel or ers, by judiciously increasing the coverage of one key intermedi-
fuel additive) is desired because it is energy dense by volume and ate, yet not interfering with the electronic structure (hence binding
because it levers extensive existing infrastructure for the storage strength) of Cu, with the goal of circumventing the scaling relations.
and distribution of carbon-based fuels3,4. However, electrochemical Cu-based bimetallic catalysts have been reported to generate, on
CO2-to-ethanol conversion relies on multiple proton and electron the doping metal sites, high-concentration CO, a key intermediate
transfers that involve multiple intermediates5–7, making the devel- along C2+ pathways23–25, to spill over to the Cu sites for improved
opment of more efficient electrocatalysts an important but also carbon–carbon (C–C) coupling and further reduction to C2+ prod-
challenging problem. ucts20,26,27. However, the ratio of the heteroatom (Au, Ag, Zn) to Cu
Cu-based heterogeneous materials are distinctive among metal on the catalyst surface is low (for example, 20% and beyond. nol. We implement this concept experimentally by functionalizing
Scaling relations account for the fact that binding strengths of a family of porphyrin-based metallic complexes capable of catalys-
different intermediates on the same site (that is Cu) are correlated, ing CO2RR to CO on the Cu surface. The near-unity coverage of
which means that optimizing for one adsorbed species will typically the complexes maximizes the local concentration of CO for the
1
Department of Electrical and Computer Engineering, University of Toronto, Toronto, Ontario, Canada. 2Department of Mechanical and Industrial
Engineering, University of Toronto, Toronto, Ontario, Canada. 3These authors contributed equally: Fengwang Li, Yuguang C. Li, Ziyun Wang.
*e-mail: ted.sargent@utoronto.ca
Nature Catalysis | VOL 3 | January 2020 | 75–82 | www.nature.com/natcatal 75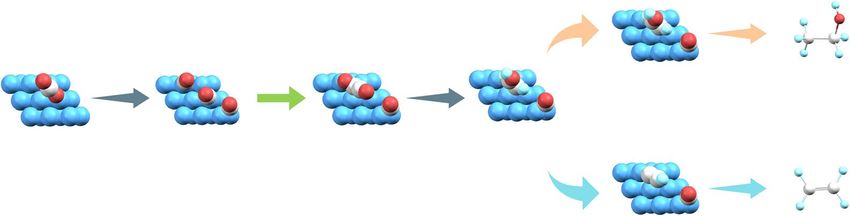
Articles                                                                                                                                   Nature Catalysis

                a

                                                                                                                       *CHCHOH                C2H5OH

                                                        C–C coupling
                                  CO2 on Cu      *CO                   *OCCO                        *CHCOH

                                                                                                                          *CCH                  C2H4

                b                 0.0                                            c

                                                                                                  0.0

                                 –0.2
               ∆Ereaction (eV)

                                                                               ∆Ereaction (eV)
                                                                                                 –0.2
                                 –0.4

                                 –0.6                                                            –0.4
                                          1/9   2/9        3/9          4/9                                1/9          2/9          3/9         4/9
                                                 *CO coverage                                                            *CO coverage

Fig. 1 | DFT calculations. a, Key reaction pathways for CO2RR to ethanol and ethylene illustrated using two *CO for C–C coupling at the presence of one
additional *CO. Blue, copper; grey, carbon; red, oxygen; light blue, hydrogen. b, Reaction energies (ΔEreaction) of two *CO forming a *OCCO via the C–C
coupling step. The *CO coverage indicates the surface ratio of additional *CO on a 3 × 3 Cu(111) surface. c, Reaction energies of *CHCOH to *CHCHOH
(orange) or *CCH (cyan) at different *CO coverage on a 3 × 3 Cu(111) surface.

ensuing reduction to ethanol on Cu sites. As a result of this strategy,             the formation of *CHCHOH (ethanol path) compared with that of
we report CO2-to-ethanol conversion with an FE of 41% at a partial                  *CCH (ethylene path). These reaction energies differentiated fur-
current density of 124 mA cm–2. We build a full-cell system, demon-                 ther with higher *CO coverage (Fig. 1c), indicating that high *CO
strating the electrosynthesis of ethanol via CO2 reduction coupled                  coverage steers selectivity from ethylene to ethanol.
to the water oxidation reaction, with a full-cell energy efficiency                     We found that the coverage of *CO also tuned the energy pro-
(EE) of 13%.                                                                        files of reaction intermediates on the Cu(100) surface, though
                                                                                    the changes were not as marked as those on the Cu(111) surface
Results                                                                             (Supplementary Figs. 5–7). Noting that Cu(111) is typically the
DFT calculations. We applied DFT calculations to predict the effect                 dominant facet of polycrystalline Cu substrates (an approach com-
of local CO on the C–C coupling step. We first ascertained which                    monly employed in the study of Cu-based catalysts) we based our
type of CO (surface bound versus unbound) accounts for this effect                  calculations on Cu(111).
on a Cu(111) surface (3 × 3 unit cell), a facet suggested by micro
kinetics studies30,31 to have low *CO coverages during electrocata-                 CO2RR performance. We pursued the intermediate-enrichment
lytic turnovers, offering us greater freedom to tune the coverage.                  strategy experimentally by introducing a molecular catalyst on the
We found that the presence of unbound CO did not affect the reac-                   surface of Cu (Fig. 2a), one that we posited would increase local
tion energy of the coupling of two adsorbed *CO on the Cu surface                   CO concentration via its own electrocatalytic turnovers. Molecular
(Supplementary Note 1 and Supplementary Figs. 1 and 2). Instead,                    catalysts have achieved near-unity FE for CO, commonly in non-
the concentration of the unbound CO tuned the coverage of *CO on                    aqueous solutions34,35. Their immobilization on conductive carbon
the Cu surface via the Langmuir isotherm model and then changed                     substrates or covalent organic frameworks has enabled the trans-
the reaction energy of the C–C coupling step (Supplementary Note 1).                lation of water-insoluble molecular catalysts to operate instead in
We then introduced various additional *CO coverage onto the                         aqueous solutions and has enabled marked increases in the turnover
Cu(111) surface with two *CO already adsorbed and compared the                      frequency for CO production36–38. The use of molecular complexes is
reaction energy of the C–C coupling step (Fig. 1a and Supplementary                 expected to create CO-rich interfaces via conformal contact with Cu
Fig. 3). The reaction energy was lowered when additional *CO was                    surfaces, without affecting the CO2-to-C2+-active electronics of Cu.
introduced, and the reduction in energy increased with further                          We used 5,10,15,20-tetraphenyl-21H,23H-porphine iron(iii)
increase in *CO coverage with a coverage of 3/9 showing the largest                 chloride (FeTPP[Cl], Fig. 2b), which exhibits a high FE for CO
margin (Fig. 1b): the adsorbate–adsorbate interaction became more                   at low overpotentials in both homogeneous and immobilized
marked with the increase in surface coverage32.                                     forms35,39, as the molecular complex. We first examined CO2-to-CO
    We further calculated reaction energies associated with the                     conversion of FeTPP[Cl] immobilized on carbon substrates via the
hydrogenation of the intermediate *CHCOH towards either                             π–π interaction37, studying it in a flow cell (Supplementary Fig. 8)
*CHCHOH or *CCH (Fig. 1a and Supplementary Fig. 4), a step                          with a gas diffusion electrode (GDE) and employing 1 M aqueous
found by Goddard and co-workers25,33 critical to controlling the                    KHCO3 as the electrolyte (used throughout this study). The immo-
differential production of ethanol versus ethylene. We found that                   bilized FeTPP[Cl] showed a clear increase of the reductive current
in the presence of *CO, the reaction energy decreased more for                      under CO2 atmosphere compared with N2 atmosphere (linear

76                                                                                                 Nature Catalysis | VOL 3 | January 2020 | 75–82 | www.nature.com/natcatal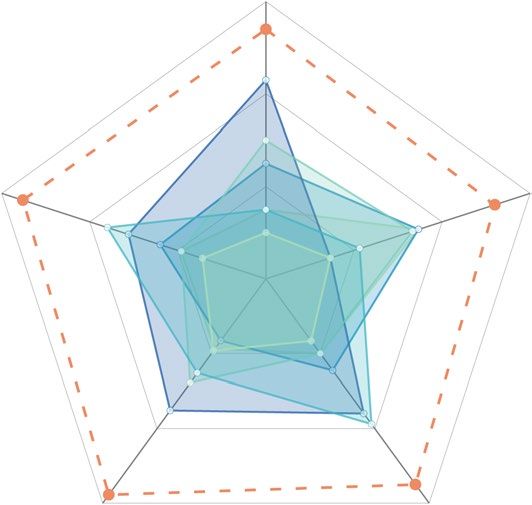
Nature Catalysis                                                                                                                                  Articles
           a

           b             R               c                                                               d
                                                       0
                                                                                                                  100                                    CO
                                                                                                                                                         H2
                     N        N
                                                                                                                  80
           R             Fe   Cl   R                  –10
                                        j (mA cm–2)

                   N          N

                                                                                                         FE (%)
                                                                                                                  60

                                                                                                                  40
                         R                            –20
                                                                                             N2
                                                                                                                  20
                R=                                                                           CO2

                                                      –30                                                          0
                                                            –0.8   –0.6    –0.4       –0.2         0.0                  –0.4     –0.6             –0.8
                                                                   E (V versus RHE)                                            E (V versus RHE)

Fig. 2 | Cooperative strategy for CO2-to-ethanol conversion. a, Schematic illustration of the heterogenization of molecular complexes on the Cu
surface. The locally generated high-concentration CO favours the ethanol pathway over the ethylene pathway on the bare Cu surface. b, Molecular
structure of the FeTPP[Cl] complex. c, Linear sweep voltammetry curves of FeTPP[Cl] immobilized on GDE under N2 or CO2 atmosphere, where j is total
current density normalized by geometric area, and E is applied potential. d, FE of CO and H2 of the FeTPP[Cl] catalyst immobilized on GDE under CO2
atmosphere. The experiments were carried out in a GDE-based flow cell using 1 M KHCO3 as an electrolyte. The error bars represent 1 s.d. on the basis of
three independent samples.

sweep voltammetry curves, Fig. 2c), indicating a catalytic response                        We evaluated the CO2RR performance of the FeTPP[Cl]/Cu cata-
towards CO2RR. To evaluate quantitively the CO2RR ability of the                       lyst in the electrochemical flow cell system10. The catalyst showed an
FeTPP[Cl], we analysed the products using gas chromatography. We                       onset potential for ethanol at −0.42 V, at which potential we started
found that the FE of CO was above 60% over a wide potential range                      to identify ethanol with the aid of 1H nuclear magnetic resonance
with an onset potential (defined as the most positive potential at                     (NMR) spectroscopy (Supplementary Fig. 13). In comparison, etha-
which CO product is identified by gas chromatography) of −0.41 V                       nol was detected in the case of the bare Cu electrode only when the
versus the reversible hydrogen electrode (RHE; all potentials were                     applied potentials were more negative than −0.50 V (Fig. 3a). The
with respect to this reference; Fig. 2d), which matched the applied                    selectivity of C2+ products, including ethanol, increased when the
potentials typical for CO2RR on Cu, thus promising sufficient CO                       applied potentials became more negative, a finding we attributed
supply for the ensuing C–C coupling step.                                              to the increased electrochemical driving force30,41. The ethanol FE
   We then immobilized the FeTPP[Cl] on a Cu electrode sputtered                       for the FeTPP[Cl]/Cu catalyst was higher than that for the bare Cu
on a hydrophobic porous polytetrafluoroethylene (PTFE) substrate                       electrode across the entire applied potential range and achieved a
(Supplementary Fig. 9)10. The surface-functionalized FeTPP[Cl]/Cu                      peak value of 41% at −0.82 V (Fig. 3a). In contrast, the peak ethanol
assembly was sufficiently stable to carry out electrochemical studies                  FE for the bare Cu reached only 29% at a more negative potential
over extended operating times under reductive applied potentials,                      of −0.84 V. We confirmed, using labelled 13CO2, that the carbon
a feature we attribute to the insoluble and hydrophobic nature40 of                    source of ethanol was CO2 (Supplementary Fig. 14). The lower
the FeTPP[Cl] molecule. The hydrophobic nature of the FeTPP[Cl]                        onset potential and higher FE resulted in higher ethanol current
permitted the use of air brushing to tune its loading amount on                        densities for the FeTPP[Cl]/Cu catalyst compared with those for
Cu. The calculated binding of CO to the FeTPP[Cl] was weaker                           pure Cu; indeed, greater than 100 mA cm−2 was achieved (Fig. 3b).
compared with that to the Cu(111) substrate by a margin of 0.2 eV                      We ascribed this increase in reaction rate to the enhanced CO2-
(Supplementary Fig. 10), suggesting that the locally produced CO                       to-ethanol kinetics, in addition to much more abundant CO2/elec-
on the FeTPP[Cl] sites was readily spilled over onto the CO2-to-C2+                    trolyte/catalyst three-phase interfaces in the GDEs compared with
active Cu sites. The modification of the FeTPP[Cl] molecular layer                     traditional H cells42.
did not block reactants from reaching the Cu surface, which we                             The low overpotentials and high ethanol FE resulted in high
confirmed using Raman spectroscopy and using water as the probe                        efficiency for ethanol production. The maximum half-cell CEE
molecule (Supplementary Fig. 11). The morphology of Cu did not                         (see Methods for calculation details) for the FeTPP[Cl]/Cu cata-
change, nor did we find the aggregation of FeTPP[Cl] to particles,                     lyst was 23% (Fig. 3c), 1.4-fold higher than that for pure Cu under
when we investigated the materials using scanning electron micros-                     similar conditions (16%) and 1.5-fold higher than the value previ-
copy, transmission electron microscopy and energy-dispersive                           ously published for the case of neutral electrolyte20. The FeTPP[Cl]/
X-ray elemental mapping (Supplementary Fig. 12).                                       Cu catalyst outperformed the reported catalysts in onset potential,

Nature Catalysis | VOL 3 | January 2020 | 75–82 | www.nature.com/natcatal                                                                                     77
Articles Nature Catalysis
a b
FeTPP[Cl]/Cu FeTPP[Cl]/Cu
150
Cu Cu
40
jethanol (mA cm–2)
FEethanol (%)
100
20
50
0
0
–0.4 –0.5 –0.6 –0.7 –0.8 –0.9 –0.4 –0.5 –0.6 –0.7 –0.8 –0.9
E (V versus RHE) E (V versus RHE)
c 25 d –0.4 Onset potential
FeTPP[Cl]/Cu
Cu
20 –0.6
CEEethanol
CEEethanol (%)
15 –0.8 0.9 η
1.0
20 1.1
1.2
10 10
This work
5 Ref.17
10 15
Ref.20
Ref.19
0 Ref.11 30
100
–0.4 –0.5 –0.6 –0.7 –0.8 –0.9 Ref.15
Ref.18 jethanol 45 FEethanol
E (V versus RHE)
e
0.8 40
FEethanol (%)
i (A)
0.4 20
0.0 0
0 3 6 9 12
Time (h)
Fig. 3 | CO2-to-ethanol conversion performance. a–c, Ethanol FE (a), partial current density (b) and half-cell CEE (c) over applied potentials of the
FeTPP[Cl]/Cu and Cu catalysts. jethanol is the ethanol partial current density normalized by geometric area. The error bars represent 1 s.d. on the basis of
three independent samples. The experiments were carried out in a GDE-based flow cell using 1 M KHCO3 as the electrolyte. d, Comparison of the onset
potential, overpotential (η), FE, ethanol partial current density and half-cell CEE of the FeTPP[Cl]/Cu catalyst with those of state-of-the-art Cu-based
catalysts. Only reports with a total current density >10 mA cm−2 were compared. e, Extended electrosynthesis of ethanol using the FeTPP[Cl]/Cu catalyst
in a MEA system using 0.1 M KHCO3 as the anolyte. i, total current. The full-cell voltage was gradually increased from 3 V to 3.7 V and kept constant over
the course of electrolysis.
overpotential, FE, partial current density and half-cell CEE (Fig. 3d We observed a decrease of ethanol selectivity after the initial 12 h
and Supplementary Table 1). The CO2-to-ethanol activity normal- (Supplementary Fig. 16), which we attributed to the mass loss of the
ized to the electrochemical surface area was also one order of mag- FeTPP[Cl] molecules on the Cu substrate (Supplementary Note 2
nitude higher than that in previous reports (Supplementary Table 1), and Supplementary Figs. 17 and 18). Nevertheless, we observed no
in part benefitting from the flow cell we used herein. The use of structural damage of the FeTPP[Cl] molecules (such as decompo-
neutral electrolyte circumvented the carbonate formation issue sition to nanoparticles) following electrolysis when we studied the
encountered in CO2RR electrolysers using alkaline electrolytes42. catalyst using ultraviolet-visible absorption and X-ray absorption
We further integrated the CO2 reduction and H2O oxidation spectroscopies (Supplementary Fig. 18).
reactions in a system employing a membrane electrode assembly
(MEA; Supplementary Fig. 15) to carry out the full electrosynthesis Mechanistic investigations. To investigate the origins of the
of ethanol from CO2 and water via the reaction: improved ethanol selectivity of FeTPP[Cl]/Cu, we reported the
combined FE of major C2 products (ethanol and ethylene) against
2CO2 þ 3H2 O ! C2 H5 OH þ 3O2 Eo ¼ 1:14 ð1Þ applied potential (Fig. 4a). We found that the combined C2 FE for
the FeTPP[Cl]/Cu catalyst was higher than that for the pure Cu elec-
We operated the system for an initial 12 h at a full-cell voltage of trode. Further analysis of the product distribution (Supplementary
3.7 V. The system delivered a stable current of 0.6 A and an average Fig. 19) indicated that the C2 selectivity increased mainly at the
ethanol FE of 41% (Fig. 3e). Thus, we obtained a full-cell EE (see expense of CO. We further compared the ratio of ethanol FE to
Methods for calculation details) of 13%. This value is reported with- ethylene FE. We found that, across the entire applied potential
out the benefit of ohmic resistance (iR) corrections. range, the FeTPP[Cl]/Cu electrode favoured ethanol over ethylene
78 Nature Catalysis | VOL 3 | January 2020 | 75–82 | www.nature.com/natcatalNature Catalysis Articles
a 2.5 b 50 e
80 FeTPP[Cl]/Cu
Cu
2.0 40
Ratio (ethanol:ethylene)
FEethanol + ethylene (%)
60
Intensity (a.u.)
FEethanol (%)
30
40 1.5
Fe reference
20
20 1.0 Fe2O3 reference
Dry sample
10 –0.52 V
0 –0.61 V
0.5
–0.82 V
0
–0.4 –0.5 –0.6 –0.7 –0.8 –0.9 7,100 7,120 7,140 7,160
P
l]
l]
l]
PP
[C
C
C
TP
e[
F[
oT
P
E (V versus RHE) Photon energy (eV)
M
P
TP
C
TP
PO
Fe
Fe
TP
Fe
c d f
Cu–CO C O Fe–CO
Fe ref.
–0.57 V ×0.2
–0.51 V –0.82 V
Intensity (a.u.)
FT [k 3χ(k)]
–0.48 V
–0.61 V
–0.45 V
–0.43 V
–0.52 V
–0.41 V
–0.39 V CuOx
CuOx
Dry sample
OCP
200 400 600 1,800 2,000 2,200 200 400 600 1,800 2,000 2,200 0 2 4 6
Raman shift (cm–1) Raman shift (cm–1) Radial distance (Å)
Fig. 4 | Mechanistic investigations of the FeTPP[Cl]/Cu catalyst for CO2-to-ethanol conversion. a, FE of major C2 products (ethanol and ethylene) and ratio
of ethanol to ethylene for the FeTPP[Cl]/Cu and Cu catalysts at different applied potentials. The error bars represent 1 s.d. on the basis of three independent
samples. b, Ethanol FE of the Cu electrode modified by different molecules. FeTPPF[Cl], 5,10,15,20-tetrakis(pentafluorophenyl)-21H,23H-porphyrin iron(iii)
chloride; FeTPPOMe[Cl], 5,10,15,20-tetrakis(4-methoxyphenyl)-21H,23H-porphine iron(iii) chloride; CoTPP, 5,10,15,20-tetraphenyl-21H,23H-porphine
cobalt(ii). The error bars represent 1 s.d. on the basis of three independent samples. c,d, In situ Raman spectra of the Cu (c) and FeTPP[Cl]/Cu (d) catalysts
under different applied potentials. OCP, open-circuit potential. a.u., arbitrary units. e,f, Operando Fe K-edge XANES (e) and EXAFS (f) spectra of the
FeTPP[Cl]/Cu catalyst under different applied potentials.
(Fig. 4a); the ratio of ethanol to ethylene increased from approxi- FeTPP[Cl] on the Cu and reached the maximum values when the
mately 0.5 for pure Cu to approximately 1 for the FeTPP[Cl]/Cu. coverage was near 1. This trend suggested that the locally concen-
The ratio was also larger than the values previously reported for trated CO provided by the FeTPP[Cl] enhanced the ethanol selec-
Cu catalysts (Supplementary Table 1). These results were consistent tivity in CO2RR. A further increase of the FeTPP[Cl] coverage led
with DFT calculations, in which high CO coverage favoured the to decreased ethanol selectivity, which we accounted for by noting
ethanol pathway over the ethylene pathway. that too few Cu sites were available for C–C coupling, in agree-
To explore whether the local high-concentration CO directly ment with the observed increased CO FE. We highlighted that the
contributed to the enhanced ethanol selectivity, we modified the additional layer of molecular catalyst on Cu allowed the ratio of
Cu electrode with the molecule Ni-tetraphenylporphyrin (TPP; *CO-producing sites to C–C coupling sites to approach unity. In
NiTPP), whose CO2-to-CO conversion onset potential was more contrast, the heteroatom doping strategy was limited to an analo-
negative than that of the FeTPP[Cl] molecule (Supplementary gous ratio of approximate 0.02 in the Au/Cu bimetallic catalyst27.
Fig. 20). We found that only after the NiTPP started to generate CO We noted also that the *CO-enrichment strategy was expected to
did the ethanol FE show marked improvement on the NiTPP/Cu substantially leave the electronic properties of Cu unchanged, in
catalyst (Supplementary Fig. 20). This agrees with the view that contrast with the elemental alloying approach29.
improved ethanol selectivity arises from local CO enrichment. We carried out control studies to examine whether ethanol
We further investigated the role of the FeTPP[Cl] molecule selectivity was influenced by the porphyrin framework itself.
by varying its loading on the Cu substrate. We found that both Using in situ Raman spectroscopy, we found that the TPP frame-
the combined C2 FE and the ratio of ethanol to ethylene gradu- work did not tune the binding properties of the Cu substrate to CO
ally increased against the surface coverage (see quantification (Supplementary Fig. 22). We found no enhancement of ethanol
details in Supplementary Note 3 and Supplementary Fig. 21) of the selectivity for the TPP/Cu electrode (Fig. 4b). These observations
Nature Catalysis | VOL 3 | January 2020 | 75–82 | www.nature.com/natcatal 79Articles Nature Catalysis
agreed with the main role for the FeTPP[Cl] complex as a CO2- supported by its reversibility following electrolysis; the oxidation
to-CO conversion enhancer. This view was further supported by state of Fe recovered to the same value as that before the reaction
the fact that a family of CO2-to-CO catalytically active porphyrin- and there was no Fe–Fe bond formation, findings we obtained
based complexes with different ligand structures and cobalt centres examining the post-electrolysis catalyst using XAS (Supplementary
also showed enhanced performance for CO2-to-ethanol (Fig. 4b and Fig. 18). With the aid of both Cu K-edge XANES and EXAFS spec-
Supplementary Fig. 23). The range of molecular enhancers demon- troscopies, we confirmed that Cu remained in the metallic state and
strated here showcases the wider applicability of the homogeneous– that the porphyrin did not coordinate with Cu under catalytically
heterogeneous cooperative strategy in reprogramming CO2RR. active conditions (Supplementary Fig. 27).
Taking these experimental findings together with the DFT cal-
culations, we conclude that the functional complexes in this study Conclusions
generate a CO-rich environment at the molecule–metal interface, In summary, we present an intermediate-enrichment-enhanced
increasing the coverage of *CO on the Cu surface. This lowers the electrocatalytic CO2-to-ethanol conversion strategy by coopera-
barrier to C–C coupling and steers selectivity towards ethanol, tive catalysis at the molecule–metallic interface. Using this strat-
resulting in increased control over CO2RR. egy, implemented using a family of porphyrin-based metallic
To gain molecular-level insight into the cooperative role of complexes on a Cu catalyst, we reported a CO2-to-ethanol con-
the heterogenized FeTPP[Cl] and Cu substrate, we interrogated version with an ethanol FE of 41% at a partial current density of
the FeTPP[Cl]/Cu surface using in situ Raman spectroscopy 124 mA cm–2 in neutral media. We achieved a full-cell EE of 13%
(Supplementary Fig. 24). We acquired Raman spectra on both Cu for the electrosynthesis of ethanol from CO2 and water. The find-
and FeTPP[Cl]/Cu electrodes at a range of applied potentials from ings suggest a wider strategy for improving CO2 conversion into
the open-circuit potential to −0.57 V (Fig. 4c, d). Under negative value-added liquid fuels using renewable electricity with the aid
applied potentials, the peaks associated with surface copper oxide of cooperative effects between adsorbed molecular and heteroge-
(CuOx) disappeared, a finding we attributed to the reduction of the neous approaches.
oxide to metallic Cu.
On bare Cu electrodes, three bands were identified associated Methods
with surface-adsorbed *CO at 280, 365 and the range of 1,900– DFT calculations. All the DFT calculations in this work were carried out
2,130 cm–1 (Fig. 4c). These bands emerged at −0.45 V and corre- with a periodic slab model using the Vienna ab initio simulation program51–54.
The generalized gradient approximation was used with the Perdew–Burke–
sponded to the Cu–CO frustrated rotation, the Cu–CO stretch and Ernzerhof55 exchange-correlation functional. The projector-augmented wave
the C≡O stretch, respectively43,44. On the FeTPP[Cl]/Cu catalyst, method56,57 was utilized to describe the electron–ion interactions and the cut-off
the same bands emerged at an earlier onset potential of −0.41 V energy for the plane–wave basis set was 450 eV. To illustrate the long-range
(Fig. 4d); this was consistent with the notion that CO concentration dispersion interactions between the adsorbates and catalysts, we employed the D3
correction method as described by Grimme et al.58. Brillouin zone integration was
was enhanced on the FeTPP[Cl]/Cu electrode. We also observed
accomplished using a 3 × 3 × 1 Monkhorst–Pack k-point mesh. All the adsorption
an emerging band at 535 cm–1, which we attributed to the Fe–CO geometries were optimized using a force-based conjugate gradient algorithm.
bending vibration owing to the interaction between CO and Fe in For the modelling of Cu(111) and Cu(100), the crystal structure was optimized;
the iron porphyrin segment45–47. This finding supports the view that Cu(111) and Cu(100) were modelled with a periodic four-layer p(3 × 3) model with
immobilized FeTPP[Cl] produced CO, which was then converted the two lower layers fixed and the two upper layers relaxed. FeTPP[Cl]/Cu(111)
was modelled with a periodic three-layer p(9 × 9) model with the one lower layer
to C2+ products on a nearby Cu site, as evidenced by the Cu–CO fixed and two upper layers relaxed. The atomic coordinates of the optimized
feature and by the fact that the FE of CO on FeTPP[Cl]/Cu did not models are provided in Supplementary Data 1.
increase compared with that on bare Cu at similar applied poten-
tials. This view agreed with the picture of cooperative electrocata- Electrode preparation. All chemicals were purchased from Sigma Aldrich and
lytic CO2-to-ethanol conversion by the heterogenized FeTPP[Cl] were used without further purification. The PTFE electrode was prepared by
sputtering 200 nm Cu onto a piece of PTFE membrane (pore size of 450 nm, with
on the Cu substrate in Fig. 2a. We confirmed, carrying out Ar and a polypropylene support on the backside) using a pure Cu target (99.99%) at a
13
CO2 controls (Supplementary Fig. 25), that the Raman peaks cor- sputtering rate of 0.67 Å s–1. The porphyrin-based complexes were dissolved in a
responding to Cu–CO and Fe–CO as discussed above were indeed mixture of tetrahydrofuran and acetonitrile (6:4 by volume) at a concentration of
from CO2RR. The band at 535 cm–1 was ruled out as being from 0.1 mM. The complexes were then spray-coated on either GDE (Sigracet, Fuel Cell
CuOx using X-ray absorption spectroscopy (XAS; vide infra). Store) or the PTFE electrode. The nominal concentration was estimated on the
basis of the concentration of solution used for the spray coat and the true loading
We investigated further the chemical structure and coordinat- concentration was quantified by inductively coupled plasma mass spectrometry
ing environment of FeTPP[Cl] under operating conditions using (ICP–MS; Supplementary Fig. 21). The optimized loading of the FeTPP[Cl]
XAS. The Fe K-edge X-ray absorption near edge structure (XANES) molecules for the GDE was approximately fivefold higher than that for the Cu/
spectra of the FeTPP[Cl]/Cu showed that the central Fe ions of the PTFE electrode owing to the larger surface area of the GDE.
FeTPP[Cl] molecules were slightly reduced under catalytic turn-
CO2RR and product analysis. Most CO2RR measurements were conducted in
over conditions (Fig. 4e). Using linear combination fitting, we an electrochemical flow cell setup (details in Supplementary Fig. 8). The applied
calculated the average oxidation state of Fe to be ~1.7– 1.8 under potentials were converted to the RHE scale with iR correction through the
operating conditions (Supplementary Fig. 26), consistent with the following equation:
reported mechanism for the electrochemical CO2-to-CO conver-
ERHE ¼ Eversus Ag=AgCl þ 0:059 ´ pH þ 0:210 þ iR ð2Þ
sion by FeTPP[Cl], where the porphyrin-coordinated Fe2+, Fe1+ and
Fe0 were supposed to be intermediate species48,49. We also observed where i is the current at each applied potential and R is the equivalent series
a higher pre-edge feature compared with that for the dry sample, resistance measured via electrochemical impedance spectroscopy in the frequency
a finding suggesting a more distorted structure by coordination of range of 105–0.1 Hz with an amplitude of 10 mV.
The MEA (see details in Supplementary Fig. 15) system was used to carry out
the metal centre with CO2RR intermediates50. We examined the Fe the full electrosynthesis of ethanol. The full-cell voltage was gradually increased
K-edge extended X-ray absorption fine structure (EXAFS) spec- from 3 V to 3.7 V and kept constant over the course of electrolysis.
tra of the FeTPP[Cl]/Cu catalyst. Over the applied potential range The gaseous products were analysed by gas chromatography (PerkinElmer
relevant to CO2RR, we identified only the Fe–N bond, whereas the Clarus 600), equipped with a thermal conductivity detector and a flame ionization
Fe–Fe bond was not observed (Fig. 4f). This finding suggests that detector. Liquid products were quantified by 1H NMR spectroscopy (600 MHz
Agilent DD2 NMR spectrometer) using dimethyl sulfoxide as the internal
FeTPP[Cl] maintained its original complex status instead of being standard. Isotopic experiments were carried out using 1 M KCl and 1 M KHCO3 as
reduced to iron nanoparticles or nanoclusters under operating catholyte and anolyte, respectively, to avoid the exchange of carbon between 13CO2
conditions. The stability of the FeTPP[Cl] molecule was further and H12CO3–.
80 Nature Catalysis | VOL 3 | January 2020 | 75–82 | www.nature.com/natcatalNature Catalysis Articles
EE was calculated on the basis of the cathodic CO2RR coupled with anodic 17. Zhou, Y. et al. Dopant-induced electron localization drives CO2 reduction to
water oxidation reaction (O2+4H+ + 4e– ↔ 2H2O; 1.23 V versus RHE). C2 hydrocarbons. Nat. Chem. 10, 974–980 (2018).
18. De Luna, P. et al. Catalyst electro-redeposition controls morphology and
Eoxo � Eredo
EE ¼ ´ FEethanol ð3Þ oxidation state for selective carbon dioxide reduction. Nat. Catal. 1,
Eox � Ered 103–110 (2018).
where Eoxo and Eredo are the thermodynamic potentials for water oxidation and 19. Liang, Z.-Q. et al. Copper-on-nitride enhances the stable electrosynthesis of
CO2RR Ito ethanolI (0.09 V versus RHE), respectively and Eox and Ered are the applied multi-carbon products from CO2. Nat. Commun. 9, 3828 (2018).
potentials at anode and cathode, respectively. For the calculation of the half-cell 20. Ren, D., Ang, B. S.-H. & Yeo, B. S. Tuning the selectivity of carbon dioxide
CEE, the anodic reaction was assumed to occur with an overpotential of 0 V (that is electroreduction toward ethanol on oxide-derived CuxZn catalysts. ACS Catal.
Eox = 1.23 V). For full-cell EE calculation, the equation then was simplified to 6, 8239–8247 (2016).
21. Vojvodic, A. & Nørskov, J. K. New design paradigm for heterogeneous
Eo catalysts. Natl Sci. Rev. 2, 140–143 (2015).
EEfull cell ¼ ´ FEethanol ð4Þ
Efull cell 22. Peterson, A. A. & Nørskov, J. K. Activity descriptors for CO2 electroreduction
where Efull cell is the applied voltage of the MEA system and Eo ¼ Eoxo � Eredo . to methane on transition-metal catalysts. J. Phys. Chem. Lett. 3, 251–258 (2012).
I 23. Calle-Vallejo, F. & Koper, M. T. Theoretical considerations on the
Materials characterization. Scanning electron microscopy was performed using a electroreduction of CO to C2 species on Cu(100) electrodes. Angew. Chem.
Hitachi S-5200. X-ray photoelectron spectroscopy measurements were carried out Int. Ed. 52, 7282–7285 (2013).
using a Thermo Scientific K-Alpha spectrophotometer with a monochromated Al 24. Montoya, J. H., Shi, C., Chan, K. & Nørskov, J. K. Theoretical insights into a
Kα X-ray radiation source. X-ray diffraction patterns were recorded on a Rigaku CO dimerization mechanism in CO2 electroreduction. J. Phys. Chem. Lett. 6,
MiniFlex600 G6. ICP–MS was measured on a Bruker Aurora M90. Hard XAS 2032–2037 (2015).
measurements were performed using a modified flow cell59 at the 9BM beamline 25. Xiao, H., Cheng, T. & Goddard, W. A. Atomistic mechanisms underlying
of the Advanced Photon Source located in the Argonne National Laboratory. XAS selectivities in C1 and C2 products from electrochemical reduction of CO on
data were processed with Demeter (v.0.9.26)60. In situ Raman measurements were Cu(111). J. Am. Chem. Soc. 139, 130–136 (2017).
carried out using a Renishaw inVia Raman microscope in a modified flow cell 26. Lee, S., Park, G. & Lee, J. Importance of Ag–Cu biphasic boundaries for
(Supplementary Fig. 24) with a water immersion objective. A 785-nm laser was used selective electrochemical reduction of CO2 to ethanol. ACS Catal. 7,
and signals were recorded using a 5-s integration and by averaging five scans. The gas 8594–8604 (2017).
(CO2, Ar and 13CO2) with a flow rate of 40 standard cm3 min−1 was flowed through the 27. Morales-Guio, C. G. et al. Improved CO2 reduction activity towards C2+
cell for corresponding experiments. An Ag/AgCl (3 M KCl) electrode and a Pt wire alcohols on a tandem gold on copper electrocatalyst. Nat. Catal. 1,
were used as the reference and counter electrodes, respectively, in all measurements. 764–771 (2018).
28. Ma, S. et al. Electroreduction of carbon dioxide to hydrocarbons using
bimetallic Cu–Pd catalysts with different mixing patterns. J. Am. Chem. Soc.
Data availability 139, 47–50 (2017).
The datasets generated during, and/or analysed during, the present study, are 29. Kim, D., Resasco, J., Yu, Y., Asiri, A. M. & Yang, P. Synergistic geometric and
available from the corresponding author on reasonable request. electronic effects for electrochemical reduction of carbon dioxide using
gold-copper bimetallic nanoparticles. Nat. Commun. 5, 4948 (2014).
Received: 26 April 2019; Accepted: 14 October 2019; 30. Liu, X. et al. pH effects on the electrochemical reduction of CO(2) towards C2
Published online: 16 December 2019 products on stepped copper. Nat. Commun. 10, 32 (2019).
31. Liu, X. et al. Understanding trends in electrochemical carbon dioxide
References reduction rates. Nat. Commun. 8, 15438 (2017).
1. Ross, M. B. et al. Designing materials for electrochemical carbon dioxide 32. Lausche, A. C. et al. On the effect of coverage-dependent adsorbate–adsorbate
recycling. Nat. Catal. 2, 648–658 (2019). interactions for CO methanation on transition metal surfaces. J. Catal. 307,
2. Birdja, Y. Y. et al. Advances and challenges in understanding the electrocatalytic 275–282 (2013).
conversion of carbon dioxide to fuels. Nat. Energy 4, 732–745 (2019). 33. Cheng, T., Xiao, H. & Goddard, W. A. Full atomistic reaction mechanism
3. Shih, C. F., Zhang, T., Li, J. & Bai, C. Powering the future with liquid with kinetics for CO reduction on Cu(100) from ab initio molecular
sunshine. Joule 2, 1925–1949 (2018). dynamics free-energy calculations at 298 K. Proc. Natl Acad. Sci. USA 114,
4. Spurgeon, J. & Kumar, B. A comparative technoeconomic analysis of 1795–1800 (2017).
pathways for commercial electrochemical CO2 reduction to liquid products. 34. Costentin, C., Drouet, S., Robert, M. & Savéant, J. M. A local proton source
Energy Environ. Sci. 11, 1536–1551 (2018). enhances CO2 electroreduction to CO by a molecular Fe catalyst. Science 338,
5. Hori, Y. in Modern Aspects of Electrochemistry Vol. 42 (eds Vayenas, C. G. 90–94 (2012).
et al.) 89–189 (Springer, 2008). 35. Costentin, C., Robert, M. & Savéant, J. M. Catalysis of the electrochemical
6. Gao, D., Arán-Ais, R. M., Jeon, H. S. & Roldan Cuenya, B. Rational catalyst reduction of carbon dioxide. Chem. Soc. Rev. 42, 2423–2436 (2013).
and electrolyte design for CO2 electroreduction towards multicarbon 36. Lin, S. et al. Covalent organic frameworks comprising cobalt porphyrins for
products. Nat. Catal. 2, 198–210 (2019). catalytic CO2 reduction in water. Science 349, 1208–1213 (2015).
7. Kortlever, R., Shen, J., Schouten, K. J., Calle-Vallejo, F. & Koper, M. T. 37. Hu, X. M., Rønne, M. H., Pedersen, S. U., Skrydstrup, T. & Daasbjerg, K.
Catalysts and reaction pathways for the electrochemical reduction of carbon Enhanced catalytic activity of cobalt porphyrin in CO2 electroreduction
dioxide. J. Phys. Chem. Lett. 6, 4073–4082 (2015). upon immobilization on carbon materials. Angew. Chem. Int. Ed. 56,
8. Kuhl, K. P., Cave, E. R., Abram, D. N. & Jaramillo, T. F. New insights into the 6468–6472 (2017).
electrochemical reduction of carbon dioxide on metallic copper surfaces. 38. Zhang, X. et al. Highly selective and active CO2 reduction electrocatalysts
Energy Environ. Sci. 5, 7050–7059 (2012). based on cobalt phthalocyanine/carbon nanotube hybrid structures. Nat.
9. Ma, S. et al. One-step electrosynthesis of ethylene and ethanol from CO2 in Commun. 8, 14675 (2017).
an alkaline electrolyzer. J. Power Sources 301, 219–228 (2016). 39. Smith, P. T. et al. Iron porphyrins embedded into a supramolecular porous
10. Dinh, C.-T. et al. CO2 electroreduction to ethylene via hydroxide-mediated organic cage for electrochemical CO2 reduction in water. Angew. Chem. Int.
copper catalysis at an abrupt interface. Science 360, 783–787 (2018). Ed. 57, 9684–9688 (2018).
11. Jiang, K. et al. Metal ion cycling of Cu foil for selective C–C coupling in 40. Joya, K. S., Morlanés, N., Maloney, E., Rodionov, V. & Takanabe, K.
electrochemical CO2 reduction. Nat. Catal. 1, 111–119 (2018). Immobilization of a molecular cobalt electrocatalyst by hydrophobic
12. Clark, E. L., Hahn, C., Jaramillo, T. F. & Bell, A. T. Electrochemical CO2 interaction with a hematite photoanode for highly stable oxygen evolution.
reduction over compressively strained CuAg surface alloys with enhanced Chem. Commun. 51, 13481–13484 (2015).
multi-carbon oxygenate selectivity. J. Am. Chem. Soc. 139, 15848–15857 (2017). 41. Bertheussen, E. et al. Acetaldehyde as an intermediate in the electroreduction
13. Hoang, T. T. H. et al. Nano porous copper-silver alloys by additive-controlled of carbon monoxide to ethanol on oxide-derived copper. Angew. Chem. Int.
electro-deposition for the selective electroreduction of CO2 to ethylene and Ed. 55, 1450–1454 (2016).
ethanol. J. Am. Chem. Soc. 140, 5791–5797 (2018). 42. Weekes, D. M., Salvatore, D. A., Reyes, A., Huang, A. & Berlinguette, C. P.
14. Li, C. W., Ciston, J. & Kanan, M. W. Electroreduction of carbon monoxide Electrolytic CO2 reduction in a flow cell. Acc. Chem. Res. 51, 910–918 (2018).
to liquid fuel on oxide-derived nanocrystalline copper. Nature 508, 43. Sheppard, N. & Nguyen, T. T. Advances in Infrared and Raman Spectroscopy.
504–507 (2014). (Heyden, 1978).
15. Zhuang, T.-T. et al. Steering post-C–C coupling selectivity enables high 44. Gunathunge, C. M. et al. Spectroscopic observation of reversible surface
efficiency electroreduction of carbon dioxide to multi-carbon alcohols. Nat. reconstruction of copper electrodes under CO2 reduction. J. Phys. Chem. C.
Catal. 1, 421–428 (2018). 121, 12337–12344 (2017).
16. Jouny, M., Luc, W. W. & Jiao, F. General techno-economic analysis of CO2 45. Tsubaki, M., Srivastava, R. B. & Yu, N. T. Resonance Raman investigation of
electrolysis systems. Ind. Eng. Chem. Res. 57, 2165–2177 (2018). carbon monoxide bonding in (carbon monoxy)hemoglobin and -myoglobin:
Nature Catalysis | VOL 3 | January 2020 | 75–82 | www.nature.com/natcatal 81Articles Nature Catalysis
detection of iron–carbon monoxide stretching and iron–carbon–oxygen Acknowledgements
bending vibrations and influence of the quaternary structure change. The authors acknowledge funding support from Suncor Energy, the Ontario Research
Biochem. 21, 1132–1140 (1982). fund and the Natural Sciences and Engineering Research Council (NSERC). DFT
46. Kerr, E. A., Mackin, H. C. & Yu, N. T. Resonance Raman studies of carbon computations were performed on the IBM BlueGene/Q supercomputer with support
monoxide binding to iron “picket fence” porphyrin with unhindered and from the Niagara supercomputer at the SciNet HPC Consortium and the Southern
hindered axial bases. An inverse relationship between binding affinity and the Ontario Smart Computing Innovation Platform (SOSCIP). SciNet is funded by the
strength of iron–carbon bond. Biochem. 22, 4373–4379 (1983). Canada Foundation for Innovation, the Government of Ontario’s Ontario Research
47. Uno, T. et al. The resonance Raman frequencies of the Fe–CO stretching and Fund – Research Excellence, and the University of Toronto. SOSCIP is funded by the
bending modes in the CO complex of cytochrome P-450cam. J. Bio. Chem. Federal Economic Development Agency of Southern Ontario, the Province of Ontario,
260, 2023–2026 (1985). IBM Canada, Ontario Centres of Excellence, Mitacs and 15 Ontario academic member
48. Costentin, C., Drouet, S., Passard, G., Robert, M. & Savéant, J. M. Proton- institutions. This research used synchrotron resources of the Advanced Photon Source,
coupled electron transfer cleavage of heavy-atom bonds in electrocatalytic an Office of Science User Facility operated for the US Department of Energy Office of
processes. Cleavage of a C–O bond in the catalyzed electrochemical reduction Science by Argonne National Laboratory and was supported by the US Department of
of CO2. J. Am. Chem. Soc. 135, 9023–9031 (2013). Energy under contract no. DE-AC02-06CH11357 and the Canadian Light Source and
49. Costentin, C., Passard, G., Robert, M. & Savéant, J. M. Ultraefficient its funding partners. F.L. thanks H.T.L. for ICP–MS measurement. J.L. acknowledges
homogeneous catalyst for the CO2-to-CO electrochemical conversion. the Banting Postdoctoral Fellowships programme. C.G. acknowledges the NSERC
Proc. Natl Acad. Sci. USA 111, 14990–14994 (2014). Postdoctoral Fellowships programme. D.S. acknowledges the NSERC E.W.R. Steacie
50. Yang, H. B. et al. Atomically dispersed Ni(i) as the active site for Memorial Fellowship.
electrochemical CO2 reduction. Nat. Energy 3, 140–147 (2018).
51. Kresse, G. & Furthmüller, J. Efficient iterative schemes for ab initio
total-energy calculations using a plane-wave basis set. Phys. Rev. B 54, Author contributions
11169–11186 (1996). E.H.S. supervised the project. F.L. conceived the idea and carried out the experiments.
52. Kresse, G. & Furthmüller, J. Efficiency of ab-initio total energy calculations F.L. and E.H.S. wrote the paper. Y.C.L. and Z.W. carried out the DFT calculations.
for metals and semiconductors using a plane-wave basis set. Comput. Mater. D.H.N. and Y. Lum performed the XAS measurements. D.H.N., J.L. and S-F.H. helped
Sci. 6, 15–50 (1996). to analyse the XAS data. Y. Li and A.O. carried out part of electrochemical experiments.
53. Kresse, G. & Hafner, J. Ab initio molecular dynamics for liquid metals. Phys. M.L. and X.W. provided help in NMR analysis. B.C., Y.H.W., J.W., Y.X., C.-T.D., Y.W.
Rev. B 47, 558–561 (1993). and T.-T.Z. helped to characterize the materials. Y.C.L. and C.M.G. helped in the
54. Kresse, G. & Hafner, J. Ab initio molecular-dynamics simulation of the Raman measurements. D.S. assisted in data analysis and manuscript writing. All authors
liquid-metal–amorphous-semiconductor transition in germanium. Phys. Rev. discussed the results and assisted during manuscript preparation.
B 49, 14251–14269 (1994).
55. Perdew, J. P., Burke, K. & Ernzerhof, M. Generalized gradient approximation
made simple. Phys. Rev. Lett. 77, 3865–3868 (1996).
Competing interests
The authors declare no competing interests.
56. Kresse, G. & Joubert, D. From ultrasoft pseudopotentials to the projector
augmented-wave method. Phys. Rev. B 59, 1758–1775 (1999).
57. Blöchl, P. E. Projector augmented-wave method. Phys. Rev. B 50, Additional information
17953–17979 (1994). Supplementary information is available for this paper at https://doi.org/10.1038/
58. Grimme, S., Antony, J., Ehrlich, S. & Krieg, H. A consistent and accurate ab s41929-019-0383-7.
initio parametrization of density functional dispersion correction (DFT-D)
for the 94 elements H-Pu. J. Chem. Phys. 132, 154104 (2010). Correspondence and requests for materials should be addressed to E.H.S.
59. Li, J. et al. Copper adparticle enabled selective electrosynthesis of n-propanol. Reprints and permissions information is available at www.nature.com/reprints.
Nat. Commun. 9, 4614 (2018). Publisher’s note Springer Nature remains neutral with regard to jurisdictional claims in
60. Ravel, B. & Newville, M. ATHENA, ARTEMIS, HEPHAESTUS: data analysis published maps and institutional affiliations.
for X-ray absorption spectroscopy using IFEFFIT. J. Synchrotron Rad. 12,
537–541 (2005). © The Author(s), under exclusive licence to Springer Nature Limited 2019
82 Nature Catalysis | VOL 3 | January 2020 | 75–82 | www.nature.com/natcatalYou can also read


