Multi-scenario numerical modeling applied to groundwater contamination: the Popoli Gorges complex aquifer case study (Central Italy) - IAEG
←
→
Page content transcription
If your browser does not render page correctly, please read the page content below
DOI: 10.7343/as-2018-361 Paper
Multi-scenario numerical modeling applied to groundwater contamination:
the Popoli Gorges complex aquifer case study (Central Italy)
Modellazione numerica multi-scenario applicata alla contaminazione delle acque sotterrane:
il caso dell’acquifero complesso delle Gole di Popoli (Italia centrale)
Diego Di Curzio, Sergio Rusi, Ron Semeraro
Riassunto: In questo lavoro, è stato implementato un modello Abstract: In this research, a multi-scenario numerical modeling was
numerico multi-scenario per esplorare gli effetti della variazione implemented to assess the effects of changes to abstraction patterns in
del regime degli emungimenti di un acquifero, sia dal punto di the Sant’Angelo well-field (central Italy) and their implications on the
vista idrodinamico, che da quello del trasporto advettivo di con- aquifer hydrodynamic and the advective transport of contaminants.
taminanti. Alla fase di implementazione e calibrazione del mo- Once implemented and calibrated the steady-state numerical model by
dello in condizioni stazionarie utilizzando MODFLOW-2005, means of MODFLOW-2005, the well-field turning off scenario was
è seguita la fase di simulazione di diversi scenari di emungi- modelled. In addition, the numerical results were analyzed by means of
mento tra cui lo spegnimento del campo pozzi. I risultati sono the post-processors ZONEBUDGET and MODPATH, to assess respec-
stati analizzati attraverso i post processori ZONEBUDGET e tively the contribution of each hydrogeological feature to the total budget
MODPATH rispettivamente per valutare il ruolo di ciascuno and the advective transport of contaminant particles.
contributo idrico al bilancio totale e il trasporto advettivo del Comparing the two steady-state numerical models and the relative par-
contaminante. ticle tracking analyses, the well-field turning off, although no longer
Le simulazioni hanno evidenziato che allo spegnimento del cam- acting as a hydraulic barrier, increased the residence time of contami-
po pozzi, finendo l’effetto di barriera idraulica, si ha un aumento nant particles and limited their mobility in the aquifer. Furthermore,
del tempo di residenza dei contaminanti e una diminuzione della the general decrease in groundwater abstractions also caused a higher
mobilità nell’acquifero. Inoltre, la diminuzione dell’emungimen- increase in river flow, favoring contaminants’ dilution in surface water.
to causa anche un incremento della portata fluviale, a sua volta
responsabile della diluizione della contaminazione nelle acque
superficiali.
Introduction
Keywords: groundwater, numerical modeling, complex aquifer, advective The numerical modeling is widely applied to groundwater
transport, Popoli Gorges. management issue which span from assessment of
environmental sustainability from abstraction, pumping
Parole chiave: acque sotterranee, modellazione numerica, performance and groundwater storage and recharge (Ayvaz
acquifero complesso, trasporto advettivo, Gole di Popoli. and Karahan 2008; Shammas 2008; Rossetto et al. 2018;
Stefania et al. 2018).
Other applications of numerical modelling include the
validation of conceptual models for a given hydrogeological
context (Rojas et al. 2008; La Vigna et al. 2014; Caschetto
Diego DI CURZIO et al. 2016; Viaroli et al. 2018a), which improves the
Engineering and Geology Department understanding of the aquifer system.
University “G. d’Annunzio” of Chieti-Pescara, Pescara, Italy
diego.dicurzio@unich.it Numerical modelling of contaminant fate and transport
in groundwater is not of least importance (Greskowiak et
Sergio RUSI al. 2006; Mastrocicco et al. 2012; Refsgaard et al. 2012).
Ron SEMERARO
Engineering and Geology Department Such studies aim to study the evolution of groundwater
University “G. d’Annunzio” of Chieti-Pescara, Pescara, Italy contamination in the subsurface and support the planning
s.rusi@unich.it of remedial actions as well as assessing the success of such
ronsemeraro@gmail.com
interventions.
The transport of contaminants in aquifers is widely
covered in literature (Freeze and Cherry 1979; Beretta 1992;
Ricevuto/Received: 15 November 2018-Accettato/Accepted: 10 December 2018 Fetter 2000; Appelo and Postma 2005) and is connected to
Pubblicato online/Published online: 19 December 2018 several hydrodynamic and hydrogeochemical factors. Most
This is an open access article under the CC BY-NC-ND license: of the factors affecting the movement of contaminants in
http://creativecommons.org/licenses/by-nc-nd/4.0/
groundwater tend to slow the downstream movement of the
© Associazione Acque Sotterranee 2018 contaminant except for advection, which is directly related to
Acque Sotterranee - Italian Journal of Groundwater (2018) - AS27- 361: 49 - 58 49
DOI: 10.7343/as-2018-361

the aquifer velocity. Advective transport is clearly related to                                  Geologically, the area is characterized by a deeply incised
changes in the hydrodynamics of the aquifer which, in turn,                                   riverine valley, which has cut through the Morrone limestone
are influenced by changes in the abstraction patterns.                                        massif. The valley was subsequently filled with quaternary
  The main objective of this study is to assess the effects                                   heterogeneous continental deposits (Massoli-Novelli et al.
of changes to abstraction patterns, which occurred between                                    1998; Conese et al 2001; ISPRA 2006a, 2006b). The Morrone
2007 and 2008, to the advective transport of groundwater                                      massif is a limestone structure (Triassic-Miocene), mainly
contaminants within an aquifer contaminated with organo-                                      limestone or grain supported facies, that overlies more recent
chlorates. The validation of the hydrogeological conceptual                                   clayey-marly formations due to a NW-SE thrust (Conese et al.
model was also a critical objective of the study. A simplified                                2001; ISPRA 2006a, 2006b). Distensive tectonic structures
approach was adopted: two scenarios with different boundary                                   are also present with a NW-SE trend. These structures run
conditions (steady-state models) were compared. The                                           below the continental deposits in the PG and disarticulate
simplified approach provides important indications on the                                     the limestone massif.
contamination spread in the aquifer, mainly because the                                          The quaternary continental deposits have a thickness that
advective transport influences the downstream movement of                                     varies between 65-100 m. These lithologies are variable in
a contaminant. Therefore, considerations made in this study                                   nature, depending on the depositional environment (Di
can be extended to other cases of groundwater contamination.                                  Curzio et al. 2016; Vessia and Di Curzio 2018). Specifically,
                                                                                              coarse head deposits (i.e. breccias, locally cemented) have
Study area                                                                                    been identified. These are associated with the erosion of the
   The study area coincides with the Popoli Gorges (PG) at the                                limestone massifs in the area and lie on the limestone and
confluence between the Pescara River and the Tirino River                                     clayey-marly bedrock formations. Different travertine facies
(Central-Eastern Apennines; Fig. 1). There is a significant                                   are found lying over the head deposits. These vary from solid
anthropogenic influence in the area given its strategic location.                             concretions of travertine with cavities to travertine sands.
Critical traffic routes, a hydroelectric plant, a well field (i.e.                            In the western areas, the travertine deposits are incised and
the Sant’Angelo well field, SAWF) and a chemical industrial                                   infilled with silty-sandy lacustrine deposits and peat, which
site (i.e. the Bussi Officine site, BOS), now no longer active,                               are locally more clayey. Alluvial deposits are present with
are all located in the area. Industrial wastes from the latter                                discontinuity at the surface across the whole study area. Each
chemical industrial site were buried near the Pescara River                                   geological body present in PG represents a hydrogeological
and have now contaminated the groundwater in the area (Di                                     complex of the corresponding aquifer.
Molfetta & Fracassi 2008; Filippini et al. 2018). Due to this                                    Previous studies (Boni et al. 1986; Massoli-Novelli et
contamination, the well field (approximately 300 l/s; Rusi                                    al. 1998; Conese et al. 2001; Rusi, 2007; Petitta et al.
2007) was turned off in 2008 and the PG were declared a Site                                  2018) have identified that groundwater circulation occurs
of National Interest (SNI).                                                                   mainly in the continental deposits. The recharge to these

Fig. 1 - Schematic hydro-geological map of the Popoli Gorges. 1) continental deposits; 2) limestone; 3) industrial wastes dump; 4) main rivers; 5) increase in river flow; 6) geological
cross-sections shown in the text; 7) hydrogeological cross-sections; 8) piezometers; 9) wells of the SAWF; 10) wells of the hydraulic barriers in the SNI.
Fig. 1 - Carta idro-geologica schematica delle Gole di Popoli. 1) depositi continentali; 2) calcari e calcareniti; 3) Interramento di scarti industriali; 4) fiumi principali;
5) Incremento di portata in alveo; 6) tracce delle sezioni rappresentate nelle immagini del testo; 7) tracce delle sezioni idro-geologiche ricostruite; 8) piezometri; 9) pozzi
del SAWF; 10) pozzi delle barriere idrauliche nel SIN.

50                                                                                            Acque Sotterranee - Italian Journal of Groundwater (2018) - AS27- 361: 49 - 58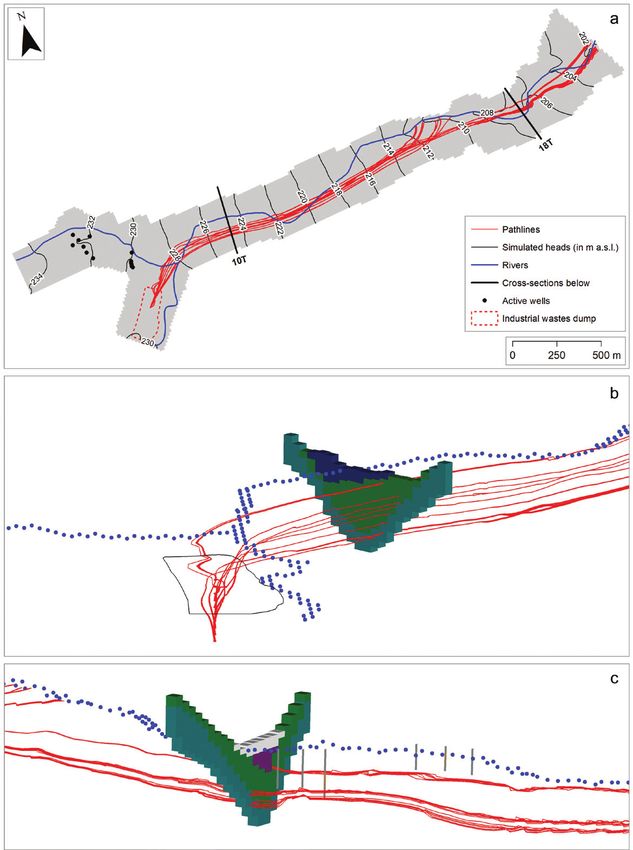
DOI: 10.7343/as-2018-361

continental deposits is primarily from the limestone massif                        The numerical model was developed utilizing the
and subsequently from rainfall recharge. Surface water-                          MODFLOW-2005 finite difference code (Harbaugh 2005),
groundwater interactions are known to occur between the                          and the Visual MODFLOW Flex 4.1 graphical user interface.
Pescara River and the aquifer (Chiaudani et al. 2017). In fact,                  The conceptual model was developed into a numerical model
strong flow increases are observed near SAWF (Fig. 1). This                      in different phases, as summarized in Fig. 2 for one of the 32
increase in flows has been estimated to be between 0.6 and                       hydrogeological sections.
1 m3/s (Boni et al. 1986; Massoli-Novelli et al. 1998; Conese
et al. 2001; Rusi 2007). Periodic monitoring of groundwater
levels in the area of confluence between Pescara River and
the Tirino River (Di Curzio et al. 2014) has identified that
changes in groundwater levels correlate with changes in river
levels, especially during high flow events.

Dataset
  The geometries of the geological bodies that constitute the
aquifer were identified through the detailed hydrogeological
characterization discussed in Di Curzio et al (2014). This
represents the starting point for implementing the numerical
model. 32 hydrogeological cross-sections (Fig. 1) were
developed utilizing available geological surveys (i.e. borehole                  Fig. 2 - Process used to move from the conceptual model to the numerical model: a) hydro-
                                                                                 geological cross-section 12T; b) the vectorization of the top of the geological formation; c)
logging) and geophysical surveys (i.e. geoelectrical surveys).                   model grid. Legend: 1) soil and/or artificial ground; 2) lacustrine deposits; 3) travertine
These were undertaken by Autostrade S.p.A. during the                            deposits; 4) head deposits; 5) limestone bedrock; 6) top of the soil/artificial ground; 7) top
construction of the Pescara-Roma motorway and by ACA                             of the lake deposits; 8) top of the travertine deposits; 9) top of the head deposits; 10) top
S.p.A. for the development of the SAWF. Surveys from                             of the bedrock; 11) Zone 2 (travertine deposits); 12) Zone 3 (head deposits); 13) Zone 4
                                                                                 (weathered limestone). Trace of the cross-section in Fig. 1.
ARTA (“Agenzia Regionale per la Tutela dell’Ambiente”;
the Regional Environmental Protection Agency) of                                 Fig. 2 - Conversione dal modello concettuale al modello numerico: a) sezione
                                                                                 idrogeologica 12T; b) superfici vettorializzate del top delle formazioni geologiche;
Abruzzo Region for groundwater monitoring, following the                         c) griglia del modello. Legenda: 1) suolo e/o riporto; 2) depositi lacustri; 3) depo-
identification of contamination, were also sourced. Survey                       siti travertinosi; 4) depositi detritici di versante; 5) substrato calcareo; 6) top del
results from all those companies that have had their activities                  suolo e/o riporto; 7) top dei depositi lacustri; 8) top dei depositi travertinosi; 9)
in the industrial area were also used for the development of                     top dei depositi detritici di versante; 10) top del substrato; 11) Zona 2 (depositi
                                                                                 travertinosi); 12) Zona 3 (depositi detritici di versante); 13) Zona 4 (calcari frattu-
the hydrogeological sections.                                                    rati e alterati). Traccia della sezione in Fig. 1.
  Groundwater level data used for model calibration purposes
were from the monitoring undertaken during the summer of                            The hydrogeological sections developed from Di Curzio et al
2007 (Rusi 2007; Di Molfetta and Fracassi 2008). Data from                       (2014) were first digitized in vectorial format, then imported
the “Popoli” rain gauge and the “Pescara at Maraone” hydro-                      and georeferenced within the MOVE Midland Valley software.
metric station, located just upstream of the study area, were                    Subsequently, the tops of the different geological formations
used to derive respectively the recharge data (model input)                      were digitized. Some geological bodies have limited thickness
and relationships for surface water-groundwater interaction.                     and lateral extension from a hydrogeological point of view
  Spring discharges available from literature (Boni et al. 1986;                 (e.g. soil). These were included in larger hydrogeological
Massoli-Novelli et al. 1998; Conese et al. 2001) were used for                   bodies with similar hydrogeological properties. To digitalize
the water balance outputs. Abstraction data from the SAWF                        the top of the geological bodies, Inverse Distance Weighted
and from the hydraulic barriers developed in the industrial                      (IDW) interpolation was used within MOVE to construct
areas were also used as outputs (Rusi 2007; Di Molfetta and                      the surfaces, then processed within Visual MODFLOW Flex
Fracassi 2008).                                                                  in order to derive the volumetric extension of the geological
  Topography (e.g. stream bed elevation) was implemented in                      bodies (Fig. 3) and the subsequent volumetric gridding of the
the model using DTM LiDAR 1x1 m data for the Abruzzo                             various model layers (Fig. 2c and 4).
Region, provided by the Ministero dell’Ambiente e della                             A semi-uniform grid was adopted to obtain a discretization
Tutela del Territorio e del Mare (MATTM) and distributed                         that would be representative of the complex geology of the
under Creative Commons licence.                                                  area. Such a grid allows representing complex geometries
                                                                                 like pinch-outs, erosive truncation of geological bodies and
From the conceptual model to the numerical model                                 general lateral discontinuities and changes in lithologies. The
(methods)                                                                        layers that result from such a gridding process have variable
  Steady-state simulations were undertaken to refine the                         thickness that are a function of the hydrogeological units
hydrogeological characteristics of the area and to validate the                  represented in the model. The grid is made of 15 layers with
conceptual model. Boundary conditions were subsequently                          variable thickness (Fig. 2c e 4). Each layer has cells of constant
changed to assess the effects of the SAWF turning off.                           15x15 m dimensions. Each of them was automatically assigned

Acque Sotterranee - Italian Journal of Groundwater (2018) - AS27- 361: 49 - 58                                                                                          51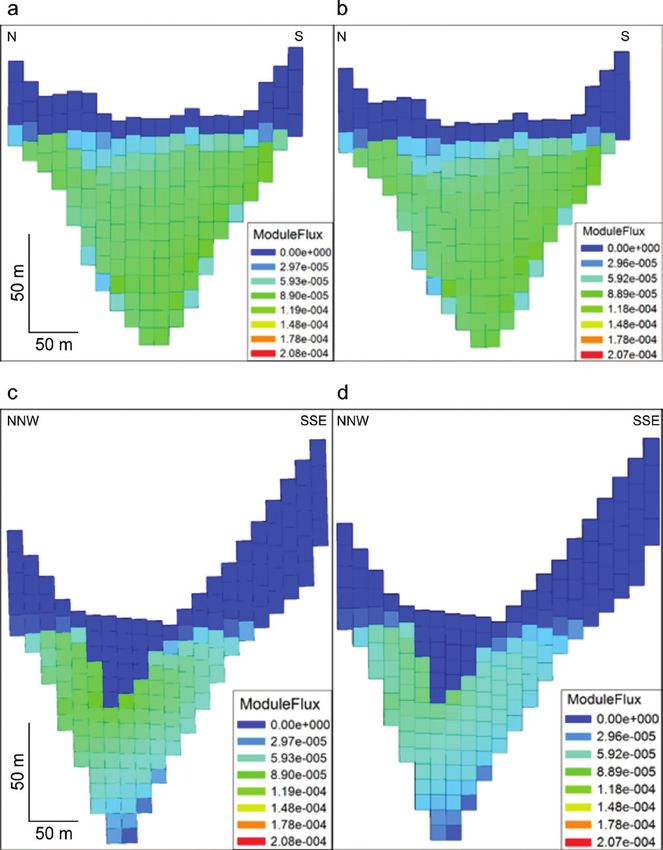
DOI: 10.7343/as-2018-361

                                                                                                                         Fig. 3 - 3-D representation of some of the geological
                                                                                                                         bodies present derived from the vectorization of the hy-
                                                                                                                         drogeological sections. 1) lacustrine deposits; 2) traver-
                                                                                                                         tine deposits; 3) head deposits; 4) bedrock.
                                                                                                                         Fig. 3 - Rappresentazione 3-D di alcuni dei corpi
                                                                                                                         geologici presenti, derivante dalla vettorializzazio-
                                                                                                                         ne delle sezioni idrogeologiche. 1) depositi lacustri;
                                                                                                                         2) depositi travertinosi; 3) depositi detritici di ver-
                                                                                                                         sante; 4) substrato.

                                                                                            to a specific property zone to permit a more efficient model
                                                                                            simulation (Fig. 4).
                                                                                              Hydrogeological parameters were assigned to each property
                                                                                            zone (Tab. 1). Specifically, horizontal hydraulic conductivity
                                                                                            (Kx and Ky), vertical conductivity (Kz) and effective porosity
                                                                                            (ne) were assigned. These are all necessary with steady-
                                                                                            state numerical modelling and particle tracking procedures
                                                                                            undertaken with the MODPATH post-processor (Pollock
                                                                                            2012). Initial horizontal hydraulic conductivity values were
                                                                                            taken from literature (Rusi 2007, 2014; Gargini et al. 2015)
                                                                                            and were optimized during the calibration phase, where
                                                                                            horizontal isotropy was chosen (Kx=Ky). An anisotropy ratio
Fig. 4 - Plan showing the different zones of the model (Tab. 1). Zone 6 does not show       Kx/Kz equal to 10 was selected for the vertical conductivity,
on the outcrop.                                                                             as suggested by Todd and Mays (2005). Effective porosity
Fig. 4 - Planimetria delle Zone del modello (Tab. 1). La Zona 6 non è presente              values (ne) were obtained from Singhal and Gupta (2010).
in affioramento.
                                                                                              The boundary conditions (Fig. 5) were set after defining
                                                                                            the grid and the hydraulic properties of the various zones,
                                                                                            attempting to represent the system as realistically as possible.
Tab. 1 - List of hydrogeological complex present and their respective property zone of      Each hydrogeological element was simulated using different
the active grid. The hydraulic conductivity values (Kx, Ky, Kz) are in m/s; the effective   boundary conditions:
porosity (ne) is dimensionless.                                                             • General Head Boundary (GHB) conditions were adopted
Tab. 1 - Elenco dei complessi idrogeologici presenti e relative zone della gri-                  using hydraulic head distributions taken from literature
glia attiva. I valori di conducibilità idraulica (Kx, Ky, Kz) sono in m/s; la poro-
sità efficace (ne) è adimensionale.
                                                                                                 (Boni et al. 1986; Massoli-Novelli et al. 1998; Conese
                                                                                                 et al. 2001; Rusi 2007; Desiderio et al. 2012) and the
    Hydrogeological               Zone          Kx=Ky                Kz            ne            optimized hydraulic conductivity of corresponding
       complex                                                                                   deposits to simulate recharge from the Morrone and
 Alluvial deposits                   1          1.0x10⁻⁴          1.0x10⁻⁵        0.25           Roccatagliata massifs. This boundary condition was used
 (near the SAWF)                                                                                 along the boundaries of the active grid, only where the
 Travertine deposits                 2          5.0x10⁻³         5.0x10⁻⁴         0.30           limestone bedrock is present, and both upstream and
 Head deposits                       3          8.0x10⁻³         8.0x10⁻⁴         0.30           downstream of the continental deposits.
 Weathered limestone                 4          8.0x10⁻³         8.0x10⁻⁴         0.20
                                                                                            • River (RIV) boundary conditions, used to simulate river
                                                                                                 features, that interact with groundwater in different parts
 Lacustrine deposits                 5          6.5x10⁻⁶          6.5x10⁻⁷        0.12
                                                                                                 of the study area. River sections were divided into various
 (near the BOS)
                                                                                                 segments to improve the simulation of the surface water-
 Lacustrine deposits                 6          3.0x10⁻⁶         3.0x10⁻⁷         0.12           groundwater interactions. Each segment has different
 (near the SAWF)                                                                                 properties, including river hydraulic head, elevation of
 Alluvial deposits                   7          5.0x10⁻⁴          5.0x10⁻⁵        0.20           the streambed, thickness and vertical conductivity of the
 (near the BOS)                                                                                  streambed deposits and width of the river. These river

52                                                                                          Acque Sotterranee - Italian Journal of Groundwater (2018) - AS27- 361: 49 - 58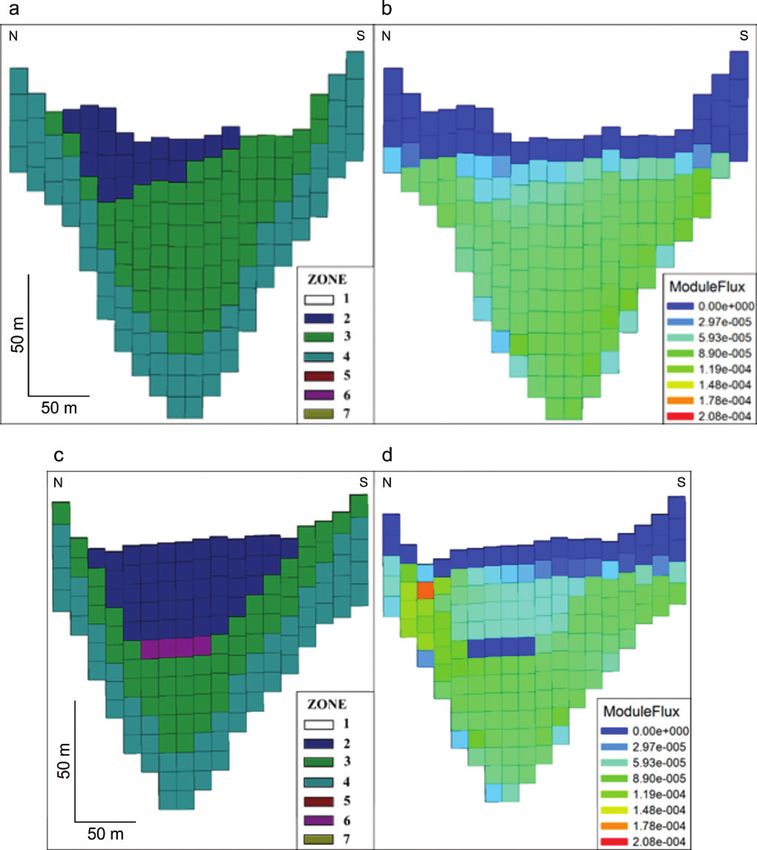
DOI: 10.7343/as-2018-361

      features were chosen calibrating the numerical model.                             The reliability of the calibration, corresponding to the
•     Well (WEL) boundary conditions were used to simulate                            selected combination of parameters and boundary conditions,
      abstraction from boreholes and from the hydraulic                               was validated using specific criteria and statistics (Wels et al.
      barriers. The SAWF boreholes, abstracting 300 l/s, and                          2012; Anderson et al. 2015):
      two pump and treat hydraulic barriers, constituted of a                         • the flow paths and the hydraulic gradients must be
      total of 13 boreholes (abstraction rates varying between                             comparable with the ones observed in field measurements;
      0.8 l/s and 1.4 l/s) installed in the BOS, were active during                   • the Mass Balance Error (MBE) must be less than 1%;
      the summer 2007 monitoring campaign. This boundary                              • the Normalized Mean Absolute Error (NMAE) must be
      condition was switched off in the second scenario and                                less than 10%;
      simulated the SAWF turning off (-300 l/s) following                             • the Normalized Residual Mean (NRM) must be less
      the identification of groundwater contamination. It                                  than 5%;
      is important to highlight that the pumping wells in                             • the Normalized Root Mean Square Error (NRMSE)
      the SAWF have lengths ranging from 32 m up to 63                                     must be less than 10%.
      m. Their filters start at a depth ranging from 6 m to
      31 m and reach the bottom in each well. With this set                           Local water budget
      up, the SAWF wells drain groundwater from alluvial
                                                                                        In order to evaluate the specific contribution of each
      deposits, head deposits and fractured limestone. The
                                                                                      hydrogeological feature to the total budget of the PG aquifer,
      corresponding layers are variable, although the pumping
                                                                                      inflow and/or outflows from the different boundary conditions
      wells are always located between the 2nd and the 7th layer.
                                                                                      were calculated by means of ZONEBUDGET (Harbaugh
•     Recharge (RCH) boundary conditions were used to
                                                                                      1990). This MODFLOW post-processor allows to calculate
      simulate rainfall recharge. Recharge was initially
                                                                                      the water budget in every zone of the model domain.
      estimated from the analysis of 1951-2009 rainfall and
      temperature time-series using the Thornthwaite and
                                                                                      Particle tracking
      Mather (1957) method and with reference to consolidated
      estimates from literature (Conese et al 2001; Nanni and                           To evaluate the effects of the SAWF turning off on the
      Rusi 2003; Viaroli et al. 2018b). A constant recharge of                        advective transport in groundwater, the particle tracking,
      235 mm/y was applied across the entire model area.                              using MODPATH (Pollock 2012), was performed. The
                                                                                      MODPATH post-processor calculates the forward path of
                                                                                      each particle and its residence time in the aquifer, starting
                                                                                      from hydraulic head and module flux distribution in the
                                                                                      numerical domain.
                                                                                        Contamination at the Bussi Officine SNI is mainly related
                                                                                      to industrial waste product burials containing chlorinated
                                                                                      solvents (Di Molfetta and Fracassi 2008; Filippini et al 2018),
                                                                                      that are DNAPLs (Dense Non-Aqueous Phase Liquids). The
                                                                                      industrial wastes dump is characterized by a thickness ranging
                                                                                      from about 2 m and up to more than 10 m. During the selected
                                                                                      time period (i.e. 2007-2008), it was not physically separated
                                                                                      from the host rocks, allowing the leaking of chlorinated
                                                                                      solvents into the aquifer. These compounds are characterized
Fig. 5 - Boundary conditions used in the numerical model. The Recharge (RCH) bound-   by low solubility in water and high tendency to be adsorbed
ary condition was homogeneously applied across the first layer of the grid.           on the solid matrix. Furthermore, they move downward into
Fig. 5 - Condizioni al contorno adottate nel modello numerico. La condizione          the aquifer, even in the saturated zone, and accumulate at the
al contorno Recharge (RCH) è stata applicata omogeneamente a tutto il primo
layer della griglia.
                                                                                      bottom, releasing slowly chlorinated solvents in groundwater
                                                                                      (Beretta 1992; Fetter 1994; Appelo and Postma 2005). In
Model calibration                                                                     order to reproduce this behavior, the particle starting points
                                                                                      were located vertically under the industrial waste dump.
  Although the numerical model calibration could be
performed automatically by means of specific automated
procedures (e.g. PEST; Doherty 2015), at this stage, the Trial                        Steady-state numerical model
& Error approach was chosen. Using this approach, the input                             Below, the results of the numerical model related to
parameters must be changed in each model run, until the                               summer 2007 monitoring (Scenario 1) are shown, when
model results fit the calibration targets. In particular, the                         the SAWF was active. The comparison between simulated
calibration targets are the hydraulic heads measured in the                           and measured hydraulic heads (Fig. 6) and the evaluation
monitoring network (Fig. 1), during the summer of 2007. In                            statistics (Tab. 2) confirm the hypothesized conceptual
this model, each calibration target refers to a specific model                        model and validate the boundary conditions selected to
layer, according with borehole completion depth.                                      reproduce every hydrogeological feature of the study area, in

Acque Sotterranee - Italian Journal of Groundwater (2018) - AS27- 361: 49 - 58                                                                    53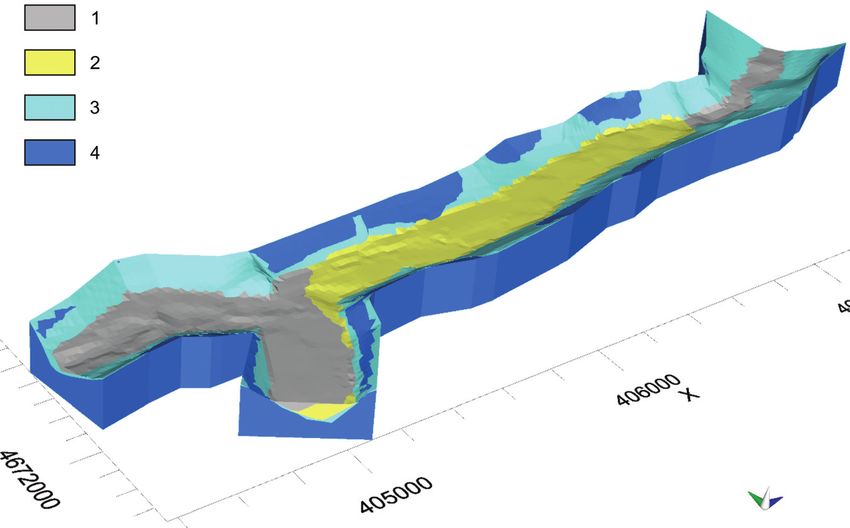
DOI: 10.7343/as-2018-361

terms of hydraulic conductivity distribution, surface water-
groundwater relationships, recharge from the limestone
aquifer, groundwater abstractions, and recharge. However,
although statistics are always below the suggested thresholds
(Tab. 2), sometimes the simulated hydraulic head differs
substantially from the measured one (mean error > 1.5 m;
Fig. 6). This difference could be ascribable to: i) the intrinsic
variability of hydraulic properties within each geological
body, especially for coarse head deposits and travertine facies;
ii) the lack of accurate information about main rivers, in
terms of geometry of river bottom, thickness and hydraulic
conductivity of the hyporheic zone, river level distribution
within the study area.
   Analyzing the numerical modeling results, the hydraulic
head distribution (Fig. 8a) related to Scenario 1 suggests
that surface water-groundwater interactions exist near the
confluence of Pescara and Tirino Rivers. Surface water leaks
about 0.107 m3/s into the aquifer, 0.001 m3/s of which from
Pescara River and 0.106 m3/s from Tirino River. These results
are consistent with the hypothesized conceptual model. In
fact, Tirino River recharges the shallower aquifer layers (i.e.
alluvial deposits), present beneath the BOS. Instead, Pescara
River appears hydraulically connected to groundwater, but it
does not leak water into the aquifer.
                                                                                      Fig. 7 - Module flux (in m/s) distribution (b and d) within the cross-sections 10T (a)
   The surface water-groundwater relationship is reversed near                        and 15T (c). Traces of the cross-sections in Fig. 1; vertical exaggeration 2x.
the SAWF. Here, the hydraulic head distribution suggests
                                                                                      Fig. 7 - Distribuzione del flusso modulare in m/s (b e d) in corrispondenza delle
that groundwater flows into the Pescara River feeding the                             sezioni 10T (a) e 15T (c). Tracce delle sezioni in Fig. 1; esagerazione verticale 2x.
Tab. 2 - Evaluation statistical parameters related to the numerical model, compared
with the threshold values (Reilly and Harbaugh 2004; Wels et al. 2012; Anderson
                                                                                      increase in river flow reported in literature. Its discharge,
et al. 2015).                                                                         calculated in the numerical modeling, is equal to 0.760 m3/s,
Tab. 2 - Parametri statistici di valutazione del modello numerico calcolati           as previously measured.
e confrontati con i valori soglia (Reilly & Harbaugh 2004; Wels et al. 2012;             The calculated inflow from the Morrone carbonate aquifer
Anderson et al. 2015).                                                                is equal to 0.750 m3/s. Nevertheless, this inflow seems to be
   Evaluation parameter             Threshold           Calculated value              located mainly near the thrust, where the coexistence of a
   MBE                                 < 1%                    0.02%                  highly fractured rock mass and a groundwater barrier (no flux)
                                                                                      facilitate groundwater discharge into the PG aquifer. This is
   NMAE                                < 10%                   6.47%
                                                                                      also confirmed by the modeled hydraulic head distribution
   NMR                                 < 5%                    2.33%                  in the central part of the study area, where, even though the
   NRMSE                               < 10%                    7.17%                 General Head Boundary (GHB) is present, groundwater does

                                                                                                              Fig. 6 - Comparison between simulated and measured hydrau-
                                                                                                              lic heads (Scenario 1).
                                                                                                              Fig. 6 - Confronto tra i carichi idraulici misurati e quelli
                                                                                                              simulati (Scenario 1).

54                                                                                    Acque Sotterranee - Italian Journal of Groundwater (2018) - AS27- 361: 49 - 58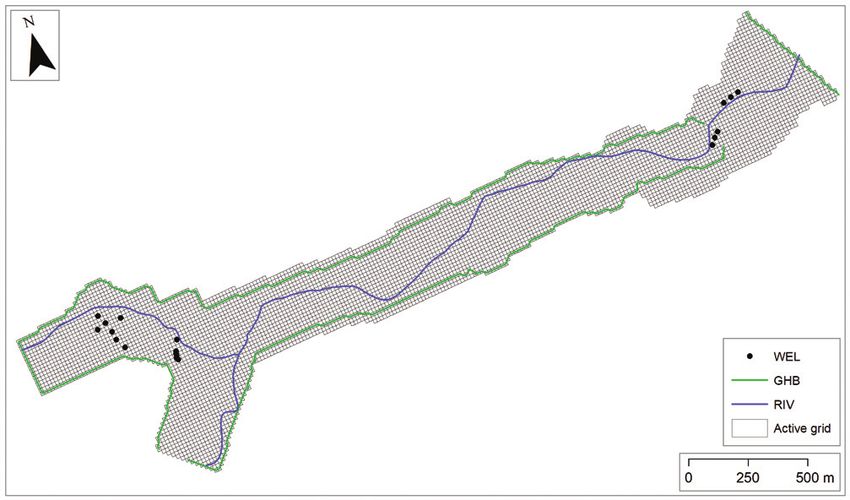
DOI: 10.7343/as-2018-361
not seem to interact with the carbonate aquifer. from the SAWF was excluded (Scenario 2).
In addition, the groundwater abstraction effect, from the Comparing the hydraulic head distributions obtained from
SAWF and the hydraulic barriers in the BOS, is very clear, the two simulations, differences between the two scenarios
since it warps the water table. are evident, near the SAWF and the increase in river flow.
As expected in such a heterogenous aquifer, the In Scenario 2, the groundwater flow seems to converge more
groundwater flow is not homogeneous. Analyzing the module sharply towards the Pescara River than in the Scenario 1. In
flux distribution (i.e. the specific discharge in each cell; fact, the discharge of the increase in river flow for Scenario 2
defined as v = K * i, where K is the hydraulic conductivity is equal to 0.93 m3/s (about 22% more than in Scenario 1).
and i is the hydraulic gradient) in the cross-sections The particle tracking results for the two scenarios (Fig. 8
(Fig. 7), it appears that the module flux is higher within head and 9) show significant differences, especially in the central-
deposits and weathered bedrock (about 9e-5 m/s, maximum eastern part of the study area. Starting from the industrial
value about 1.2e-4 m/s) than within travertine deposits (about wastes dump, particles move mostly within the head deposits
6e-5 m/s). Lacustrine deposits, instead, show very low module and the weathered bedrock (Fig. 8a, 8b, 9a and 9b). Near the
flux values, confirming their role as aquitard. In addition, in increase in river flow, most of the particles (66.7%) flows into
Fig. 7d, the very high value (about 1.8e-4 m/s) refers to the the Pescara River, in both scenarios (Fig. 8c and 9c, Tab. 3).
increase in river flow. When the SAWF is active (Scenario 1), the remaining part
of the particles flows into the pumping wells (24.4%) and, a
Effects of changes to groundwater abstraction pattern lesser part (8.9%), downstream in groundwater (Fig. 8c). In
The SAWF turning off has caused significant changes in Scenario 2, instead, all the remaining particles (33.3%) flow
the PG aquifer hydrodynamic and in the advective transport, downstream in groundwater (Fig. 9c).
whose effects were assessed by means of the numerical Tab. 4 shows that the SAWF turning off causes an increase
modeling. Starting from Scenario 1, groundwater abstraction in residence times, especially for minimum values (tmin = 106
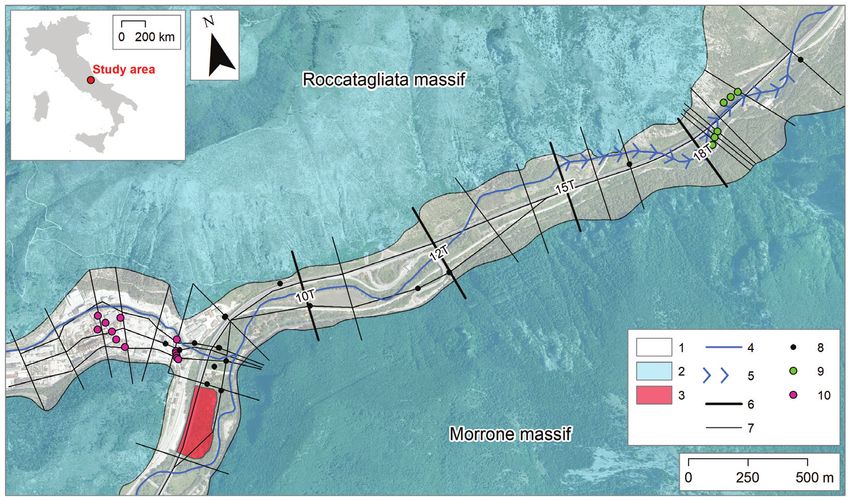
Fig. 8 - Hydraulic head and particle tracking distribution in the Sce-
nario 1 (a). Below: 3-D representation of particle tracking near the
cross-sections 10T (b) and 18T (c). Traces of the cross-section in Fig. 1.
The blue dots represent the River (RIV) boundary conditions.
Fig. 8 - Distribuzione dei carichi idraulici e dei percorsi delle
particelle nello Scenario 1 (a). In basso, distribuzione 3-D delle
traiettorie delle particelle, in prossimità delle sezioni 10T (b) e 18T
(c). Tracce delle sezioni in Fig. 1. I puntini blu rappresentano le
condizioni al contorno di tipo River (RIV).
Acque Sotterranee - Italian Journal of Groundwater (2018) - AS27- 361: 49 - 58 55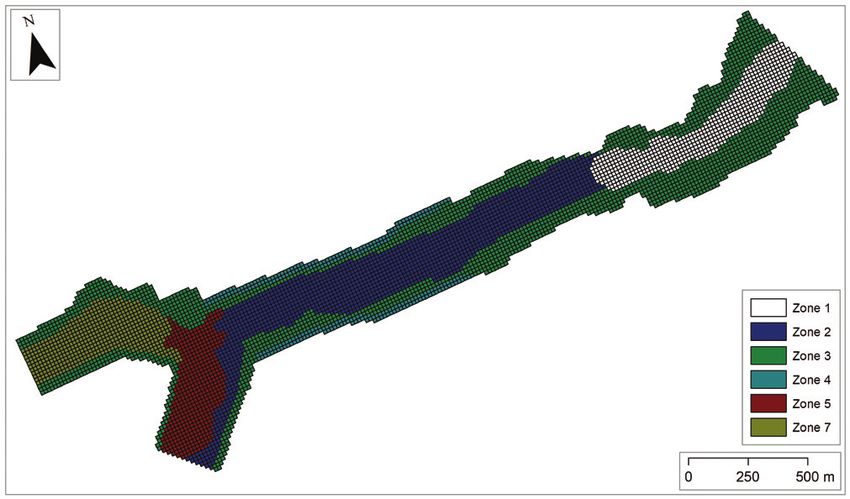
DOI: 10.7343/as-2018-361

                                                                                                 Fig. 9 - Hydraulic head and particle tracking distribution in the Sce-
                                                                                                 nario 2 (a). Below, 3-D representation of particle tracking near the
                                                                                                 cross-sections 10T (b) and 18T (c). Traces of the cross-section in Fig. 1.
                                                                                                 The blue dots represent the River (RIV) boundary conditions.
                                                                                                 Fig. 9 - Distribuzione dei carichi idraulici e dei percorsi delle particelle
                                                                                                 nello Scenario 2 (a). In basso: distribuzione 3-D delle traiettorie delle
                                                                                                 particelle, in prossimità delle sezioni 10T (b) e 18T (c). Tracce delle se-
                                                                                                 zioni in Fig. 1. I puntini blu rappresentano le condizioni al contorno di
                                                                                                 tipo River (RIV).

Tab. 3 - Comparison between particle target percentages in the two scenarios.      depression has a relatively small size, although the pumping
Tab. 3 - Confronto tra le percentuali relative ai punti di recapito delle parti-   rate is 300 l/s.
celle nei due scenari.                                                                All these differences in hydrodynamic features between the
                                 % of particles              % of particles        two scenarios have important implications on the advective
         Target
                                  (Scenario 1)                (Scenario 2)         contaminant transport of the Bussi Officine SNI. In Scenario
 F. Pescara                            66.7                         66.7           1, although the pumping wells of the SAWF act as a hydraulic
 SAWF                                  24.4                           0            barrier limiting the contamination spread in groundwater
                                                                                   downstream, groundwater abstraction decreases the particle
 Aquifer downstream                     8.9                         33.3
                                                                                   (i.e. contaminants) residence times and facilitate their
          Tab. 4 - Comparison between residence times in the two scenarios         mobility in the aquifer. On the contrary, in Scenario 2, the
          Tab. 4 - Confronto tra i tempi di transito nei due scenari.              decrease in groundwater flow slows down the particle motion
                                                                                   in the aquifer, even if the total amount flowing downstream is
      Travel time              Scenario 1                Scenario 2                higher than in Scenario 1. In addition, although the number
      tmax (days)                      1635                      1635              of particles flowing into the Pescara River is the same in both
      tmin (days)                       107                       122              scenarios (Tab. 3), the higher increase in river flow, caused
      tmean (days)                      427                       432              by the SAWF turning off, favors dilution in surface water,
                                                                                   decreasing the contaminants’ concentration represented by
days, in Scenario 1; tmin = 122 days, in Scenario 2). This effect                  the particles.
is clearly related to the substantial groundwater flow decrease
(Fig. 10), that takes place as a result of the SAWF turning                        Conclusions and future developments
off. The module flux variation is evident mostly near the                            The hydrogeological modeling results confirmed the great
SAWF (Fig. 10c and 10d), while it is not significant upstream                      capability of numerical methods in very complex geometry of
(Fig. 10a and 10b), near the confluence between the Pescara                        geological bodies, as in Popoli Gorges.
River and the Tirino River. This suggests that the cone of                           Useful information could be obtained about the effect of

56                                                                                 Acque Sotterranee - Italian Journal of Groundwater (2018) - AS27- 361: 49 - 58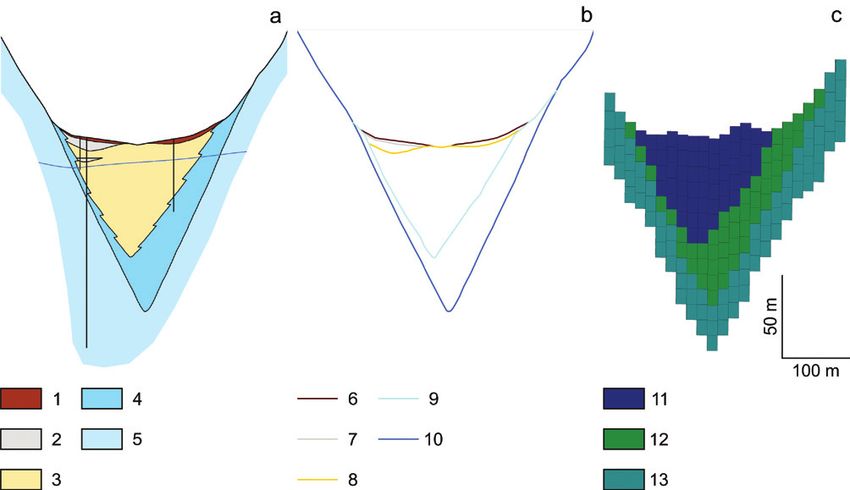
DOI: 10.7343/as-2018-361

                                                                                          REFERENCES
                                                                                          Anderson MP, Woessner WW, Hunt RJ (2015) Applied groundwater
                                                                                              modeling: simulation of flow and advective transport. Academic
                                                                                              press.
                                                                                          Appelo CAJ, Postma D (2005) Geochemistry, Groundwater and Pollu-
                                                                                              tion. CRC press.
                                                                                          Ayvaz MT, Karahan H (2008) A simulation/optimization model for the
                                                                                              identification of unknown groundwater well locations and pump-
                                                                                              ing rates. Journal of Hydrology 357(1-2):76-92. doi:10.1016/j.jhy-
                                                                                              drol.2008.05.003
                                                                                          Beretta G P (1992) Idrogeologia per il disinquinamento delle acque
                                                                                              sotterranee: tecniche per lo studio e la progettazione degli inter-
                                                                                              venti di prevenzione, controllo, bonifica e recupero “Hydrogeology for
                                                                                              groundwater cleanup: technologies for protection, monitoring, remediation
                                                                                              and restoration planning”. Pitagora Editrice, Bologna.
                                                                                          Boni C, Bono P, Capelli G (1986) Schema Idrogeologico dell’Italia cen-
                                                                                              trale: note illustrative e carte “Hydrogeological framework of Central
                                                                                              Italy: descriptive notes and maps”. Memorie della Società Geologica
                                                                                              Italiana 35:991-1012.
                                                                                          Caschetto M, Colombani N, Mastrocicco M, Petitta M, Aravena R
                                                                                              (2016) Estimating groundwater residence time and recharge pat-
                                                                                              terns in a saline coastal aquifer. Hydrological Processes 30(22):4202-
                                                                                              4213. doi:10.1002/hyp.10942
                                                                                          Chiaudani, A., Di Curzio, D., Palmucci, W., Pasculli, A., Polemio, M.,
                                                                                              Rusi, S., 2017. Statistical and fractal approaches on long time-series
                                                                                              to surface-water/groundwater relationship assessment: A central
                                                                                              Italy alluvial plain case study. Water 9:850. doi:10.3390/w9110850
                                                                                          Conese M, Nanni T, Peila C, Rusi S, Salvati R (2001) Idrogeologia
                                                                                              della Montagna del Morrone (Appennino Abruzzese): dati prelimi-
                                                                                              nari “Hydrogeology of the Morrone mountain (Abruzzi, Central Apen-
                                                                                              nines): preliminary data”. Memorie della Società Geologica Italiana
                                                                                              56:181-196.
Fig. 10 - Comparison between module fluxes (in m/s) simulated in the Scenarios 1 (a       Desiderio G, Folchi Vici D’Arcevia C, Nanni T, Rusi S (2012) Hydro-
and c) and 2 (b and d), near the cross-sections 10T (above) and 18T (below). Traces of        geological mapping of the highly anthropogenically influenced
the cross-section in Fig. 1; vertical exaggeration 2x.                                        Peligna Valley intramontane basin (Central Italy). Journal of Maps
                                                                                              8(2):165-168. doi:10.1080/17445647.2012.680778
Fig. 10 - Confronto tra i flussi modulari (in m/s) negli Scenari 1 (a e c) e 2 (b e d),   Di Curzio D, Palmucci W, Rusi S (2014) Detailed geological charac-
in corrispondenza delle sezioni 10T (in alto) e 18T (in basso). Tracce delle sezioni          terization to define groundwater flow in Gole di Popoli (Central
in Fig. 1; esagerazione verticale 2x.                                                         Eastern Apennine). Flowpath 2014 - National Meeting on Hydro-
                                                                                              geology, Abstract Volume 136-137.
the abstraction variations on the aquifer hydrodynamic and                                Di Curzio D, Palmucci W, Rusi S., Signanini P (2016) Evaluation of
the advective contamination transport in groundwater. In                                      processes controlling Fe and Mn contamination in the San Pedro
fact, the comparison of the two steady-state numerical models                                 Sula porous aquifer (North Western Honduras). Rendiconti Online
and their particle tracking analyses allowed to assess that: 1)                               della Società Geologica Italiana 41:42-45. doi:10.3301/ROL.2016.88
the Pescara River is the most important target for the particle                           Di Molfetta A, Fracassi F (2008) Consulenza tecnica sulla contaminazi-
                                                                                              one in atto nell’area del polo industriale di Bussi “Technical advice
that represent in a simplified manner contamination (i.e. only                                about the ongoing contamination in the Bussi industrial site”. Consulenza
advective transport), regardless of the activity of the well                                  tecnica per conto della Procura della Repubblica presso il Tribunale
field; 2) the well field, active until 2007, acted as a hydraulic                             di Pescara.
barrier, limiting the contamination spread in groundwater                                 Doherty J (2015) Calibration and Uncertainty Analysis for Complex En-
downstream; 3) nevertheless, the cone of depression of the well                               vironmental Models. Watermark Numerical Computing, Brisbane.
                                                                                          Fetter CW (2000) Applied hydrogeology. Prentice-Hall, Englewood
field decreased the particle (i.e. contaminants) residence times                              Cliffs.
and facilitate their mobility in the aquifer; 4) the well field                           Filippini M, Nijenhuis I, Kümmel S, Chiarini V, Crosta G, Richnow
turning off, although no longer limiting the contamination                                    HH, Gargini A (2018) Multi-element compound specific stable iso-
spread in the aquifer, caused an increase in residence time of                                tope analysis of chlorinated aliphatic contaminants derived from
particles; 5) the general decrease in groundwater abstractions                                chlorinated pitches. Science of The Total Environment, 640:153-
                                                                                              162. doi:10.1016/j.scitotenv.2018.05.285
also caused a higher increase in river flow that favored                                  Freeze R, Cherry JA (1979) Groundwater. Prentice-Hall, Englewood
contaminants’ dilution in surface water.                                                      Cliffs.
   Even though the implemented numerical modeling                                         Gargini A, Angeloni A, Crespi D, De Caterini G, De Vita M, Kovacs
provided useful information, further developments could be                                    M, Leoni G, Zaffiro P (2015) Piano della caratterizzazione della dis-
obtained modeling the effect of the wells’ turning off on the                                 carica abusiva situata in località “I Tre Monti” facente parte del
                                                                                              sito di interesse nazionale “Bussi sul Tirino” Characterizazion plan of
groundwater contamination by means of an advective-reactive-                                  the illegal dump in the “I Tre Monti” site belonging to the site of national
dispersive transport modeling in transient conditions, that is                                interest “Bussi sul Tirino”. Consulenza per conto del Commissario
the next step in this research project.                                                       Delegato.

Acque Sotterranee - Italian Journal of Groundwater (2018) - AS27- 361: 49 - 58                                                                                      57
DOI: 10.7343/as-2018-361
Greskowiak J, Prommer H, Massmann G, Nützmann G (2006) Mod- Rossetto R, De Filippis G, Borsi I, Foglia L, Cannata M, Criollo R,
eling seasonal redox dynamics and the corresponding fate of the Vázquez-Suñé E (2018) Integrating free and open source tools and
pharmaceutical residue phenazone during artificial recharge of distributed modelling codes in GIS environment for data-based
groundwater. Environmental Science & Technology 40:6615-6621. groundwater management. Environmental Modelling & Software
doi:10.1021/es052506t 107:210-230. doi:10.1016/j.envsoft.2018.06.007
Harbaugh AW (1990) A computer program for calculating subregional Rusi S (2007) Studi e ricerche sul comportamento idrodinamico ed
water budgets using results from the USGS modulater 3D finite- idrochimico di acquiferi porosi e fessurati sottoposti ad emungi-
difference groundwater flow model. US Geological Survey 24. mento a scopo potabile tramite pozzi nelle località di Val Vomano,
Harbaugh AW (2005) MODFLOW-2005, The U.S. Geological Survey Pretoro e Castiglione a Casauria gestiti dall’ACA Relazione idro-
Modular Ground-Water Model - the Ground-Water Flow Process. geologica “Studies and researches on the hydrodynamic and hydrochemical
US Geol Surv Tech Methods 253. behavior of porous and fractured aquifers under abstraction conditions for
ISPRA (2006a) Carta Geologica d’Italia (scala 1:50000), Foglio 360 drinking purposes by means of pumping wells in Vomano valley, Pretoro
“Torre de’ Passeri” “Geological map of Italy (1:50000 scale), Section site and Castiglione a Casauria site managed by ACA. Hydrogeological
360 “Torre de’ Passeri””. Servizio Geologico d’Italia. report”. Report interno ACA (Azienda Consortile Acquedottistica)
ISPRA (2006b) Carta Geologica d’Italia (scala 1:50000), Foglio 369 S.p.A.
“Sulmona” “Geological map of Italy (1:50000 scale), Section 369 “Sul- Rusi S (2014) Prove di permeabilità sul campo pozzi San Rocco nel
mona””. Servizio Geologico d’Italia. comune di Bussi sul Tirino senza interruzione della distribuzione in
La Vigna F, Demiray Z, Mazza R (2014) Exploring the use of alterna- rete “Pumping tests in the San Rocco well field in Bussi sul Tirino during
tive groundwater models to understand the hydrogeological flow water supply”. Report interno ACA (Azienda Consortile Acquedot-
processes in an alluvial context (Tiber River, Rome, Italy). Envi- tistica) Spa.
ronmental earth sciences 71(3):1115-1121. doi:10.1007/s12665-013- Shammas MI (2008) The effectiveness of artificial recharge in combat-
2515-8 ing seawater intrusion in Salalah coastal aquifer, Oman. Environ-
Massoli-Novelli R, Petitta M, Salvati R (1998) La situazione idrogeo- mental Geology 55(1):191-204. doi:10.1007/s00254-007-0975-4
logica e ambientale delle Gole di Popoli (Abruzzo): primi risultati Singhal BBS, Gupta RP (2010) Hydraulic Properties of Rocks. In:
e prospettive di ricerca “The hydrogeological and environmental state of Applied Hydrogeology of Fractured Rocks. Springer, Dordrecht.
the Popoli Gorges (Abruzzi): first results and future research prospectives”. doi:10.1007/978-90-481-8799-7_8
Memorie della Società Geologica Italiana 53:563-584. Stefania GA, Rotiroti M, Fumagalli L, Simonetto F, Capodaglio P,
Mastrocicco M, Colombani N, Sbarbati C, Petitta M (2012) Assessing Zanotti C, Bonomi T (2018) Modeling groundwater/surface-water
the effect of saltwater intrusion on petroleum hydrocarbons plumes interactions in an Alpine valley (the Aosta Plain, NW Italy): the
via numerical modelling. Water, Air, & Soil Pollution 223(7):4417- effect of groundwater abstraction on surface-water resources. Hy-
4427. doi:10.1007/s11270-012-1205-6 drogeology Journal 26(1):147-162. doi:10.1007/s10040-017-1633-x
Nanni T, Rusi S (2003) Idrogeologia del massiccio carbonatico della Thornwaite CW, Mather JR (1957) Instructions and tables for comput-
montagna della Majella (Appennino centrale) “Hydrogeology of the ing potential evapotranspiration and the water balance. Publica-
“montagna della Majella” carbonate massif (Central Apennines-Italy)”. tions in Climatology 10(3):183-243.
Bollettino della Società geologica italiana 122(2):173-202. Todd DK, Mays LW (2005) Groundwater hydrology. Wiley, Hoboke.
Petitta M, Mastrorillo L, Preziosi E, Banzato F, Barberio MD, Billi A, Vessia G, Di Curzio D (2018) Lacustrine Deposits. In: Bobrowsky P.,
Cambi C, De Luca G, Di Carlo G, Di Curzio D et al. (2018) Water- Marker B. (eds) Encyclopedia of Engineering Geology. Encyclope-
table and discharge changes associated with the 2016-2017 seismic dia of Earth Sciences Series. Springer, Cham. doi:10.1007/978-3-
sequence in central Italy: Hydrogeological data and a conceptual 319-12127-7_179-1
model for fractured carbonate aquifers. Hydrogeology Journal 26:1- Viaroli S, Lotti F, Mastrorillo L, Paolucci V, Mazza R (2018a) Simpli-
18. doi:10.1007/s10040-017-1717-7 fied two-dimensional modelling to constrain the deep groundwater
Pollock DW (2012) User Guide for MODPATH Version 6-A Particle- contribution in a complex mineral water mixing area, Riardo Plain,
Tracking Model for MODFLOW. Sect A, Groundw B 6, Model southern Italy. Hydrogeology Journal. doi: 10.1007/s10040-018-
Tech 58 p. 1910-3
Refsgaard JC, Christensen S, Sonnenborg TO, Seifert D, Højberg AL, Viaroli S, Mastrorillo L, Lotti F, Paolucci V, Mazza R (2018b) The
Troldborg L (2012) Review of strategies for handling geological un- groundwater budget: A tool for preliminary estimation of the hy-
certainty in groundwater flow and transport modeling. Advances draulic connection between neighboring aquifers. Journal of Hy-
in Water Resources 36:36-50. doi:10.1016/j.advwatres.2011.04.006 drology 556:72-86. doi:10.1016/j.jhydrol.2017.10.066
Reilly T E, Harbaugh AW (2004) Guidelines for evaluating ground- Wels C, Mackie D, Scibek J (2012) Guidelines for groundwater model-
water flow models. US Department of the Interior, US Geological ling to assess impacts of proposed natural resource development
Survey 30. activities. Ministry of Environment, Water Protection & Sustain-
Rojas R, Feyen L, Dassargues A (2008) Conceptual model uncertainty ability Branch.
in groundwater modeling: Combining generalized likelihood un-
certainty estimation and Bayesian model averaging. Water Re-
sources Research 44(12):W12418. doi:10.1029/2008WR006908
58 Acque Sotterranee - Italian Journal of Groundwater (2018) - AS27- 361: 49 - 58You can also read