A collective risk dilemma for tourism restrictions under the COVID 19 context - Nature
←
→
Page content transcription
If your browser does not render page correctly, please read the page content below
www.nature.com/scientificreports
OPEN A collective risk dilemma
for tourism restrictions
under the COVID‑19 context
1,2* 3,4 4
Manuel Chica , Juan M. Hernández & Jacques Bulchand‑Gidumal
The current COVID-19 pandemic has impacted millions of people and the global economy. Tourism
has been one the most affected economic sectors because of the mobility restrictions established
by governments and uncoordinated actions from origin and destination regions. The coordination
of restrictions and reopening policies could help control the spread of virus and enhance economies,
but this is not an easy endeavor since touristic companies, citizens, and local governments have
conflicting interests. We propose an evolutionary game model that reflects a collective risk dilemma
behind these decisions. To this aim, we represent regions as players, organized in groups; and
consider the perceived risk as a strict lock-down and null economic activity. The costs for regions
when restricting their mobility are heterogeneous, given that the dependence on tourism of each
region is diverse. Our analysis shows that, for both large populations and the EU NUTS2 case study,
the existence of heterogeneous costs enhances global agreements. Furthermore, the decision on
how to group regions to maximize the regions’ agreement of the population is a relevant issue for
decision makers to consider. We find out that a layout of groups based on similar costs of cooperation
boosts the regions’ agreements and avoid the risk of having a total lock-down and a negligible tourism
activity. These findings can guide policy makers to facilitate agreements among regions to maximize
the tourism recovery.
The pandemic of coronavirus disease 2019 (COVID-19) is one of the most shocking global crisis in the recent
history. From Wuhan, China, to all over the world, COVID-19 has affected more than 100 million people and
caused more than 2 million deaths as of January 31, 2 0211. The effects of the pandemic originated by COVID-
19 are not limited to the public health. Mobility restrictions and the halt of the economy have caused historical
declines in every nation worldwide. In the EU, the GDP is forecast to decrease almost by 8% in 20202, and most
of the tourism-dependent countries have suffered a dramatic drop forecast in their GDP (e.g., 12% in Spain,
10% in Italy, and 9% in Greece, just to mention three of the most tourism-dependent economies in Europe)3.
A similar precedent to this COVID-19 pandemic is the 1918 Spanish Flu but in those days the world was
not as connected as it is now. Since then, the travel and tourism sector has grown from being a marginal niche
industry to one of the main industries worldwide. Notwithstanding tourism accounts for approximately 10%
of the global G DP4, its contribution by country and region is far from homogeneous. Only in Europe there is a
wide range of variation. Tourism accounts for less than 5% of the GDP in some countries (e.g., Poland) where,
in other countries such as Croatia, the tourism contribution to GDP excesses 25%. Worldwide differences are
even higher, with several countries where tourism accounts for more than half of their G DP5,6.
Many studies have been recently conducted to analyze the best policies and non-pharmaceutical interventions
to contain the pandemic while reducing the economic d amage7–11. Common conclusions are: the effectiveness
of interventions depends on the local context such as timing8, they should be treated with caution with regard to
policy-making decisions9, and must be focused on specific points of interest11. This myriad of policies have led to
the fact that the majority of tourism destinations have implemented travel restrictions12 and have gone through
different stages during the COVID-19 pandemic: from being able to accept tourists to have a complete lock-down
and not being able to accept one single visitor. Consequently, finding the best conditions for the tourism sector
under this COVID-19 context has gained attention in the tourism academic c ommunity13,14.
1
Andalusian Research Institute DaSCI “Data Science and Computational Intelligence”, University of Granada,
18071 Granada, Spain. 2School of Electrical Engineering and Computing, The University of Newcastle, Callaghan,
NSW 2308, Australia. 3Department of Quantitative Methods in Economics and Management, University of
Las Palmas de Gran Canaria, Las Palmas 35017, Spain. 4TIDES Institute for Sustainable Tourism and Economic
Development, University of Las Palmas de Gran Canaria, Las Palmas 35017, Spain. *email: manuelchica@ugr.es
Scientific Reports | (2021) 11:5043 | https://doi.org/10.1038/s41598-021-84604-z 1
Vol.:(0123456789)
www.nature.com/scientificreports/
Additionally, researchers found that another key factor in controlling the COVID-19 pandemic is the role of
coordination among regions and countries for the optimal performance of the proposed p olicies10. Private and
public organizations must be coordinated to preserve pre-COVID-19 operational levels of the tourism and travel
sector15. Tourism is an ecosystem that needs to bring together many actors from different geographic places16
and the tourist needs to be confident about the safety of her/his trip (i.e., a low perceived risk)17. Therefore, the
coordination among restrictions and reopening between origin and destination tourism regions is nowadays
necessary to control the epidemic and ameliorate the economic cost.
Our aim here is to analyze the conditions to achieve coordination among groups of regions or countries (we
use the term “regions” from now) taking into account both the economic costs and the risk of a global lock-
down because of a severe epidemiological situation. Some regions will implement restrictions on mobility and
leisure activities to avoid the risk of extreme infection rates that would originate a global economic collapse.
But consequently, these restrictions would lead to economic losses for those regions. Therefore, regions could
be tempted not to cooperate to take advantage of the stable public health conditions which were achieved from
the restrictions imposed by other regions.
Evolutionary game theory helps to represent the expected individual decisions to engage in economic costly
restrictions in the COVID-19 pandemic c ontext18. Specifically, we propose to frame the coordination problem
above as a collective-risk dilemma (CRD)19–21. Collective risks arise when preserving common or public goods
hinges on individual endowments and an investing failure hurts all the individuals of the population22. Specifi-
cally, CRDs are multiplayer public good games (PGGs) where every participant voluntarily contributes with
part of her/his endowments to achieve a target, but they may suffer from a total loss with certain probability if
the target is not achieved. The adoption of policies to prevent climate change by the global community has been
the paradigmatic CRD game illustrated in the recent scientific l iterature23. The proposed CRD model will serve
to analyze the conditions of cooperation (i.e., coordination on mobility restrictions and reopening policies)
among different regions. As the level of tourism dependence in the region is heterogeneous, the economic loss
derived from the implementation of these policies is heterogeneous as well. This heterogeneity is included in the
evolutionary game by means of different contribution costs for the common good.
We analyze how this heterogeneity influences achieving a minimum level of cooperation. Specifically, we will
answer to the question whether the heterogeneity of tourism-dependence among regions favors cooperation
level. Additionally, the way regions are grouped to cooperate may also determine the global game outcome in
terms of regions’ agreement. For example, groups can be formed at random without considering their tourism-
dependent nature. Alternatively, groups can be formed according to similar tourism dependence (i.e., groups just
having high dependent regions and groups having non-dependent regions). Therefore, a second question arises
here: Is cooperation enhanced or detracted if groups are formed by regions having similar tourism-dependence?
In order to answer the above-mentioned questions we study the effects of adding heterogeneity to the cooper-
ating costs of the players in the CRD. We define regions’ agreement (RA) as a cooperation indicator of the whole
population of regions. We conduct a set of experiments to find the most beneficial group formation in terms of
RA and global cooperation. For all the cases, the experiments evaluate different initial conditions, group sizes,
and risk levels of a collective tourism and mobility shutdown. Finally, we apply the model to a case study based
on the 312 regions of the EU NUTS2 classification. The regions at the NUTS2 level, that will be described in
detail later in this manuscript, are a paradigmatic case of decentralized response to COVID-19. Although gen-
eral EU policy recommendations have been recently laid down24,25, every country in the Union is autonomous
to implement restrictions to free movement within its territory and with other countries or regions in the EU.
The decentralized governance system in many countries (e.g. Spain, Italy, and Germany) makes a CRD model
suitable to analyze coordination policies.
Background
We address this problem of coordination for tourism in a COVID-19 context by proposing a collective risk
dilemma (CRD) model. The CRD arises because the highest payoff of every participant is obtained by free-riding
the contributions of other participants. Instead, if this strategy is followed by all players, the target would not be
achieved and the risk of losing everything would be high.
The CRD has been formalized from the evolutionary game theory as a variation of public good game (PGG)
where a threshold must be achieved to produce the public good26. In addition, a certain risk of losing a big part
of the remaining endowment of every participant is assumed in case of the threshold is not achieved20,21,27. Sev-
eral general findings in this kind of games have been revealed in previous studies. For example, Wang et al. find
that increasing risk levels of big loss favors cooperation20. In the CRD models, players are organized in groups
of a certain size and the game is restricted to every group. In general, the studies show that the group size works
against cooperation in the sense that achieving threshold is more difficult for large groups21. Larger groups are
harder to coordinate because of their overall lower success f requencies22. These general results are found in the
subsequent CRD models proposed in the last decade.
Other contributions extend previous models by including the role of punishment institutions. Pacheco et al.
find that local institutions (those restricted to participants in every group) are more efficient to promote coopera-
tion than global i nstitutions23. Following this line, the optimal combination of punishment and reward policies
was analyzed i n28, whereas the effect of different tax and fine strategies was studied by Couto et al.29. The latter
contribution finds that a graduated punishment/tax strategy enhances global cooperation rates more than having
a fixed amount. Other interesting factors analyzed in the previous literature are the role of m igration30 and the
31
timing of the contribution of every participant . Recently, the classical CRD model framework has been extended
by defining two environmental states (prosperous and degraded) which evolve and interact to each o ther32. The
general results agree with previous findings and extend them by analyzing the effect of time preferences and
Scientific Reports | (2021) 11:5043 | https://doi.org/10.1038/s41598-021-84604-z 2
Vol:.(1234567890)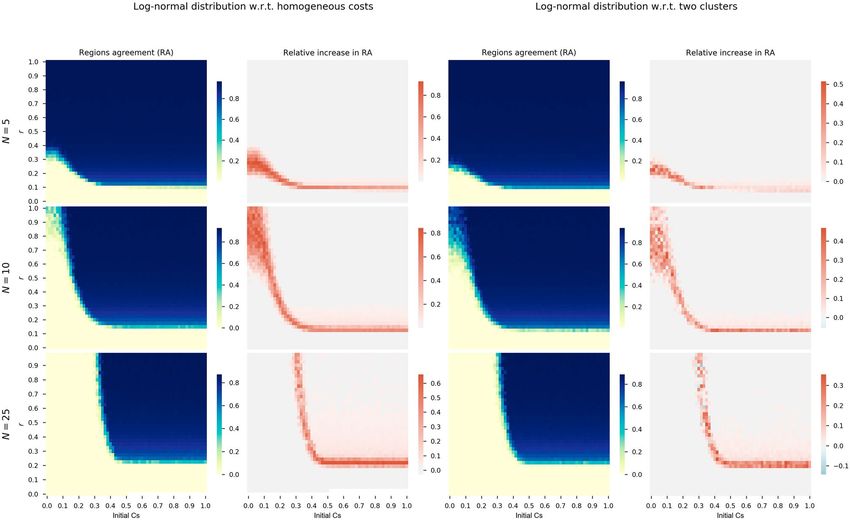
www.nature.com/scientificreports/
magnitude of collapse. Finally, behavioral studies showed that the best mechanisms to avoid collective risks
depend on an interaction between behavioral type, communication, and t iming22.
Previous contributions have analyzed the role of heterogeneity in CRD models from different points of view.
For example, Santos et al. analyze how cooperation arises in PGG with heterogeneous social network structures33.
Results point that cooperation is favored in scale-free structures with respect to homogeneous regular graphs. As
it is the case in this paper, several previous contributions assume different types of participants in the CRD. Spe-
cifically, Wang et al. include the effect of wealth inequality in n participants in games with infinite population and
a fixed contribution per participant34 . The main conclusion is that rich contributors con sustain cooperation level
above threshold. Abou Chakra and Traulsen assume two different types of contributors (rich and poor) in a CRD
model with two rounds, where the rich ones can contribute with two different positive amounts every round35.
The results show a strategic behavior of poor contributors who mostly cooperate once the rich contributors have
contributed in the first round. Vasconcelos et al. also propose a model with two types of participants (rich and
poor) with dissimilar contributions36. The main result is that wealth inequality enhances global cooperation if
players revise strategies from comparison with any other player, but this is not the case if players only take into
account players belonging to her/his own type when revising strategies. The impact on how groups are formed
in a game with heterogeneous players has not been analyzed in the CRD relevant literature yet.
Methods
Model definition and groups of regions. The proposed CRD model is formed by a finite set of Z players
which represent the regions that make decisions about adopting or not public health recommendations. Each
player i chooses, at every time step t, a strategy s from two possibilities ( s(i) = {C, D}): being a cooperator, which
means assuming the restrictions and public health recommendations (C), or being a defector and ignore those
recommendations (D). Thus, regions adopting a cooperation strategy C will suffer from a direct drop in their
income from tourism and free mobility conditions.
The model also includes, as in previous CRDs, a risk parameter r ∈ [0, 1] for a global disaster. This risk means
falling in a global lock-down for the members of the group because of the high incidence of the COVID-19 for
the regions of the group. Note again that the goal of the proposed model is not the virus contagion modeling
and the collective risk is a critical epidemiological situation for the regions and therefore, an economic collapse
for the regions involved. This risk value r also measures the difficulty of the social dilemma. Lower values of r
correspond to less perceived risk for the public health and economic collapse and therefore, cooperation becomes
more difficult.
Players of the population make agreements and cooperate in invariable groups of size N which represent
groups of regions (i.e., inside a country or within an international alliances or international work-groups). By
default in CRDs, these groups are formed at r andom36 but we will investigate the role and heterogeneity of the
groups’ formation in the experiments of this work. A group of regions or players is successful when its number
of cooperators achieves a minimum threshold, defined by a ratio m ∈ [0, 1]. The number of cooperators in a
group k, denoted by C k , must be equal or greater than mN for a group of regions to be successful and obtain an
agreement that implement the COVID-19 restrictions to prevent the economic breakdown. We call this achieve-
ment, for all the formed groups, as regions’ agreement ( RA ∈ [0, 1]). RA is the ratio of groups which obtain the
required number of cooperators and will be the performance cooperation indicator for the model during our
experimental analysis.
When a region cooperates and restricts mobility, tourism activity critically stops and the income losses from
these restrictions occur in the region. These losses or costs for a cooperating region i are denoted by ci ∈ [0, 1].
The dependence of regions to tourism is heterogeneous and thus, this cost ci in our evolutionary model is higher
for tourism dependent regions. If a region is fully dependent on tourism, its income will be zero when the region
adopts the public health restrictions and thus, its cost ci is set to 1 (i.e., its initial tourism endowment is totally
lost). When a region i is not cooperating to the common good to stop the spread of the disease (i.e., a free rider
with strategy D), its cost is set to 0.
The payoff wi of a region or player i depends on its strategy s(i) at the last time step within its group. If
s(i) = D , then the payoff of region i, belonging to a group k, is given by wi = D (see Equation 1). N stands for
the size of the group, C k is the number of the cooperators in the group k, and m is the minimum ratio of coop-
erators in the group to achieve the regions’ agreement. �(x) is a Heaviside function returning 1 when x ≥ 0, 0
otherwise. If the region is cooperating for its group k (i.e., s(i) = C ), then the region pays a cost ci for adopting
the public health restrictions. The payoff of a cooperating region i is wi = C = D − ci . As previously stated,
the cost ci is different for each player as it depends on the tourism dependency of each region.
�D = �(C k − mN) + (1 − r)[1 − �(C k − mN)]. (1)
Evolutionary dynamics. After playing the game and calculating their payoffs at every time step t, the
regions or players can update their strategies according to the payoffs received from its invariable group. Regions
(players) then decide which strategy to choose based on the strategies followed by other regions of the popula-
tion in the previous time step (i.e., t − 1) and their own payoff37. The strategy update follows an evolutionary
procedure based on the imitation in a well-mixed population. It means a given region or player i can imitate any
other region from the population, even from other groups, but this region i plays the coordination game with
the same group of regions for all the time steps of the simulation. This process can be seen as a social learning
process38 to build the collective behavior of the population39.
We have considered the Fermi function as the evolutionary update rule, which is applied synchronously.
The Fermi rule is a stochastic pairwise comparison rule, where regions or players can make mistakes during
Scientific Reports | (2021) 11:5043 | https://doi.org/10.1038/s41598-021-84604-z 3
Vol.:(0123456789)
www.nature.com/scientificreports/
Figure 1. Map showing the EU NUTS2 regions colored by their tourism dependence. Regions in blue are those
with the highest tourism dependence while regions in orange have the lowest tourism dependence. If tourism
information is not available, the region is colored in gray. Source: Eurostat.
the imitation process. This means that a region can copy the strategy of another region having a worse payoff.
Mathematically, a region i having strategy X adopts strategy Y of region j (randomly selected from the population)
with a probability given by Equation 2. β is the intensity of selection parameter, set to 0.5 in all the experiments
of this work. Additionally, players can also change their strategies by adopting a strategy at random, following a
mutation mechanism with probability µ equals to 0.01, as done in other CRDs36,40.
1
probi (Y ) = . (2)
−β(wjt−1 −wit−1 )
1+e
EU NUTS2 real data and model setup. We feed the heterogeneous costs of the regions of the model by
taking into account the real context of the EU regions. We use the EU NUTS2 classification41, defined as “basic
regions for the application of regional policies” which is precisely the interest of this research. This classifica-
tion includes 312 administrative regions in Europe (see Fig. 1 where the reader can see these regions within
their respective countries). Most of the well-known tourist regions in Europe are defined through this NUTS2
classification (e.g., Canary Islands, Sicily, Tuscany, Algarve and Tirol, among others). In many European coun-
tries, these NUTS2 regions are responsible for their health and tourism policies. In fact, EU countries such as
Germany, Spain, Belgium, and Italy are among the five most decentralized countries in the world, together with
USA42.
We have collected data from the EU NUTS2 classification with respect to nights spent at tourist accommoda-
tion establishments per inhabitant. This data is used to set the ci values of the model as these values represent a
measure of the economic costs when a lock-down and/or restrictions are applied for tourism-dependent regions.
Scientific Reports | (2021) 11:5043 | https://doi.org/10.1038/s41598-021-84604-z 4
Vol:.(1234567890)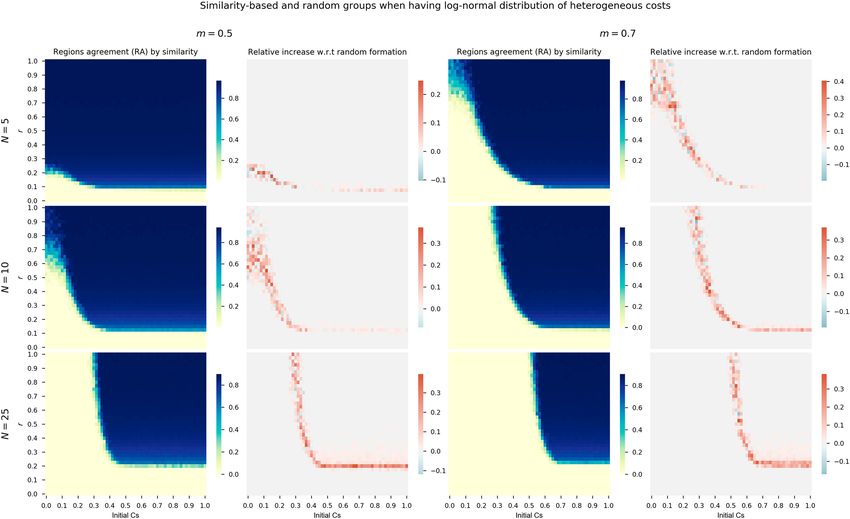
www.nature.com/scientificreports/
Figure 2. Cumulative distribution of the real costs for the 312 regions of the EU NUTS2 (circles). Blue solid
line represent the fitted log-normal distribution and red dashed line the fitted exponential distribution. The
vertical line α = 0.04 divides the regions in two clusters: non tourism-dependent and tourism-dependent.
As can be seen in the map of Fig. 1, regions have a diverse tourism-dependence for all the countries (groups). We
have generated two clusters of regions by taking into account the number of night stays per inhabitant for each
region. We set a cut-off value of 4 ( α = 0.04), meaning that regions with a ratio of more than 4 night stays per
inhabitant were considered as tourism-dependent while those with a ratio of less than 4 were considered non-
dependent. The cut-off value of 4 was set since it splits the regions in two clusters: 20% of dependent having more
than 4 stays per inhabitant and 80% of non-dependent with less than 4 stays. The cluster of tourism-dependent
regions has an averaged cost of c T = 0.158. In contrast, the cluster of non tourism-dependent regions has an
averaged cost of c NT = 0.013. The averaged cost value of all the regions of the data is ĉ = 0.04.
An exponential and log-normal distributions are fitted to the real costs data of the NUTS2 regions. Figure 2
shows the histogram of the real costs data c, a vertical dotted line for the α = 0.04 cut-off to generate two clusters
of tourism dependent and non-dependent regions, and the two fitted distributions. The first is a fitted exponential
distribution c ∼ Exp( ), shown in the figure as a red dashed line, with = 24.30. The second is a fitted log-normal
distribution ln(c) ∼ N (µ, σ 2 ), shown in the figure as a blue solid line, with parameters µ = −4.39 and σ = 1.63.
For the experimental study we run the model for 30 independent Monte-Carlo (MC) realizations and
Z = 3, 000 players to have robust results but when applying the model to the real NUTS2 case study we use
Z = 312. The model is fed with heterogeneous costs from the fitted distributions. When using two clusters of
regions, tourism dependent and non-dependent, having costs c T = 0.158 for 20% of the regions and c NT = 0.013
for the remaining 80% for them. Finally, we use a homogeneous cost of ĉ = ci = 0.04, ∀i , which is the averaged
cost of all the regions of the distribution.
The simulation results were obtained by averaging the last 25% of the simulation time steps in the independ-
ent MC runs. Finally, each model is run for 200 time steps, where all the realizations reach a stationary stable
state and deviation from the MC realizations is low, as seen in Fig. 3. In this plot we see the evolution of the
model for Z = 3, 000 players, m = 0.5, groups assigned at random of size N = 5 and r = 0.5 and N = 25 with
r = 0.1. We see how stationary state is reached easily for all the instances of models having heterogeneous costs
generated by exponential and log-normal distributions and two clusters of regions (i.e., tourism dependent and
non-dependent).
Analysis of the results
The analysis starts by comparing the dynamics’ difference and levels of cooperation when using heterogeneous
costs with respect to two clusters of regions and homogeneous costs. Later, the analysis focuses on the groups
formation where we compare the impact of grouping regions with similar costs on cooperation. Finally, we show
the application of the model to the real case of 312 NUTS2 regions with their real heterogeneous costs.
Scientific Reports | (2021) 11:5043 | https://doi.org/10.1038/s41598-021-84604-z 5
Vol.:(0123456789)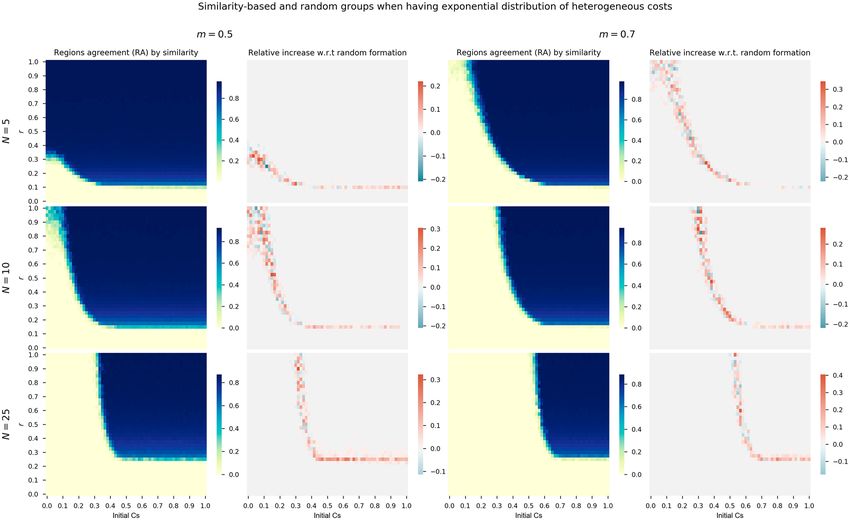
www.nature.com/scientificreports/

                                            Figure 3.  Evolution of the tourism dilemma using heterogeneous costs for the regions (players) for different
                                            risk r values and group sizes for 200 time steps. The solid line is the average of the MC runs and the semi-
                                            transparent region denotes the maximum and minimum values obtained in these 30 MC runs.

                                            Impact of considering heterogeneity in the regions’ tourism costs. The goal here is to see coop-
                                            eration differences when introducing heterogeneous costs for regions when applying public health restrictions
                                            for the common good of their groups. Then, we compare three different model specifications for costs while
                                            maintaining the rest of the model’s parameters. First, we run the model with heterogeneous costs ci following a
                                            log-normal distribution, fitted to the real NUTS2 regions’ data. Second, we use the two clusters of regions with
                                            two costs values, distinguishing them by tourism dependent and non-dependent. Third, we assume that all
                                            the regions are cooperating, and that the cost for all of them is an average global cost. For all the scenarios, the
                                            groups formation is done at random and for three group sizes N.
                                                Figure 4 shows a panel of pairs of heatmaps with a double comparison. Each pair of heatmaps has a first one
                                            showing the regions’ agreement (RA) of the heterogeneous version of the model and a second one, ranging from
                                            white to red colors, with a relative increase with respect to the second and third scenario. The first two columns
                                            compare the heterogeneous costs generated by a log-normal distribution fitted to the real NUTS2 tourism data
                                            with respect to having the same cost for all the regions (an averaged cost of ĉ = 0.04 ). The third and fourth
                                            columns of the panel show the comparison between the generated log-normal distribution costs with respect to
                                            two groups of regions (20% of tourism dependents with a cost of c T = 0.158 and 80% of non-dependents with
                                            a cost of c NT = 0.013). The heatmaps are built from a sensitivity analysis on the initial number of cooperators
                                            (x-axis) and risk parameter r (y-axis). Finally, we also investigate three different groups sizes ( N = 5 in the first
                                            row, N = 10 in the second row, and N = 25 in the third row).
                                                First and third columns show heatmaps of absolute regions’ agreement (RA) when considering equal global
                                            costs and two groups of regions, respectively. The second column shows relative RA differences when using log-
                                            normal distribution costs with respect to equal costs for all the regions. Fourth column shows heatmaps with
                                            relative RA differences of log-normal distribution costs with respect to two groups of regions.
                                                We observe from the heatmaps that results are not equivalent when considering homogeneous, two-clusters,
                                            and heterogeneous costs. Even if the homogeneous and two-clusters versions of the model come from averag-
                                            ing the real costs, differences are clear. For all the group sizes, initial cooperation conditions, and level of risk,
                                            cooperation and therefore, RA is clearly higher when considering heterogeneous costs. The RA obtained with
                                            heterogeneous costs is at least 30% higher than when using equal costs for all the regions in the transition phase
                                            from null cooperation (light yellow areas) to high cooperation (blue areas of the heatmaps). There is also a RA
                                            increase in the high cooperation area although of a lower value.
                                                In the case of comparing against two differentiated groups of regions with two different cooperation costs, the
                                            increase in RA is also significant if we introduce a heterogeneous costs distribution. Again, the results are robust
                                            for all the group sizes, initial conditions, and levels of risk. The higher increase is observed in the transition area

          Scientific Reports |   (2021) 11:5043 |                https://doi.org/10.1038/s41598-021-84604-z                                                      6

Vol:.(1234567890)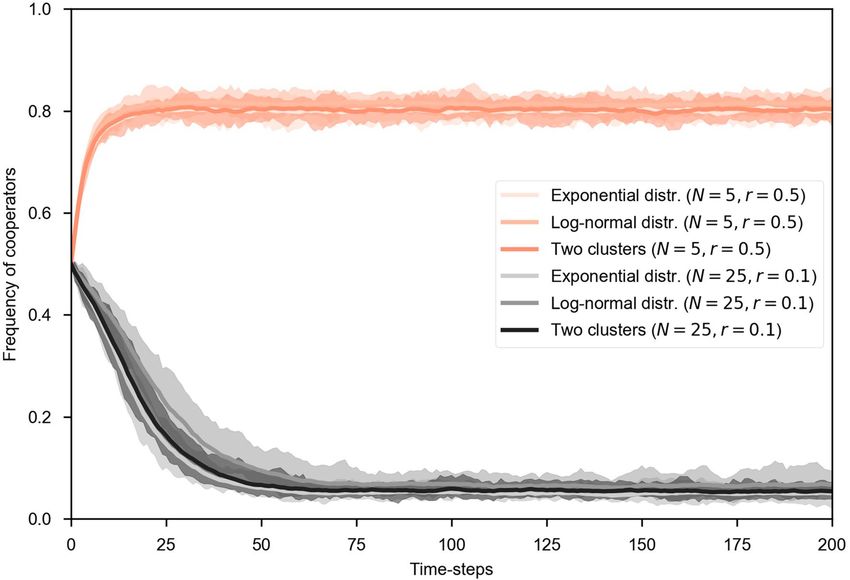
www.nature.com/scientificreports/
Figure 4. First and third columns show heatmaps of absolute RA when considering equal global costs and
two groups of regions, respectively. The second column shows relative RA differences when using log-normal
distribution costs with respect to equal costs for all the regions. Fourth column shows heatmaps with relative RA
differences of log-normal distribution costs with respect to two clusters of regions. Each row of the panel shows
results for different group sizes (N) and m = 0.5.
although there is a less significant increase beyond this transition and towards the cooperation zone (i.e., high
number of initial cooperators and high risk values).
Different group sizes does not affect the increase in the RA for the heterogeneous version of the model which
is invariant for all the N values. However, we see how increasing the group of players or regions is more difficult
for promoting cooperation. In view of the results of Fig. 4, there is a shift of the transition area from null to high
cooperation when increasing the group size. This transition phase is also thinner when increasing the group
size (compare for instance N = 5 and N = 25 in the relative increase heatmaps). This behavior is expected from
previous similar CRD s tudies36.
Group formation by similarity and at random. In this section we inspect an important decision when
organizing regions in groups for increasing their cooperation and agreement. By default in CRDs, regions or
players are homogeneous and they are normally assigned to groups at random, as also done in the previous sec-
tion. However, given the heterogeneity of the regions or players in terms of cooperating costs because of their
different dependence to tourism, this set of experiments evaluates if grouping regions by similar cooperation
costs ci increases cooperation and RA.
In order to answer this question we launch sensitivity analysis for the initial cooperation conditions and
risk levels for different group sizes and minimum threshold for agreement m, similarly to the experiments of
the previous section. We compare the RA relative increase of grouping regions with similar costs (i.e., tourism
dependence) with respect to a grouping at random. This analysis is performed for costs generated by the fitted
exponential distribution in panel of Fig. 5, log-normal distribution in panel of Fig. 6, and also for the two clusters
of regions configuration in the panel of Fig. 7.
The panel of heatmaps for the exponential distribution of Fig. 5 and log-normal distribution of Fig. 6 show
similar behaviors. First, the levels of RA of the heatmaps of the first and third columns are very similar between
both distributions. As observed in the previous section, the cooperation area in blue shrinks as the group size
N becomes higher. Similar behaviors are also observed for m = 0.5 (first group of two columns) and m = 0.7
(second group of two columns) for both distributions, with narrower cooperation areas (heatmaps’ cells in blue)
when the minimum ratio m is 0.7.
If we focus the analysis on the second and fourth columns of the both panels, where the relative increase
with respect to random formation is depicted, we see how there is an increase in cooperation when regions are
assigned to groups based on similarity in terms of costs. Although there is some variability and negative increases,
mainly with high risk levels, the general picture is of a RA increase.
Scientific Reports | (2021) 11:5043 | https://doi.org/10.1038/s41598-021-84604-z 7
Vol.:(0123456789)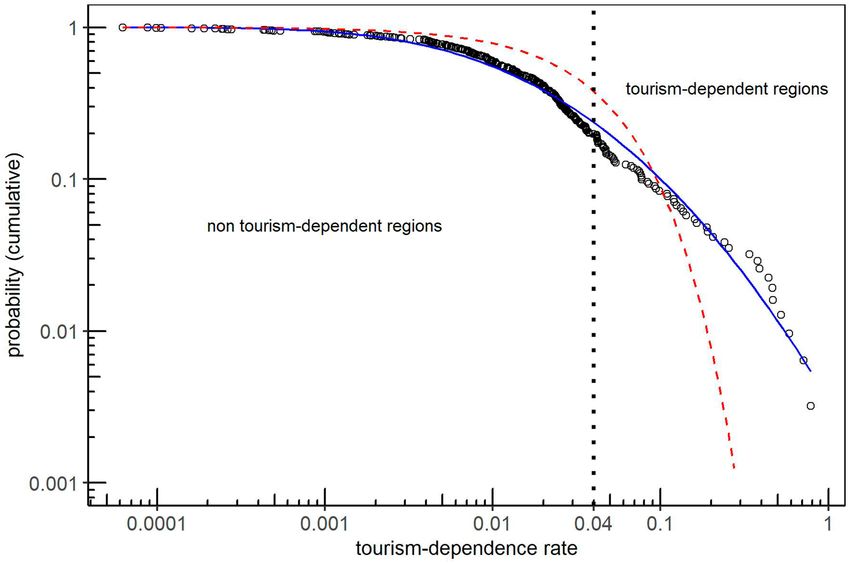
www.nature.com/scientificreports/

                                            Figure 5.  First and third columns show heatmaps of absolute RA when considering exponential distribution
                                            costs and grouping regions at random for thresholds m = 0.5 and m = 0.7. The second and fourth columns
                                            show relative RA differences when using exponential distribution costs and grouping by similarity with respect
                                            to random groups.

                                                We also performed the same analysis but for the two clusters configuration to compare its results with the
                                            continuous distributions of costs. Panel of Fig. 7 shows the same matrix of heatmaps than for the exponential
                                            and log-normal distributions. The results are also similar to the previous cases. There is an increase in RA levels
                                            when grouping regions by similar costs with respect to a random assignment. Better cooperation results apply
                                            to the three studied group sizes N (each row of the panel), for the two m values, and for the whole range of initial
                                            cooperators and risk levels. Therefore, we can conclude that the benefits of disposing regions or players in this
                                            CRD by similarity in their groups facilitate the RA both with heterogeneous real costs and two clusters of tour-
                                            ism dependent and non-dependent.

                                            Application to the real EU NUTS2 case. In this last section of the experimental study, the direct NUTS2
                                            regions of the EU are used to feed the model. The configuration implies having Z = 312 players with groups of
                                            N = 6, N = 12, and N = 24, and two minimum threshold of cooperation, m for 50% of the members and 70%
                                            of them. The costs ci for the 312 players are directly obtained from the NUTS2 tourist night stays per inhabitant
                                            data, from 0 to 1. Panel of Fig. 8 shows the heatmaps for the real case study comparing the grouping by similarity
                                            and its relative increase with respect to a random formation. Two first columns are for m = 0.5 while the last two
                                            columns correspond to m = 0.7 Each row of the panel corresponds to a group size (N). As done in the previous
                                            section, we evaluate all the possible initial fraction of cooperators and risk levels defined by the r parameter.
                                                Similar trends to the ones observed for the case of 3000 players can be seen although the variability both in the
                                            relative increase and RA of the similarity groups configuration is higher. In the lower part of the transition phase
                                            of the heatmaps, where r is low, the relative increase is always positive. When the r values increase, the variability
                                            is higher. In the blue area of the heatmaps, where RA is high, the formation by similarity also obtains a regular
                                            positive increase, although with lower values. To sum up, this real case study confirms that grouping by similar-
                                            ity achieves higher RA and cooperation, despite the higher variability given by the lower number of regions.

                                            Final discussion
                                            A convenient management of lock-downs and mobility restrictions of the countries and regions in a COVID-19
                                            context is crucial for both public health and affected economic sectors such as tourism. Therefore, it is important
                                            for regions to cooperate for the common good to achieve an agreement. This is the reason why we proposed here
                                            an evolutionary game model based on a well-known subset of PGGs, namely the collective risk dilemma (CRD),
                                            to model the affected regions’ cooperation to avoid the collective economic collapse. This collapse comes from
                                            an uncontrolled virus spread that would end in strict confinements and negligible tourist income. The presented
                                            model is the first to consider the CRD framework for the economic problem of tourism restrictions because of

          Scientific Reports |   (2021) 11:5043 |                https://doi.org/10.1038/s41598-021-84604-z                                                     8

Vol:.(1234567890)
www.nature.com/scientificreports/
Figure 6. First and third columns show heatmaps of absolute RA when considering log-normal distribution
costs and grouping regions at random for thresholds m = 0.5 and m = 0.7. The second and fourth columns
show relative RA differences when using log-normal distribution costs and grouping by similarity with respect
to random groups.
the COVID-19 pandemic. EU NUTS2 regions are used as an inspiration for the modeling and their data is used
to enrich the study.
The regions are the players of the CRD and are grouped for obtaining regions’ agreements when the number
of cooperators achieve a minimum threshold. Our proposed evolutionary game theory model employs a cost
for regions when they cooperate because of their mobility and tourism restrictions. This cost is directly linked
to their tourism dependence and, given their heterogeneity among the regions, these costs are heterogeneous in
the model. The regions or players in the model follow an evolutionary update rule to change their strategy based
on the payoffs obtained in their groups.
The experiments were first focused on observing how heterogeneity in the costs for cooperating regions
increase the cooperation, and therefore the regions’ agreement (RA) for all the evaluated conditions. Based on the
EU NUTS2 real data, we consider three ways of cost heterogeneity: a) two clusters of regions with equal costs, b)
a log-normal continuous distribution of costs, and c) an exponential distribution of costs. The use of continuous
distributions of heterogeneous costs makes the analytical treatment of the model impractical. On the contrary,
the agent-based simulation allows studying the model outcomes for a large spectrum of initial conditions and
values of parameters. As expected, major differences in the RA by assuming heterogeneous costs are observed
in the transition phase of the initial conditions between two extreme stable cooperation values, although there is
also a cooperation increase for high levels of final cooperation. The simplification of using two different clusters
of regions reduces the final cooperation with respect to having a continuous distribution of heterogeneous costs
(both exponential and log-normal). Previous works considered different groups of players36 but our results show
that, in terms of costs, a complete heterogeneity in the cooperation costs are valuable and also facilitates the
final cooperation. Nevertheless, our results confirm previous findings such as a positive effect on cooperation
by increasing risk levels of collective failure and low number of players in the groups. As done in previous CRD
models21,34,36, the final stable cooperation levels depend on the initial cooperation of the players and the most
frequent final cooperation rates are either null or high.
Second and more importantly for decision makers, we studied whether the initial formation of the groups of
regions affects the cooperation and RA. We conducted a set of experiments using the above-mentioned settings of
heterogeneous costs for different initial conditions, risk levels, groups sizes, and minimum thresholds for group
Scientific Reports | (2021) 11:5043 | https://doi.org/10.1038/s41598-021-84604-z 9
Vol.:(0123456789)www.nature.com/scientificreports/
Figure 7. First and third columns show heatmaps of absolute RA when considering two clusters of regions
(α = 0.04) and grouping regions at random for thresholds m = 0.5 and m = 0.7. The second and fourth
columns show relative RA differences when using two clusters of regions grouped by similarity with respect to
random groups.
agreement. The application of the model to a more reduced set of players to mimic the real case of NUTS2 312
regions was also tested in our experimental study. The variability of the results is higher than in the synthetic
experiment but their dynamics are equivalent. Differences in the results with respect to the experimental case
with a larger population (i.e., 3, 000 players) points to the effect of low and finite population in the cooperation
levels, as it was shown in previous analytical s tudies27.
The conclusion is that a group formation by similarity (i.e., regions with similar tourism-dependence are
placed in the same groups) enhances the cooperation among the regions and our main cooperation indicator,
RA, if we compare it with a traditional random formation. Again, the most significant differences in RAs are
observed in the transition phase of the initial conditions between two extreme stable cooperation values. This
final conclusion of the present research can be helpful for policy makers. Although the European Union was
formed almost 30 years ago, there is still a trend for each country to consider itself relatively independent when
it comes to policy making. However, in a global and challenging crisis like the current one, our results show that
all regions will much better off by cooperating. Surprisingly enough, the best case scenario of this cooperation
takes place between regions that have a similar dependence on tourism. For instance, high tourism-dependent
regions (e.g., Canary Islands, Ionian Islands, Sicily, Algarve, Tirol) should cooperate together even if they belong
to different countries and sometimes have a direct competition in attracting tourists.
This work represents the first CRD for modeling lock-downs and mobility restrictions under the COVID-19
context albeit presents some limitations. The model does not include side-effects for defecting regions when
their flow of tourists are reduced because of the restrictions in the regions from which they receive tourists.
Even if a tourism-dependent region does not follow any restrictions and is open to tourism, the drop in their
touristic numbers will be significant because other regions have a limited mobility. Spatial information was not
included in the model but it could enrich it by adding distances and/or in-out touristic flows among regions.
Future works can include social networks or spatial lattices to take into account the latter effects. Additionally,
punishment and reward policies can be injected into the model to see the effects on the final cooperation levels.
And finally, analytical studies of a more simplified version of the model can also help towards the mathematical
comprehension of the obtained outcomes and dynamics.
Scientific Reports | (2021) 11:5043 | https://doi.org/10.1038/s41598-021-84604-z 10
Vol:.(1234567890)www.nature.com/scientificreports/
Figure 8. First and third columns show heatmaps of absolute RA when considering the real data from the 312
NUTS2 regions, grouped at random for thresholds m = 0.5 and m = 0.7. The second and fourth columns show
relative RA differences when grouping by similarity with respect to random groups.
Received: 2 February 2021; Accepted: 18 February 2021
References
1. Worldometers. Covid-19 coronavirus pandemic. Accessed 21 January 2021. https://www.worldometers.info/coronavirus/ (2021).
2. European Commission. Autumn 2020 economic forecast: rebound interrupted as resurgence of pandemic deepens uncertainty.
Accessed 21 January 2021. https://ec.europa.eu/commission/presscorner/detail/en/ip_20_2021 (2020).
3. European Commission. Economic performance by country. Accessed 21 January 2021. https://ec.europa.eu/info/business-econo
my-euro/economic-performance-and-forecasts/economic-performance-countr y_en (n.d.).
4. World Economic Forum. The travel & tourism competitiveness index 2019. Accessed 21 January 2021. http://report s.weforu m.org/
travel-and-tourism-competitiveness-report-2019/files/2019/09/OVERALL-RESULTS.pdf (2019).
5. Council, W.T. Economic impact reports. Accessed 21 January 2021. https://wttc.org/Research/Economic-Impact (2020).
6. Fernandes, N. Economic effects of coronavirus outbreak (covid-19) on the world economy. SSRN 3557504 (2020).
7. Padhi, A. et al. Studying the effect of lockdown using epidemiological modelling of covid-19 and a quantum computational
approach using the Ising spin interaction. Sci. Rep. 10, 1–14 (2020).
8. Haug, N. et al. Ranking the effectiveness of worldwide covid-19 government interventions. Nat. Hum. Behav. 4, 1303–1312 (2020).
9. Soltesz, K. et al. The effect of interventions on covid-19. Nature 588, E26–E28 (2020).
10. Svoboda, J., Tkadlec, J., Pavlogiannis, A., Chatterjee, K. & Nowak, M. A. Infection dynamics of covid-19 virus under lockdown
and reopening. arXiv preprint 2012.15155 (2020).
11. Chang, S. et al. Mobility network models of covid-19 explain inequities and inform reopening. Nature 589, 1–6 (2020).
12. UNWTO. Covid-19 travel restrictions. Accessed 21 January 2021. https: //www.unwto. org/news/covid- 19-travel -restri ction
s (2020).
13. Qiu, R. T., Park, J., Li, S. & Song, H. Social costs of tourism during the covid-19 pandemic. Ann. Tour. Res. 84, 102994 (2020).
14. Altuntas, F. & Gok, M. S. The effect of covid-19 pandemic on domestic tourism: a dematel method analysis on quarantine decisions.
Int. J. Hosp. Manag. 92, 102719 (2020).
15. Škare, M., Soriano, D. R. & Porada-Rochoń, M. Impact of covid-19 on the travel and tourism industry. Technol. Forecast. Soc.
Change 163, 120469 (2020).
16. Leiper, N. The framework of tourism: towards a definition of tourism, tourist, and the tourist industry. Ann. Tour. Res. 6, 390–407
(1979).
17. Lepp, A. & Gibson, H. Tourist roles, perceived risk and international tourism. Ann. Tour. Res. 30, 606–624 (2003).
18. Aubrecht, P., Essink, J., Kovac, M. & Vandenberghe, A.-S. Centralized and decentralized responses to COVID-19 in federal systems:
US and EU comparisons. SSRN Electron. J. https://doi.org/10.2139/ssrn.3584182 (2020).
19. Milinski, M., Sommerfeld, R. D., Krambeck, H. J., Reed, F. A. & Marotzke, J. The collective-risk social dilemma and the preven-
tion of simulated dangerous climate change. Proc. Natl. Acad. Sci. USA 105, 2291–2294. https://doi.org/10.1073/pnas.0709546105
(2008).
20. Wang, J., Fu, F., Wu, T. & Wang, L. Emergence of social cooperation in threshold public goods games with collective risk. Phys.
Rev. E - Stat. Nonlinear Soft Matter Phys. 80, 1–11. https://doi.org/10.1103/PhysRevE.80.016101 (2009).
Scientific Reports | (2021) 11:5043 | https://doi.org/10.1038/s41598-021-84604-z 11
Vol.:(0123456789)www.nature.com/scientificreports/
21. Santos, F. C. & Pacheco, J. M. Risk of collective failure provides an escape from the tragedy of the commons. Proc. Natl. Acad. Sci.
USA 108, 10421–10425. https://doi.org/10.1073/pnas.1015648108 (2011).
22. Wang, Z. et al. Communicating sentiment and outlook reverses inaction against collective risks. Proc. Natl. Acad. Sci. 117, 17650–
17655 (2020).
23. Pacheco, J. M., Vasconcelos, V. V. & Santos, F. C. Climate change governance, cooperation and self-organization. Phys. Life Rev.
11, 573–586. https://doi.org/10.1016/j.plrev.2014.02.003 (2014).
24. Union, E. Council recommendation on a coordinated approach to the restriction of free movement in response to the COVID-19
pandemic (press release, 13 October 2020) (2020).
25. Union, E. Council Recommendation amending Council Recommendation (EU) 2020/1475 of 13 October 2020 on a coordinated
approach to the restriction of free movement in response to the COVID-19 pandemic (2021).
26. Pacheco, J. M., Santos, F. C., Souza, M. O. & Skyrms, B. Evolutionary dynamics of collective action in N-person stag hunt dilem-
mas. Proc. R. Soc. B: Biol. Sci. 276, 315–321. https://doi.org/10.1098/rspb.2008.1126 (2009).
27. Santos, F. C., Vasconcelos, V. V., Santos, M. D., Neves, P. N. & Pacheco, J. M. Evolutionary dynamics of climate change under
collective-risk dilemmas. Math. Model. Methods Appl. Sci. 22, 1–20. https://doi.org/10.1142/S0218202511400045 (2012).
28. Góis, A. R., Santos, F. P., Pacheco, J. M. & Santos, F. C. Reward and punishment in climate change dilemmas. Sci. Rep. 9, 1–9. https
://doi.org/10.1038/s41598-019-52524-8 (2019).
29. Couto, M. C., Pacheco, J. M. & Santos, F. C. Governance of risky public goods under graduated punishment. J. Theor. Biol. 505,
110423. https://doi.org/10.1016/j.jtbi.2020.110423 (2020).
30. Chen, X., Szolnoki, A. & Perc, M. Risk-driven migration and the collective-risk social dilemma. Phys. Rev. E - Stat. Nonlinear Soft
Matter Phys. 86, 1–8. https://doi.org/10.1103/PhysRevE.86.036101 (2012).
31. Abou Chakra, M. & Traulsen, A. Evolutionary dynamics of strategic behavior in a collective-risk dilemma. PLoS Comput. Biol. 8,
1–7. https://doi.org/10.1371/journal.pcbi.1002652 (2012).
32. Barfuss, W., Donges, J. F., Vasconcelos, V. V., Kurths, J. & Levin, S. A. Caring for the future can turn tragedy into comedy for long-
term collective action under risk of collapse. Proc. Natl. Acad. Sci. USA 117, 12915–12922. https://doi.org/10.1073/pnas.19165
45117(2020).
33. Santos, F. C., Santos, M. D. & Pacheco, J. M. Social diversity promotes the emergence of cooperation in public goods games. Nat.
454, 213–216. https://doi.org/10.1038/nature06940 (2008).
34. Wang, J., Fu, F. & Wang, L. Effects of heterogeneous wealth distribution on public cooperation with collective risk. Phys. Rev. E -
Stat. Nonlinear Soft Matter Phys. https://doi.org/10.1103/PhysRevE.82.016102 (2010).
35. Abou Chakra, M. & Traulsen, A. Under high stakes and uncertainty the rich should lend the poor a helping hand. J. Theor. Biol.
341, 123–130. https://doi.org/10.1016/j.jtbi.2013.10.004 (2014).
36. Vasconcelos, V. V., Santos, F. C., Pacheco, J. M. & Levin, S. A. Climate policies under wealth inequality. Proc. Natl. Acad. Sci. 111,
2212–2216 (2014).
37. Chica, M., Chiong, R., Ramasco, J. J. & Abbass, H. Effects of update rules on networked n-player trust game dynamics. Commun.
Nonlinear Sci. Numer. Simul. 79, 104870 (2019).
38. Nowak, M. A., Tarnita, C. E. & Antal, T. Evolutionary dynamics in structured populations. Philos. Trans. R. Soc. Lond. B: Biol. Sci.
365, 19–30 (2010).
39. Perc, M. The social physics collective. Sci. Rep. https://doi.org/10.1038/s41598-019-53300-4 (2019).
40. Vasconcelos, V. V., Santos, F. C. & Pacheco, J. M. A bottom-up institutional approach to cooperative governance of risky commons.
Nat. Clim. Change 3, 797 (2013).
41. Eurostat. Nights spent at tourist accommodation establishments by nuts 2 regions. Accessed 21 January 2021. https://ec.europ
a.eu/eurostat/web/products-datasets/-/tgs00111 (2020).
42. Schakel, A. H., Danailova, A., Gein, I. & Hegewald, S. Final report on updating the regional authority index (rai) for 45 countries
(2010–2016) (2018).
Acknowledgements
This work is jointly supported by the Spanish Ministry of Science, Andalusian Government, ERDF and University
of Las Palmas de Gran Canaria under grants EXASOCO (PGC2018-101216-B-I00), SIMARK (P18-TP-4475),
AIMAR (A-TIC-284-UGR18), and COVID-19-04.
Author contributions
M.C., J. H., and J. B. discussed and formulated the evolutionary model as well as analyzed the results. M.C. and
J.H. conceived the experiments. M.C. programmed, conducted the experiments, and plotted the results. All
authors wrote and reviewed the manuscript.
Competing interests
The authors declare no competing interests.
Additional information
Correspondence and requests for materials should be addressed to M.C.
Reprints and permissions information is available at www.nature.com/reprints.
Publisher’s note Springer Nature remains neutral with regard to jurisdictional claims in published maps and
institutional affiliations.
Open Access This article is licensed under a Creative Commons Attribution 4.0 International
License, which permits use, sharing, adaptation, distribution and reproduction in any medium or
format, as long as you give appropriate credit to the original author(s) and the source, provide a link to the
Creative Commons licence, and indicate if changes were made. The images or other third party material in this
article are included in the article’s Creative Commons licence, unless indicated otherwise in a credit line to the
material. If material is not included in the article’s Creative Commons licence and your intended use is not
permitted by statutory regulation or exceeds the permitted use, you will need to obtain permission directly from
the copyright holder. To view a copy of this licence, visit http://creativecommons.org/licenses/by/4.0/.
© The Author(s) 2021
Scientific Reports | (2021) 11:5043 | https://doi.org/10.1038/s41598-021-84604-z 12
Vol:.(1234567890)You can also read