Context-dependent group size choice in fish
←
→
Page content transcription
If your browser does not render page correctly, please read the page content below
ANIMAL BEHAVIOUR, 2004, 67, 155e164
                                                           doi:10.1016/j.anbehav.2003.04.004

                        Context-dependent group size choice in fish

                                  D. J. HO ARE*, I. D. C OUZ I N*†, J . -G . J. G ODIN ‡ & J . K RA US E*
                                         *Department of Biology, University of Leeds
                            yDepartment of Ecology and Evolutionary Biology, Princeton University
                                  zDepartment of Biology, Mount Allison University, Canada

                                       (Received 24 April 2002; initial acceptance 17 June 2002;
                                           final acceptance 4 April 2003; MS. number: 7303)

        The costs and benefits of group membership vary with the size of groups, and individuals are expected to
        modify their choice of groups in response to ecological factors such as food availability and predation risk.
        We experimentally examined context-dependent group size choice in a shoaling fish, the banded killifish,
        Fundulus diaphanus, by using nondirectional odour cues to simulate a food source or a successful attack by
        a predator (food or alarm treatments) in the laboratory. Group sizes were significantly smaller in the food
        treatment and larger in the alarm treatment than in control trials. When presented with food and alarm
        cues together, fish formed groups that were larger than control groups but smaller than those seen with
        alarm cues alone. These results are consistent with theoretical predictions based on the known benefits and
        costs of grouping and with previous laboratory work examining the individual shoal choice behaviour of
        single fish. To examine possible mechanisms of group formation, we developed an individual-based model
        of shoaling behaviour in which simulated fish were allowed to modify the area over which they interacted
        with neighbouring individuals. Group size distributions produced by the model were a good approxi-
        mation of our experimental data. We suggest that local behavioural interaction rules of this type are a
        potential mechanism by which fish may individually adjust grouping behaviour without requiring exten-
        sive information on the position and movement of all possible shoalmates.
                                           Ó 2004 The Association for the Study of Animal Behaviour. Published by Elsevier Ltd. All rights reserved.

For group-living animals, individual fitness varies as a                        Helfman 1991; Ashley et al. 1993; Krause & Godin 1994a;
function of group size, so that individual group choice                        Svensson et al. 2000). In these studies, an individual fish
reflects a dynamic trade-off between the costs and benefits                      was presented with a simple binary choice of associating
of membership (Pulliam & Caraco 1984). Typically, com-                         with one of two stimulus shoals which were restrained in
petition for resources increases, whereas predation risk                       tanks or bottles, so that the group sizes available were
and certain foraging costs decrease with increasing group                      controlled by the experimenter. These observations reveal
size (Alexander 1974). This trade-off has been extensively                     the ‘ideal’ choices of individual fish, and are consistent
investigated for shoaling fish (Pitcher & Parrish 1993), in                     with the concept that individuals join larger groups to
which changes in both shoal size and composition may be                        benefit from reduced predation risk (Godin 1986, 1997;
common under natural conditions (Pitcher et al. 1996;                          Magurran 1990; Pitcher & Parrish 1993).
Mackinson et al. 1999; Krause et al. 2000; Svensson et al.                        By definition, however, natural group sizes reflect the
2000), providing the opportunity for individuals to use                        behaviour of all group members, and it is not always easy
shoaling behaviour as a flexible strategy in response to                        to predict how individual membership decisions interact
changes in environmental conditions or internal state.                         to produce stable outcomes. Predicted ‘optimal’ group
   Laboratory studies have shown that individual fish                           sizes, for example, are generally exceeded because solitary
generally prefer to join the larger of two available groups,                   individuals continue to join (Sibly 1983; Pulliam & Caraco
and that these preferences are stronger when perceived                         1984). It is thus important to ask what group sizes are
predation risk is high (e.g. Keenleyside 1955; Hager &                         actually observed when all individuals are free to make
                                                                               membership decisions, although few studies have exam-
Correspondence: J. Krause, Department of Biology, University of Leeds,
Leeds LS2 9JT, U.K. (email: jens.krause@leeds.ac.uk). I. D. Couzin is
                                                                               ined such free choice situations (but see Pitcher et al.
now at the Department of Ecology and Evolutionary Biology, Princeton           1983).
University, Princeton, NJ 08540, U.S.A. J.-G. J. Godin is now at the              We examined group size choice in the banded killifish,
Faculty of Science, Carleton University, 1125 Colonel By Drive,                Fundulus diaphanus (see Fig. 1), when individuals were free
Ottawa, ON K1S 5B6, Canada.                                                    to join and leave shoals. We tested whether frequency
                                                                        155
0003e3472/03/$30.00/0                               Ó 2004 The Association for the Study of Animal Behaviour. Published by Elsevier Ltd. All rights reserved.
156 ANIMAL BEHAVIOUR, 67, 1
distributions of observed group sizes were context specific, it to investigate context-specific group size changes in
and investigated the relative importance of perceived food general.
availability and predation risk in determining group size.
Fish were subjected to four experimental treatments:
EXPERIMENTAL SHOALS
food; alarm; food + alarm; and control. We used odour
cues to simulate the presence of food or a potential pre- Methods
datory threat without any directional information, thus
avoiding aggregations resulting simply from fish moving Several hundred juvenile banded killifish were collected
towards or away from a particular location in the tank. under permit (from the Department of Fisheries and
Food odour was used to simulate the presence of food Oceans, Canada) from the littoral zone of Morice Lake
without direct competition for the resource itself. We sim- (near Sackville, New Brunswick, Canada: 45(55#N,
ulated increased predation risk in the form of a successful 64(21#W) in September 1995 using a 5-m beach seine. Fish
predatory attack by adding a killifish skin extract to the were maintained in a fibreglass tank (200!200 cm and
water to evoke an alarm response in the test fish. Many 15 cm high) supplied with flowing well water (18e20 (C)
aquatic organisms show antipredator behaviour in re- and exposed to overhead fluorescent lighting on a 12:12 h
sponse to chemical cues from potential predators or from light:dark cycle for approximately 1 month prior to testing.
injured prey (reviewed in Chivers & Smith 1998; Kats & They were fed freeze-dried chironomids ad libitum twice
Dill 1998). Preliminary trials showed that adding killifish daily. Experiments were conducted in a Plexiglas tank
skin extract to the water caused a fright reaction in con- (100!100 cm and 15 cm high, water depth 10 cm),
specifics, and thus functioned as an effective alarm cue for surrounded by a blind of black plastic sheets to minimize
the purposes of this study. external disturbance.
No odour cues were added in the control treatment, We conducted six replicate trials for each of four
which provided a reference point of normal activity in the experimental treatments: (1) Food: food odour plus water;
experimental arena. We predicted that groups should be (2) Alarm: killifish skin extract plus water; (3) Food +
smaller on average in the food treatment than in the Alarm: food odour plus skin extract plus water; (4) Control:
control treatment (as fish try to reduce potential com- water only. For each trial, we obtained skin extract by
petition), and larger in the alarm treatment than in the dissecting off the skin of a single freshly killed killifish
control (as fish seek to reduce per capita predation risk). (total body length 40 mm) and crushing the skin with
We also predicted that group sizes among fish in the a pestle and mortar (von Frisch 1942). This crushed skin
combined food + alarm treatment, with potentially con- was then sieved through filter paper to remove large par-
flicting cues, were likely to be intermediate between the ticles and mixed with 300 ml of well water to yield an ex-
group sizes formed with either cue alone. tract of a concentration similar to that of the Schreckstoff
The mechanisms underlying the interactions of indi- alarm substance used by von Frisch (1942). Skin extract
viduals during group choice are still poorly understood. was kept refrigerated and used within 24 h of preparation.
Increasingly, however, social group dynamics have been For each trial, we produced food odour by crushing
considered to arise from an interplay between ‘social approximately 200 mg of dried chironomid larvae (the
forces’, such as attraction, alignment and repulsion, which food fish were usually given, see above) with a pestle and
regulate interindividual distances (reviewed by Warburton mortar. This was then sieved through filter paper to
1997). Individual-based simulations have been used to remove large particles and mixed with 300 ml of well
examine how local interactions between neighbouring water. In treatment 3, food odour and skin extract were
individuals based on such a ‘balance of forces’ model mixed in 300 ml of well water, and unmanipulated well
(Breder 1954) can give rise to group level properties such water (300 ml) was used as a control.
as overall structure and movement (e.g. Okubo 1986; To record trials, we used a video camera mounted above
Huth & Wissel 1994; Parrish & Turchin 1997; Beecham & the centre of the tank. Fish were not fed for 2 h before
Farnsworth 1999). We present a simple agent-based model the trial started. For each trial, 10 fish were haphazardly
in which individuals adjust their position within a group selected from the holding tank, but were size matched to
using a simple behavioural rule based on local interactions within 5 mm within each trial to avoid association biases
with neighbours. At the mechanistic level, apparent pre- caused by body length (Krause & Godin 1994a; Hoare
dation risk and food availability are expected to result in et al. 2000). Overall, the total body length of test fish
changes in the interindividual distances that fish main- ranged from 35 to 45 mm. For each trial, the 10 test fish
tain. For example, fish increase nearest-neighbour dis- were introduced together into the centre of the experi-
tances when hungry (Morgan 1988; Robinson & Pitcher mental tank and left overnight to acclimate.
1989a, b) and increase shoal cohesion, positioning them- We filled a water vaporizer with 300 ml of well water
selves closer to other individuals, when perceived pre- containing the test substance and sprayed it five times (in
dation risk is high (Magurran & Pitcher 1987; Krause total about 5 ml) evenly on to the water surface from above
1993a). We used a balance-of-forces model, in which the tank. Spraying was done from outside the test tank so
individual fish vary the range over which they interact that fish could not perceive any overhead movement
with others, to investigate whether such a mechanism can during the procedure. Pilot trials using water dyed with
explain the grouping patterns of killifish observed in our Alcyon Blue showed that the sprayed fluid spread evenly on
experiment. We did not specify the functional cause of the water surface and thus did not produce differences in
changes in interaction range within our model, as we used fluid concentrations within the test tank. We began trialsHOARE ET AL.: GROUP SIZE IN FISH 157
when the treatment cue was sprayed over the tank, and Results
stopped them after 60 min of recording. At the end of a trial,
the test fish were removed, placed in a separate holding Grouping behaviour, measured in terms of the median
tank, and not reused in subsequent trials. We then emptied group size observed, varied markedly between the four
the experimental tank, scrubbed it and flushed it with well treatments (Fig. 1). Group size in all three odour cue
water for several hours to remove any residual odours. treatments was significantly different from that of the
Experiments were carried out between 0900 and 1700 hours control treatment (two-tailed ManneWhitney U test: con-
and trial order was randomized. trol versus food: U ¼ 0, N1 ¼ 6, N2 ¼ 4, P ¼ 0:01; control
We collected data on group size from the video record- versus alarm: U ¼ 0, N1 ¼ N2 ¼ 6, P ¼ 0:004; control ver-
ings. The size of all groups was recorded every 30 s, sus food + alarm: U ¼ 1, N1 ¼ N2 ¼ 6, P ¼ 0:01). As pre-
beginning 30 s after the introduction of the treatment dicted, median group size was smallest in the food
substance. We considered two fish to be part of the same treatment and largest in the alarm treatment (Fig. 1).
group if they were within four body lengths of each other The combined treatment of both food and alarm stimuli
(16 cm, measured from the head). This distance falls produced an intermediate response, with the median
within the range of interindividual distances observed in group size falling between that of the control trials and
natural fish shoals (Pitcher & Parrish 1993) and is those with the alarm cue alone.
a criterion previously used for defining group size in Frequency distributions of the median group size
laboratory experiments (Pitcher et al. 1983). Since shoals observed across all replicate trials (Fig. 2) confirm the
were largely two-dimensional in the shallow experimental general pattern of results described above. In the control
tank, we did not consider distances between fish in the treatment, small groups were most common and large
third dimension in the analysis. A trial lasted 60 min, thus groups of five or more fish relatively rare. When food
yielding 120 data points. We conducted six replicate trials odour was added to the tank, solitary fish became much
of each treatment, although two trials were lost because of more common and the distribution was more strongly
damaged recordings. As a consequence, the number of skewed to the left, indicating that larger groups separated.
replicates was unbalanced across treatments, and non- In contrast, adding killifish skin extract in the alarm
parametric statistics were used in the analyses. We used treatment resulted in fish forming large groups; although
ManneWhitney U tests to test for a priori predicted small groups of one or two were still relatively common,
differences in the median group size between each of the the majority of individuals occurred in groups of 10, as
three odour cue treatments and the control treatment. The indicated by the distribution of individuals across groups
mean group size observed was calculated for each 30-s of each size (Fig. 2d). This highlights the need to examine
time interval (because group sizes are not independent the shoal choice of individuals rather than simply
within each observation), and the median of these values counting group sizes. Fish responded to the food + alarm
was calculated for each replicate trial separately. treatment in an intermediate manner compared with the
single-odour treatments. Small groups were most frequent,
Ethical note with 50% of observations involving groups of two or less,
To produce the skin extract for the alarm treatment, six but individuals were evenly distributed between large and
individuals were killed by a single hard blow to the head small groups (Fig. 2c).
and the head was crushed before we dissected off the skin.
We did not use chemical methods (e.g. MS 222) to kill the
subjects to avoid possible confounding odour cues in the MODELLING SHOALING BEHAVIOUR
subsequent experiment. All other fish were released at
Methods
their site of capture at the end of the experimental period
(after several months in captivity), and as banded killifish Following the approach of Aoki (1982) and Huth &
are abundant at the study site (Hoare et al. 2000) the loss Wissel (1994), we simulated the behaviour of individuals
of six individuals does not represent any significant effect as resulting from ‘repulsion’, ‘alignment’ and ‘attraction’
on the population.
General observations indicated that increased shoal size
and shoal cohesion were the primary behavioural re- 10
sponses to the alarm treatment (see Results), and we used
8
a nondirectional alarm stimulus to avoid directional
Group size
escape responses. No fish in this or other treatments 6
showed ‘freezing’ behaviour or violent escape movements
4
such as attempts to escape the experimental tank. Free-
swimming killifish shoals at this site are frequently accom- 2
panied at close range for prolonged periods, and attacked,
by predatory yellow perch, Perca flavescens, and respond 0
Food Control Food + Alarm
primarily through shoaling interactions with conspecifics Alarm
(personal observation). We are thus confident that this Treatment
treatment did not represent an unusually high level of Figure 1. Median group size observed in each treatment. Vertical
threat and simulated a heightened predation risk without lines indicate quartiles; where quartiles do not appear they are
causing undue distress to the subjects. identical to the median value.158 ANIMAL BEHAVIOUR, 67, 1
(a)
80 80
70 Food 70 Food
60 60
50 50
40 40
30 30
20 20
10 10
0 0
1 2 3 4 5 6 7 8 9 10 1 2 3 4 5 6 7 8 9 10
(b)
80 80
70 Control 70 Control
60 60
50 50
40 40
Percentage frequency of groups
30 30
Percentage of individuals
20 20
10 10
0 0
1 2 3 4 5 6 7 8 9 10 1 2 3 4 5 6 7 8 9 10
(c)
80 80
Food + Alarm Food + Alarm
70 70
60 60
50 50
40 40
30 30
20 20
10 10
0 0
1 2 3 4 5 6 7 8 9 10 1 2 3 4 5 6 7 8 9 10
(d)
80 80
70 Alarm 70 Alarm
60 60
50 50
40 40
30 30
20 20
10 10
0 0
1 2 3 4 5 6 7 8 9 10 1 2 3 4 5 6 7 8 9 10
Group size
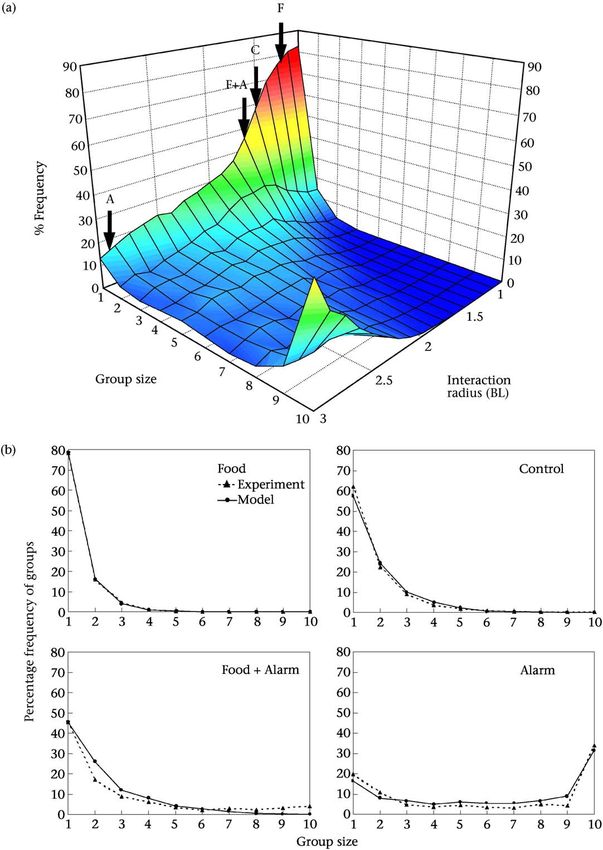
Figure 2. Percentage frequency distributions of killifish group sizes and percentage of individuals occurring in groups of different size in the
four treatments: (a) Food; (b) Control; (c) Food + Alarm; (d) Alarm. Values are the median percentage frequency across all replicate trials.
Vertical lines indicate quartiles. Dotted lines represent the point above which 50% of observations lie.
tendencies based upon the position of individuals relative rules that are intended to characterize generic behavioural
to one another. Vision and lateral line mechanoreception tendencies to approach or avoid other fish.
are thought to be the most important sensory modalities (1) Individuals attempt to maintain a minimum dis-
for coordinating collective movement in fish (Partridge tance d between themselves and other individuals at all
1982; Bleckmann 1993) although the relation between times. This represents the tendency of fish to avoid
perception and movement tendencies is still poorly collisions, and is consistent with interindividual distance
understood. For this reason, individuals in our simulation regulation in real fish schools (Partridge 1982; Huth &
model were accorded the following simple behavioural Wissel 1994; Couzin et al. 2002; Krause & Ruxton 2002).HOARE ET AL.: GROUP SIZE IN FISH 159
This rule is assumed to have the highest priority since rB ðtÞ ci ðtÞ
collisions with neighbours, even during rapid avoidance f B ðtÞ ¼ ð3Þ
KrB ðtÞ ci ðtÞK
manoeuvres, are known to be rare. Furthermore, if they
occur, they may create a localized disturbance that can where rB(t) denotes the location of that point of the
result in individuals becoming misaligned, and therefore border B that lies closest to fish i. The repulsive forces are
prone to predation (Radakov 1973; Partridge 1982). For summed for all borders within distance d of fish i, and this
simplicity, here we assume d is constant. See Couzin et al. cumulative force is normalized, becoming f#B(t). Replacing
(2002) for a similar model in which this parameter is di ðt þ DtÞ with d#i ðt þ DtÞ, the influence of the borders is
varied. incorporated as d#i ðt þ DtÞ ¼ 1=2ðdi ðt þ DtÞ þ f #B ðtÞÞ.
(2) If individuals are not making an avoidance ma- In the eventuality that the social forces result in a zero
noeuvre (1), they tend to be attracted towards and to align vector, then di ðt þ DtÞ ¼ vi ðtÞ.
themselves with neighbours. Individuals respond in this Fish are able to turn through an angle of at most
manner to all other individuals within a local interaction qDt degrees, where q is the maximum turning rate. If the
zone of radius r, which is equal to or larger than the zone angle between vi(t) and di ðt þ DtÞ is less than qDt,
of repulsion. This zone of interaction is variable and then fish i achieves alignment with its desired vector,
subject to changes in grouping motivation. Increasing the vi ðt þ DtÞ ¼ di ðt þ DtÞ; otherwise it turns qDt towards it.
radius (r) of the zone of interaction increases the number All turning is assumed to be subject to slight error. This is
of neighbours to which a fish is attracted, and thus serves simulated by rotating vi ðt þ DtÞ by angle s (a Gaussian-
to increase group cohesion. Conversely, reducing the distributed random deviate centred on 0 with standard
radius of the interaction zone decreases the number of deviation s ¼ 0:1 radians).
near neighbours to which a fish is attracted, effectively This completes the calculation of the new direction
reducing shoal cohesion. vectors. The new position vector of fish i is then given by
(3) Individuals also tend to maintain a minimum ci ðt þ DtÞ ¼ ci ðtÞ þ vi ðt þ DtÞDts, where s is the speed of
distance d between themselves and environmental ob- movement of the fish. Simulated fish have a body length
stacles, such as simulated arena walls in this case. This of 4 cm (Z 1 BL) as in our experimental trials, and other
represents avoidance of collisions with such obstacles. parameters are set accordingly; N ¼ 10, s ¼ 1:25 BL=s
In our model, there are N simulated fish, with individual ( J. Krause, unpublished data), d ¼ 1 BL (Partridge 1982),
i having position vector ci(t) and direction vector vi(t). q ¼ 100(=s (Krause & Tegeder 1994). We investigated the
Fish are simulated in a domain measuring 1 ! 1 m with influence of interaction radius r over the range 1e3 BL.
a reflective boundary.
Time is partitioned into discrete steps t with spacing
Dt ¼ 0:01 s chosen to approximate the response latency of Results
shoaling fish to external stimuli (Partridge & Pitcher
1980). At each time step, the direction vectors and then Five hundred replicate simulations of the model were
the position vectors of all fish are updated in parallel. run for each value of the interaction radius r. For each
The updating of the direction vectors is as follows. If replicate, data on group size were collected at the 5000th
there are other fish j within a distance d of fish i it avoids timestep, by which time group behaviour in the model
them by turning towards a desired vector had reached a dynamically stable state. To assess the spa-
tial distribution of individuals in the model, we used the
X cj ðtÞ ci ðtÞ same criterion (of grouping together fish within four body
di ðt þ DtÞ ¼ : ð1Þ lengths of a neighbour) that was applied to live fish in our
Kcj ðtÞ ci ðtÞK
jsi test tank. The minimum distance ‘personal space’ d re-
mained constant, as this is expected to be a function
If there are no fish within distance d, the individual will of the need to avoid collisions (Partridge 1981, 1982).
respond to fish k within the interaction range r However, we explicitly changed the interaction radius r
within which individuals are attracted to others in the
" #
X vk ðtÞ X ck ðtÞ ci ðtÞ model to explore how this affected group size. Theory
di ðt þ DtÞ ¼ 1=2 þ ð2Þ predicts that increases in food availability may increase
Kvk ðtÞK ksi Kck ðtÞ ci ðtÞK
k¼1 this interaction radius (Morgan 1988) and that increases
in predation risk may decrease it (Krause 1993a), making
where the first term within brackets represents a tendency the model a useful point of comparison with our experi-
to align with neighbours, and the second term within mental data, although we did not explicitly make r a
brackets represents the tendency to be attracted to function of any particular biological factor.
neighbours. Modifying the continuous interaction radius r pro-
If there are no neighbours within distance r, then duced a broad range of group size distributions (Fig. 3a). As
di ðt þ DtÞ ¼ vi ðtÞ. the interaction radius r in the model is increased, the
Fish also attempt to keep a certain minimum distance resultant group size frequency distribution shows a transi-
d from the borders of obstacles: in this case the four tion from left-skewed distributions, in which small groups
edges of the domain. Therefore a border (each domain are very common, to a right-skewed distribution where
edge) B exerts a repulsive effect, which can be de- the most frequent group sizes are large (Fig. 3a). At
scribed by intermediate values of r, the distribution is relatively flat,160 ANIMAL BEHAVIOUR, 67, 1
Figure 3. Percentage frequency distributions of median group sizes in the model, using the 5000th timestep from 500 replicates. (a) Group
size as a function of interaction radius r (measured in body lengths, BL). (b) Vertical slices through the model output. F: r ¼ 1:2 BL; Food
treatment; C: r ¼ 1:5 BL; Control; F + A: r ¼ 1:6 BL; Food + Alarm treatment; A: r ¼ 2:9 BL; Alarm treatment.
as all group sizes are observed, although individuals and predictions of those used by fish in the experimental
pairs are still the most frequent. This transition is in trials. Instead, the model is intended to demonstrate the
the same direction as predicted, and corresponds closely logical consistency of the type of underlying mechanism
to distributions derived from the experimental treat- we propose and to reveal qualitatively how changing
ments (Fig. 3b). Note that values of the interaction radius the interaction radius results in changes in group size
highlighted in the model are not necessarily quantitative distribution.HOARE ET AL.: GROUP SIZE IN FISH 161
DISCUSSION result of group choice and not simply because fish cluster
in a particular area away from an attacking predator. This
Animal group sizes are the result of membership decisions is consistent with binary choice experiments in which
made by all group members. We have shown that freely individual fish show increased preferences for larger
formed group sizes in banded killifish are highly context shoals in the presence of a predatory threat (Hager &
dependent, with fish forming shoals of very different sizes Helfman 1991; Ashley et al. 1993; Krause & Godin 1994a;
in response to nondirectional food or alarm cues. This is Tegeder & Krause 1995). Such a response is unsurprising,
consistent with the group size choices made by individual given that fish in large groups have a reduced per capita
fish in laboratory binary choice tests (e.g. Krause & Godin risk of predation as a result of several mechanisms, in-
1994a), and with theoretical predictions based on the cluding earlier predator detection, numerical dilution of
costs and benefits of grouping. risk and predator confusion during attacks (e.g. Neill &
Although median group size was generally small in the Cullen 1974; Magurran et al. 1985; Morgan & Godin
control treatment, as predicted it was significantly reduced 1985; Godin 1986; Pitcher & Parrish 1993; Krause &
by the presence of a simulated food source. In the food Godin 1995).
treatment, group size decreased to the extent that 60% of Individual fish are expected to trade-off foraging gains
individual fish were found alone at any one time com- and safety from predation in their group membership
pared with 36% alone in the control trials. Our fish were decisions and, when provided with both food and pre-
allowed to acclimatize to the tank conditions overnight, dation risk cues in the food + alarm treatment, median
such that the results of the control treatment probably group sizes were intermediate between those of the single-
reflected relatively low anxiety levels in the absence of cue treatments. In this treatment, fish formed larger groups
external disturbance or predator stimuli. This does not than in either control or food treatments, but smaller
necessarily reflect a ‘normal’ level of grouping behaviour groups than those seen with the alarm treatment alone.
in the wild (where cues from both food and predators are Thus, it appears that fish took greater risks by forming
probably ubiquitous), but provides a reference point of smaller groups when food odour was present, even in the
killifish behaviour under laboratory conditions for com- presence of an alarm stimulus. Fish can integrate multiple
parison with experimental treatments. We predicted that cues regarding predatory threats (Smith & Belk 2001) and
fish would prefer to forage alone or in small groups to it seems likely that killifish in our study displayed a graded,
reduce potential food competition. Although there can be threat-sensitive response (sensu Helfman 1989) to our
foraging benefits associated with grouping (Magurran & nondirectional alarm cue, allowing them to retain some of
Pitcher 1983; Morgan 1988; Ranta & Kaitala 1991), com- the safety benefits of group membership without in-
petition appears to be the major cost of shoal membership curring excessive competition for food.
(Pitcher & Parrish 1993). Fish may respond to this by It is important to note that the observed frequency
changing foraging strategies, for example by reducing distributions of groups and individuals were not identical.
food handling time in larger groups (Street et al. 1984). In Although intuitive, this is not a trivial matter: as natural
binary choice tests, food-deprived fish show reduced pre- selection typically operates at the level of the individual,
ferences for larger shoals, again suggesting that competi- it may be more relevant to our understanding of the evolu-
tion leads fish to avoid large groups when foraging is a tion of group living to ask what the majority of individuals
priority (Krause 1993b; Reebs & Saulnier 1997). Our results do rather than what the commonest group size is. Several
confirm that free-ranging fish choose to form small groups authors examining shoal size in fish have discussed their
or forage singly in a feeding context. Indeed, among small results primarily in terms of the frequency distribution
shoaling species, solitary fish and small groups are com- of group sizes observed (field data: Seghers 1981; Godin
monly seen in the wild (e.g. banded killifish: Godin & & Morgan 1985; Dugatkin & Godin 1992; Bonabeau
Morgan 1985; spottail shiner, Notropis hudsonicus: Seghers & Dagorn 1995; laboratory data: Pitcher et al. 1983;
1981; guppy, Poecilia reticulata: Dugatkin & Godin 1992; Magurran & Pitcher 1987). Here we stress the importance
rainbowfish spp.: Brown 2000), despite a wealth of evi- of considering the distribution of individuals within
dence that individuals are safer in groups. groups: even when large shoals are comparatively rare,
Most strikingly, killifish in our study commonly formed they can contain a sizeable proportion of the population
the largest groups possible when conspecific skin extract and thus reflect the group choice of many individuals.
was added to simulate a successful predatory attack. To our Mechanistically, group level properties such as shoal
knowledge, ours is the first report of chemical cues size are a result of the movement decisions of individuals
eliciting an antipredator response in the banded killifish, (Parrish & Turchin 1997), and understanding such
although Reed (1969) reported alarm responses in the mechanisms is an important step towards understanding
congener Fundulus olivaceus. In our experiment, as how grouping behaviour evolved (Camazine et al. 2001).
predicted, individuals responded to a perceived increase We have presented a model of a possible mechanism
in predation risk by forming larger groups: while some which may underlie shoaling in fish, in which individuals
pairs and singletons persisted, more than 60% of individ- used simple rules-of-thumb to regulate their local inter-
uals observed were in shoals of 10. Similarly, Magurran & actions. By varying the degree to which simulated in-
Pitcher (1987) reported increased shoal size and cohesion dividual fish respond to neighbours (modelled here by
for free-swimming minnows, Phoxinus phoxinus, on de- modifying the range over which interactions take place),
tection of a pike predator. In the present study, however, we showed that such local movement rules are sufficient
we were able to confirm that large groups formed as a to generate realistic patterns of group sizes. The shift in162 ANIMAL BEHAVIOUR, 67, 1
group size distributions from small to large groups in our follow such rules (Parrish & Edelstein-Keshet 1999). Tech-
model was in the same direction as that seen in live nical advances in video equipment and automated
killifish in our experimental treatments. tracking software should make it possible to confirm the
Changes in a number of individual variables, such as functional and mechanistic assumptions of such models,
swimming speed or turning rate, may affect the inter- for example by measuring how interindividual distances
actions between fish and thus also shoal level properties change under controlled conditions and examining
such as group size. We chose to model a modification of correlations in speed and orientation among neighbours.
individual interaction distances as a plausible local mech- Simple individual behavioural rules might allow fish to
anism regulating group behaviour because it facilitates respond rapidly to changes in environmental conditions
manipulation of group size, yet maintains the schooling (for example predator cues: Smith & Belk 2001) or internal
ability of fish, even when group sizes are small. Experi- state (such as hunger or parasitism: Morgan 1988; Krause
mental evidence shows that fish schools can vary in size 1993b; Krause & Godin 1994b), and make shoaling
(Hoare et al. 2000), yet individuals within a school will behaviour a flexible strategy for balancing individual
tend to maintain coordinated behaviour, maintaining trade-offs in the face of limited local information.
close proximity with one another (this may have impor-
tant antipredator benefits, even when group size is small,
Krause & Ruxton 2002). Thus, in our model, as the inter- Acknowledgments
action range is decreased, individuals will form smaller,
We thank Dick James, Paul Bennett and the Ecology and
but still coordinated, groups. This is in contrast to a hypo-
Evolution Group at the University of Leeds for helpful
thetical alternative model in which individuals would
comments and discussions and Herbert Krause for provid-
modify the minimum distance between themselves and
ing a drawing of our study species in Fig. 1. This research
others at all times (in our model formulation this would
was supported by research grants from the Leverhulme
be expressed as keeping r constant while modifying d).
Trust to D.J.H. and J.K. and the Natural Sciences and
In our model, reducing a fish’s local interaction radius
Engineering Research Council of Canada to J.-G.J.G and
(effectively reducing the number of neighbours which an
the Pew Program in Biocomplexity at Princeton University
individual approaches) produces a frequency distribution
to I.D.C.
dominated by small groups and solitary individuals that
is very similar to that seen in our experimental food
treatment. Laboratory studies have shown that individual References
fish increase their distance to shoalmates when hungry
(Keenleyside 1955; Robinson & Pitcher 1989a), illustrating Alexander, R. D. 1974. The evolution of social behaviour. Annual
that local interactions between individuals are modified Review of Ecology and Systematics, 5, 325e383.
by changes in motivational states. Aoki, I. 1982. A simulation study on the schooling mechanism
Fish may increase the range over which they interact in fish. Bulletin of the Japanese Society of Scientific Fisheries, 48,
with neighbours to increase group cohesion under pre- 1081e1088.
dation risk (fish decrease their distance to groupmates Ashley, E. J., Kats, L. B. & Wolfe, J. W. 1993. Balancing trade-offs
between risk and changing shoal size in northern red-belly dace
following predatory threat: Magurran & Pitcher 1987;
(Phoxinus eos). Copeia, 1993, 540e542.
Krause & Tegeder 1994). Increases in the interaction radius
Beecham, J. A. & Farnsworth, K. D. 1999. Animal group forces
(increasing the number of attractive neighbours) in the resulting from predator avoidance and competition minimization.
model resulted in the formation of large groups, in line Journal of Theoretical Biology, 198, 533e548.
with the results of our experimental alarm treatment. Bleckmann, H. 1993. Role of the lateral line in fish behaviour. In:
Individuals in our model do not make explicit decisions Behaviour of Teleost Fishes (Ed. by T. J. Pitcher), pp. 201e246.
about membership of particular groups; instead group sizes London: Chapman & Hall.
result from the set of local interactions made simulta- Bonabeau, E. & Dagorn, L. 1995. Possible universality in the size
neously by all fish. Group size is an emergent property of distribution of fish schools. Physical Review E, 51, R5220eR5223.
the system, and the model uses a self-organizing approach Breder, C. M. 1954. Equations descriptive of fish schools and other
in which individuals use local decision rules that do not animal aggregations. Ecology, 35, 361e370.
require access to global information (Camazine et al. 2001). Brown, C. 2000. The behavioural ecology of predator avoidance
It is unlikely that fish are able to assess potential shoal- in rainbowfish (Melanotaenia spp.). Ph.D. thesis, University of
mates accurately or rapidly over anything other than a Queensland.
limited area once shoals grow large (Hager & Helfman Camazine, S., Deneubourg, J.-L., Franks, N. R., Sneyd, J.,
1991; Tegeder & Krause 1995). Our model suggests that in- Theraulaz, G. & Bonabeau, E. 2001. Self-Organization in Bio-
logical Systems. Princeton, New Jersey: Princeton University Press.
dividuals may be able to alter their group membership by
Chivers, D. P. & Smith, R. J. F. 1998. Chemical alarm signalling
changing their position relative to others based only on
in aquatic predatoreprey systems: a review and prospectus.
local information. Thus, an individual fish does not need Ecoscience, 5, 338e352.
to know the range of possible group sizes available to it, but Couzin, I. D., Krause, J., James, R., Ruxton, G. D. & Franks, N. R.
rather fish create groups of a particular size by behaving in 2002. The collective behaviour of animal groups in three dimen-
a particular manner with respect to their neighbours. sional space. Journal of Theoretical Biology, 218, 1e11.
However, while simple individual rules may generate Dugatkin, L. A. & Godin, J.-G. J. 1992. Predator inspection, shoaling
behaviour patterns similar to those seen in real life, it re- and foraging under predation hazard in the Trinidadian guppy,
mains to be shown to what extent living systems actually Poecilia reticulata. Environmental Biology of Fishes, 34, 265e276.HOARE ET AL.: GROUP SIZE IN FISH 163 von Frisch, K. 1942. Über einen Schreckstoff der Fischhaut und seine Magurran, A. E., Oulton, W. & Pitcher, T. J. 1985. Vigilant biologische Bedeutung. Zeitschrift für Vergleichende Physiologie, 29, behaviour and shoal size in minnows. Zeitschrift für Tierpsychologie, 46e146. 67, 167e178. Godin, J.-G. J. 1986. Antipredator function of shoaling in teleost Morgan, M. J. 1988. The influence of hunger, shoal size and fishes: a selective review. Le Naturaliste Canadien, 113, 241e250. predator presence on foraging in bluntnose minnows. Animal Godin, J.-G. J. 1997. Evading predators. In: Behavioural Ecology of Behaviour, 36, 1317e1322. Teleost Fishes (Ed. by J.-G.J. Godin), pp. 191e236. Oxford: Oxford Morgan, M. J. & Godin, J.-G. J. 1985. Antipredator benefits University Press. of schooling behaviour in a cyprinodontid fish, the banded Godin, J.-G. J. & Morgan, M. J. 1985. Predator avoidance and killifish (Fundulus diaphanus). Zeitschrift für Tierpsychologie, 70, school size in a cyprinodontid fish, the banded killifish (Fundulus 236e246. diaphanus Lesueur). Behavioral Ecology and Sociobiology, 16, Neill, S. R.St J. & Cullen, J. M. 1974. Experiments on whether 105e110. schooling by their prey affects the hunting behaviour of cephalo- Hager, M. C. & Helfman, G. S. 1991. Safety in numbers: shoal size pods and fish predators. Journal of Zoology, 172, 549e569. choice by minnows under predatory threat. Behavioral Ecology Okubo, A. 1986. Dynamical aspects of animal grouping: swarms, and Sociobiology, 29, 271e276. schools, flocks, and herds. Advances in Biophysics, 22, 1e94. Helfman, G. S. 1989. Threat sensitive predator avoidance in Parrish, J. K. & Edelstein-Keshet, L. 1999. Complexity, pattern, and damselfishetrumpetfish interactions. Behavioral Ecology and Socio- evolutionary trade-offs in animal aggregation. Science, 284, 99e101. biology, 24, 47e58. Parrish, J. K. & Turchin, P. 1997. Individual decisions, traffic rules, Hoare, D. J., Ruxton, G. D., Godin, J.-G. J. & Krause, J. 2000. The and emergent pattern in schooling fish. In: Animal Groups in Three social organization of free-ranging fish shoals. Oikos, 89, 546e554. Dimensions (Ed. by J. K. Parrish & W. H. Hamner), pp. 126e142. Huth, A. & Wissel, C. 1994. The simulation of fish schools in com- Cambridge: Cambridge University Press. parison with experimental data. Ecological Modelling, 75, 135e145. Partridge, B. L. 1981. Internal dynamics and the interrelations of Kats, L. B. & Dill, L. M. 1998. The scent of death: chemosensory assess- fish in schools. Journal of Comparative Physiology, 144, 313e325. ment of predation risk by prey animals. Ecoscience, 5, 361e394. Partridge, B. L. 1982. The structure and function of fish schools. Keenleyside, M. H. A. 1955. Some aspects of the schooling Scientific American, 246, 90e99. behaviour of fish. Behaviour, 8, 183e248. Partridge, B. L. & Pitcher, T. J. 1980. The sensory basis of fish Krause, J. 1993a. The effect of ‘Schreckstoff’ on the shoaling schools: relative roles of lateral line and vision. Journal of behaviour of the minnow: a test of Hamilton’s selfish herd theory. Comparative Physiology, 135A, 315e325. Animal Behaviour, 45, 1019e1024. Pitcher, T. J. & Parrish, J. K. 1993. Functions of shoaling behav- Krause, J. 1993b. The influence of hunger on shoal size choice by iour in teleosts. In: Behaviour of Teleost Fishes (Ed. by T. J. Pitcher), three-spined sticklebacks, Gasterosteus aculeatus. Journal of Fish pp. 363e439. London: Chapman & Hall. Biology, 43, 775e780. Pitcher, T. J., Magurran, A. E., Allan, J. R. 1983. Shifts of behaviour Krause, J. & Godin, J.-G. J. 1994a. Shoal choice in the banded with shoal size in cyprinids. Proceedings of the 3rd British Freshwater killifish (Fundulus diaphanus, Teleostei, Cyprinodontidae): effects Fish Conference, 220e228. of predation risk, fish size, species composition and size of shoals. Pitcher, T. J., Misund, O. A., Fernö, A., Totland, B. & Melle, V. Ethology, 98, 128e136. 1996. Adaptive behaviour of herring schools in the Norwegian Sea Krause, J. & Godin, J.-G. J. 1994b. Influence of parasitism on the as revealed by high-resolution sonar. ICES Journal of Marine shoaling behaviour of banded killifish, Fundulus diaphanus. Science, 53, 449e452. Canadian Journal of Zoology, 72, 1775e1779. Pulliam, H. R. & Caraco, T. 1984. Living in groups: is there an Krause, J. & Godin, J.-G. J. 1995. Predator preferences for attacking optimal group size? In: Behavioural Ecology. An Evolutionary particular prey group sizes: consequences for predator hunting Approach (Ed. by J. R. Krebs & N. B. Davies), pp. 122e147. success and prey predation risk. Animal Behaviour, 50, 465e473. Oxford: Blackwell Science. Krause, J. & Ruxton, G. D. 2002. Living in Groups. Oxford: Oxford Radakov, D. 1973. Schooling and Ecology of Fish. New York: J. Wiley. University Press. Ranta, E. & Kaitala, V. 1991. School size affects individual feeding Krause, J. & Tegeder, R. W. 1994. The mechanism of aggregation success in three-spined sticklebacks (Gasterosteus aculeatus L.). behaviour in fish shoals: individuals minimize approach time to Journal of Fish Biology, 39, 733e737. neighbours. Animal Behaviour, 48, 353e359. Reebs, S. G. & Saulnier, N. 1997. The effect of hunger on shoal Krause, J., Hoare, D. J., Croft, D., Lawrence, J., Ward, A., Ruxton, choice in golden shiners (Pisces: Cyprinidae, Notemigonus cryso- G. D., Godin, J.-G. J. & James, R. 2000. Fish shoal composition: leucas. Ethology, 103, 642e652. mechanisms and constraints. Proceedings of the Royal Society of Reed, J. R. 1969. Alarm substances and fright reaction in some fishes London, Series B, 267, 2011e2017. of the southeastern United States. Transactions of the American Mackinson, S., Nøttestad, L., Guenette, S., Pitcher, T., Fisheries Society, 98, 664e668. Misund, O. A. & Fernö, A. 1999. Cross-scale observations on dis- Robinson, C. M. & Pitcher, T. J. 1989a. The effect of hunger and tribution and behavioural dynamics of ocean feeding Norwegian ration level on density, polarization and swimming speed of spring-spawning herring (Clupea harengus L.). ICES Journal of herring (Clupea harengus L.). Journal of Fish Biology, 34, 631e633. Marine Science, 56, 613e626. Robinson, C. M. & Pitcher, T. J. 1989b. Hunger motivation as a Magurran, A. E. 1990. The adaptive significance of schooling as an promoter of different behaviours within a shoal of herring: anti-predator defence in fish. Annales Zoologici Fennici, 27, 51e66. selection for homogeneity in fish shoal? Journal of Fish Biology, Magurran, A. E. & Pitcher, T. J. 1983. Foraging, timidity and shoal 35, 459e460. size in minnows and goldfish. Behavioral Ecology and Sociobiology, Seghers, B. H. 1981. Facultative schooling behavior in the spottail 12, 142e152. shiner (Notropis hudsonicus): possible costs and benefits. Environ- Magurran, A. E. & Pitcher, T. J. 1987. Provenance, shoal size and mental Biology of Fishes, 6, 21e24. the sociobiology of predator-evasion behaviour in minnow shoals. Sibly, R. M. 1983. Optimal group size is unstable. Animal Behaviour, Proceedings of the Royal Society of London, Series B, 229, 439e465. 31, 947e948.
164   ANIMAL BEHAVIOUR, 67, 1

      Smith, M. E. & Belk, M. C. 2001. Risk assessment in western            Tegeder, R. W. & Krause, J. 1995. Density-dependence and
        mosquitofish (Gambusia affinis): do multiple cues have additive        numerosity in fright stimulated aggregation behaviour of shoal-
        effects? Behavioral Ecology and Sociobiology, 51, 101e107.             ing fish. Philosophical Transactions of the Royal Society of London,
      Street, N. G., Magurran, A. E. & Pitcher, T. J. 1984. The effects of     Series B, 350, 381e390.
        increasing shoal size on handling time in goldfish Carassius         Warburton, K. 1997. Social forces in animal congregations:
        auratus. Journal of Fish Biology, 25, 561e566.                         interactive, motivational, and sensory aspects. In: Animal
      Svensson, P. A., Barber, I. & Forsgren, E. 2000. Shoaling behaviour      Groups in Three Dimensions (Ed. by J. K. Parrish & W. H.
        of the two-spotted goby. Journal of Fish Biology, 56, 1477e1487.       Hamner), pp. 313e336. Cambridge: Cambridge University Press.
You can also read