Enlarged adipocytes from subcutaneous vs. visceral adipose tissue differentially contribute to metabolic dysfunction and atherogenic risk of ...
←
→
Page content transcription
If your browser does not render page correctly, please read the page content below
www.nature.com/scientificreports

                OPEN              Enlarged adipocytes
                                  from subcutaneous vs. visceral
                                  adipose tissue differentially
                                  contribute to metabolic
                                  dysfunction and atherogenic risk
                                  of patients with obesity
                                  Juan Antonio Suárez‑Cuenca1,2*, Gustavo De La Peña‑Sosa1,10,
                                  Karen De La Vega‑Moreno1,10, Diana Zaineff Banderas‑Lares1,10,
                                  Moisés Salamanca‑García3,10, José Enrique Martínez‑Hernández1,10, Eduardo Vera‑Gómez1,10,
                                  Alejandro Hernández‑Patricio1,10, Carlos Ramiro Zamora‑Alemán1,10,
                                  Gabriela Alexandra Domínguez‑Pérez1,10, Atzín Suá Ruíz‑Hernández1,10,
                                  Juan Ariel Gutiérrez‑Buendía1, Alberto Melchor‑López4, Moisés Ortíz‑Fernández5,10,
                                  Jesús Montoya‑Ramírez5,10, Omar Felipe Gaytán‑Fuentes5,10, Angélica Toríz‑Ortíz6,10,
                                  Mario Osorio‑Valero6,10, Julita Orozco‑Vázquez6, Sofía Lizeth Alcaráz‑Estrada7,
                                  Martha Eunice Rodríguez‑Arellano8, Brenda Maldonado‑Arriaga1,
                                  Rebeca Pérez‑Cabeza de Vaca9, Mónica Escamilla‑Tilch9, Juan Antonio Pineda‑Juárez9,
                                  Mario Antonio Téllez‑González9, Silvia García1 & Paul Mondragón‑Terán9

                                  Morphological characteristics and source of adipose tissue as well as adipokines may increase
                                  cardiometabolic risk. This study aimed to explore whether adipose tissue characteristics may
                                  impact metabolic and atherogenic risks. Subcutaneous Adipose Tissue (SAT), Visceral Adipose
                                  Tissue (VAT) and peripheral blood were obtained from obese patients submitted to bariatric surgery.
                                  Adipose tissue (morphometry), plasma adiponectin, TNF-α, resistin (multiplexing) and biochemical
                                  chemistry were analyzed; as well as endothelial dysfunction (Flow Mediated Dilation, FMD) and
                                  atherogenesis (Carotid Intima Media Thickness, CIMT). Subgroups divided by adipocyte size and
                                  source were compared; as well as correlation and multivariate analysis. Sixty patients 36.6%

                                  1
                                   Laboratory of Experimental Metabolism and Clinical Research, Division of Research, Department of Clinical
                                  Research, Centro Médico Nacional “20 de Noviembre”, ISSSTE, 502, San Lorenzo, Colonia Del Valle, Delegación
                                  Benito Juárez, 03100 Mexico City, Mexico. 2Internal Medicine Department, H.G.Z. No. 58 “Manuel Ávila Camacho”,
                                  IMSS, and Hospital General “Xoco” SS CDMX, 03340 Mexico City, Mexico. 3Pathology Department, Centro
                                  Médico Nacional “20 de Noviembre”, ISSSTE, 03104 Mexico City, Mexico. 4Internal Medicine Department,
                                  H.G.Z. No. 8 “Gilberto Flores Izquierdo”, IMSS and Hospital General “Xoco” SS CDMX, 03340 Mexico City,
                                  Mexico. 5Bariatric Surgery Department, Centro Médico Nacional “20 de Noviembre”, ISSSTE, 03100 Mexico City,
                                  Mexico. 6Diagnostic Imaging Department, Centro Médico Nacional “20 de Noviembre”, ISSSTE, 03100 Mexico City,
                                  Mexico. 7Laboratorio de Medicina Genómica, Centro Médico Nacional “20 de Noviembre”, ISSSTE, 03100 Mexico
                                  City, Mexico. 8Laboratorio de Medicina Genómica, Hospital Regional “Lic, Adolfo López Mateos”, ISSSTE, Mexico
                                  City, Mexico. 9Coordination of Research and Tissue Engineering & Regenerative Medicine Research Group, Centro
                                  Médico Nacional “20 de Noviembre”, ISSSTE, 03100 Mexico City, Mexico. 10These authors contributed equally:
                                  Gustavo De La Peña-Sosa, Karen De La Vega-Moreno, Diana Zaineff Banderas-Lares, Moisés Salamanca-García,
                                  José Enrique Martínez-Hernández, Eduardo Vera-Gómez, Alejandro Hernández-Patricio, Carlos Ramiro
                                  Zamora-Alemán, Gabriela Alexandra Domínguez-Pérez, Atzín Suá Ruíz-Hernández, Moisés Ortíz-Fernández, Jesús
                                  Montoya-Ramírez, Omar Felipe Gaytán-Fuentes, Angélica Toríz-Ortíz, Mario Osorio-Valero. *email: suarej05@
                                  gmail.com

Scientific Reports |   (2021) 11:1831                | https://doi.org/10.1038/s41598-021-81289-2                                             1

                                                                                                                                          Vol.:(0123456789)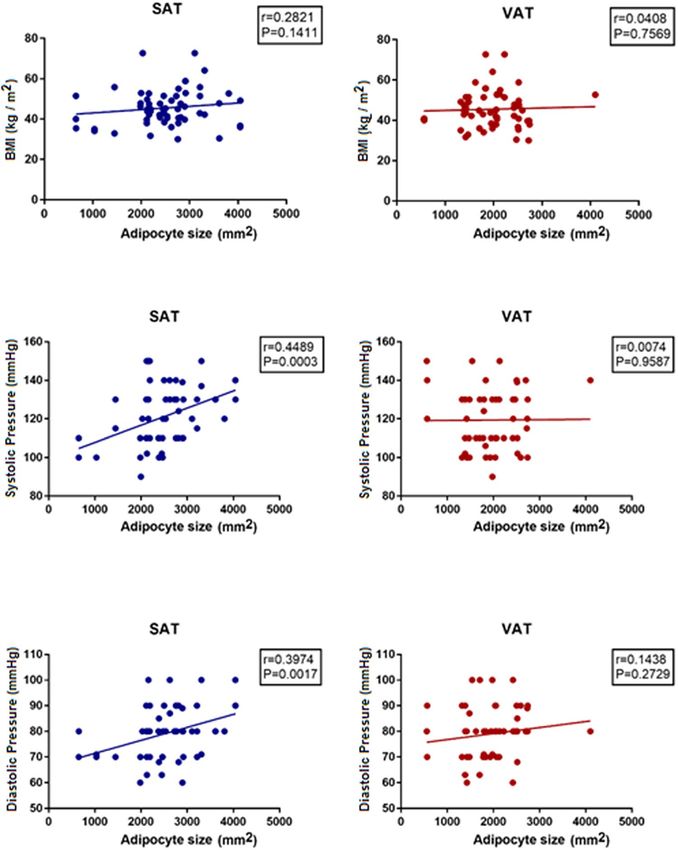
www.nature.com/scientificreports/
males, aged 44 years-old, BMI 46.7 kg/m2 were included. SAT’s adipocytes showed a lower range of
size expandability than VAT’s adipocytes. Independent from their source, larger adipocytes were
associated with higher glucose, lower adiponectin and higher CIMT. Particularly, larger adipocytes
from SAT were associated with higher blood pressure, lower insulin and HDL-cholesterol; and showed
positive correlation with glucose, HbA1c, systolic/diastolic values, and negatively correlated with
insulin and adiponectin. VAT’s larger adipocytes particularly associated with lower resistin and lower
FMD values. Gender and Diabetes Mellitus significantly impacted the relation of adipocyte size/source
with the metabolic and atherogenic risk. Multivariable analysis suggested hypertension-resistin-
HbA1c interactions associated with SAT’s larger adipocytes; whereas potential insulin-adiponectin
associations were observed for VAT’s larger adipocytes. Adipocyte morphology and source are
differentially related with cardiometabolic and atherogenic risk in population with obesity, which are
potentially affected by gender and Diabetes Mellitus.
Overweight and obesity show an increasing prevalence in Western countries1 which is relevant due to the relation
with co-morbidities such as cardiovascular risk (CVR), apnea–hypopnea syndrome, type 2 Diabetes Mellitus
(t2DM), non-alcoholic fatty liver disease and certain types of c ancer2,3.
The precise mechanisms underlying organ damage in subjects with obesity have not been fully described.
Nevertheless, obesity’s CVR has been related to low grade inflammation and subclinical vascular damage. In the
other hand, adipose tissue represents a good candidate with potential mechanisms for a key role during CVR
in obesity. Adipose tissue constitutes the main site of storage for excessive energy derived from food intake4,5,
and nowadays, adipose tissue is recognized as an endocrine organ, which secretes many peptide hormones and
cytokines “adipokines”, owning pro-inflammatory and pro-atherogenic p roperties6–8. Likewise, visceral adipose
tissue (VAT) has been characterized as a predominantly pro-inflammatory tissue; and has been more associ-
ated with a higher risk for t2DM, hypertension and dyslipidemia than subcutaneous adipose tissue (SAT)5,9–11.
Adipocyte remodeling has been related with specific endocrine and cardiometabolic profiles5,8,12. Experimen-
tal data from murine models suggest that adipose tissue expandability and/or adipocyte size are associated with
insulin resistance, even in the absence of pro-inflammatory c onditions9, whereas adipose tissue cell size, lipid
turnover and adipocytes differentiation have been shown to affect metabolic function and C VR13,14. Similar find-
ings regarding morphological/metabolic characteristics of adipose tissue and their relation with cardiometabolic
disease have been observed in human studies15–20.
Nevertheless, controversial observations about the metabolic meaning of adipose tissue morphology have
raised some questions; such as whether adipocyte´s size might predict metabolic health, or how small vs large
adipocytes differentially contribute to metabolic dysfunction. Enlarged adipocytes are usually related to metabolic
dysfunction, whereas small adipocytes are associated with metabolic b enefits15,16,20; however, paradoxical data
have been reported in murine models: (1) adipocyte enlargement observed in S NTB2−/− deficient mice correlates
with post-prandial reduced serum glucose, glycerol and lower hepatic t riglycerides21; while adipocyte hypertro-
phy in both, S NTB2−/− and Collagen 6 deficient mice enables a normal or improved insulin s ensitivity21,22; (2)
small adipocytes described in the X ylt2−/− deficient lipodystrophic mice associates with a metabolic profile of
glucose intolerance, insulin resistance and increased serum triglycerides, as well as inflammatory infiltration of
adipose tissue and higher expression of pro-inflammatory m ediators23. Similarly, increased proportion of small
adipocytes in mesenteric fat tissue is related to increased body weight, higher fat mass and decreased insulin
sensitivity in the mice model of letrozole-induced polycystic ovary s yndrome24; and (3) non-significant effect
of adipocyte size on metabolic dysfunction has been suggested by data from murine DLK1-induced decrease
in adipocyte s ize25. Some of these controversial observations have been replicated in human studies: (1) very
small adipocytes have been associated with metabolic dysfunction, reflected by impaired adipogenesis, increased
expression of pro-inflammatory cytokines and decreased expression of genes that regulate adipose tissue fatty
acid storage26–28; (2) small SAT adipocytes are predominant in subjects during overfeeding29, and subjects with
adipose distribution of metabolic risk30,31; and (3) lack of association between the diameter of larger adipocytes
with insulin-resistance26. In fact, adipocyte size resulted lower predictive of metabolic risk profile than fat mass
and body fat distribution in a study c ohort32.
These controversial findings regarding metabolic implications of adipocyte size suggest that there could be
additional factors potentially interacting, where adipose tissue source, adipokines and/or cell differentiation may
play a critical role for metabolic dysfunction and C VR25,33,34.
Whether pathophysiological mechanisms including adipose mass expandability, adipocyte hypertrophy, sub-
cutaneous vs visceral source of adipocytes and/or adipokine production, are related to CVR remain unclear. A
comprehensive characterization of the adipose tissue morphology, fat tissue source and adipokines may be useful
for better understanding of the role of adipose tissue in metabolic health/dysfunction and CVR. Therefore, the
present study aimed to explore the role of morphological-biochemical as well as the source of adipocyte, impact
on the metabolic and atherogenic risk in population with obesity.
Results
The study population was constituted by 60 patients with obesity, mean aged 44 years old, 36.6% male, mean BMI
46.7 kg/m2, and two thirds of them met criteria for metabolic syndrome (MS) according to NCEP/ATP III, as
well as biochemical evidence of insulin resistance evidenced by plasma glucose, HbA1c and HOMA-IR (Table 1).
Scientific Reports | (2021) 11:1831 | https://doi.org/10.1038/s41598-021-81289-2 2
Vol:.(1234567890)
www.nature.com/scientificreports/
Age (years old) 44.2 ± 9.5
Female n (%) 38 (63)
Weight (kg) 124.0 ± 22.3
Height (m) 1.63 ± 0.07
BMI (kg/m2) 46.7 ± 8.6
Waist circumference (cm) 135.3 ± 15.8
Systolic blood pressure (mmHg) 123.8 ± 13.4
Diastolic blood pressure (mmHg) 79.4 ± 9.8
Glucose (mg/dL) 106.8 ± 24.0
HbA1c (%) 5.9 ± 0.6
Insulin (mUI/mL) 33.7 ± 26.2
HOMA-IR 8.9 ± 7.7
Total Cholesterol (mg/dL) 175.9 ± 39.1
HDLc (mg/dL) 44.1 ± 13.4
LDLc (mg/dL) 109.5 ± 33.4
Tryglicerides (mg/dL) 138.7 ± 60.2
TNFα (pg/mL) 52.2 ± 74.3
Resistin (pg/mL) 6862 ± 1605
Adiponectin (pg/mL) 25.9 ± 5.2
Table 1. Study population (n = 60). Continuous variables are presented as mean ± SD, and categorical variables
as n (%). BMI, body mass index; HbA1c, glycated hemoglobin; LDLc, Low density lipoproteins cholesterol;
HDLc, High density lipoproteins cholesterol; TNF α, tumor necrosis factor α.
Adipocyte size/source and cardiometabolic risk factors. Morphological characteristics of adipo-
cytes, obtained either from subcutaneous or visceral source, were determined. We observed significant differ-
ence in the size and density of adipocytes from both types of adipose tissues, with a lower range of cell size in
SAT (Fig. 1).
In order to evaluate the relation of adipocyte’s characteristics with the cardiometabolic risk, the study pop-
ulation was divided according to adipocyte´s size median value, either from SAT or VAT, as shown in the
Tables 2 and 3, respectively. Subsequent analyses by gender and t2DM were performed due to potential metabolic
influence.
Larger adipocytes were related to higher plasma glucose and lower adiponectin, independently from their
source SAT or VAT. Larger SAT’s adipocytes were particularly related with higher blood pressure, as well as lower
HDL-cholesterol, lower plasma insulin and trend to lower HOMA-IR. On the other hand, larger VAT’s adipocytes
were related with lower plasma resistin. Both, gender and t2DM modified the effect of larger adipocytes. Gender
modified the effect of adipocytes size on a higher amount of variables (in SAT larger adipocytes: diastolic blood
pressure, adiponectin, insulin and HOMA-IR; while in VAT larger adipocytes: adiponectin, HDL cholesterol
and LDL cholesterol). On the other hand, t2DM impacted the adipocyte’s effect on fewer variables, mainly in
VAT (in VAT larger adipocytes: resistin and adiponectin).
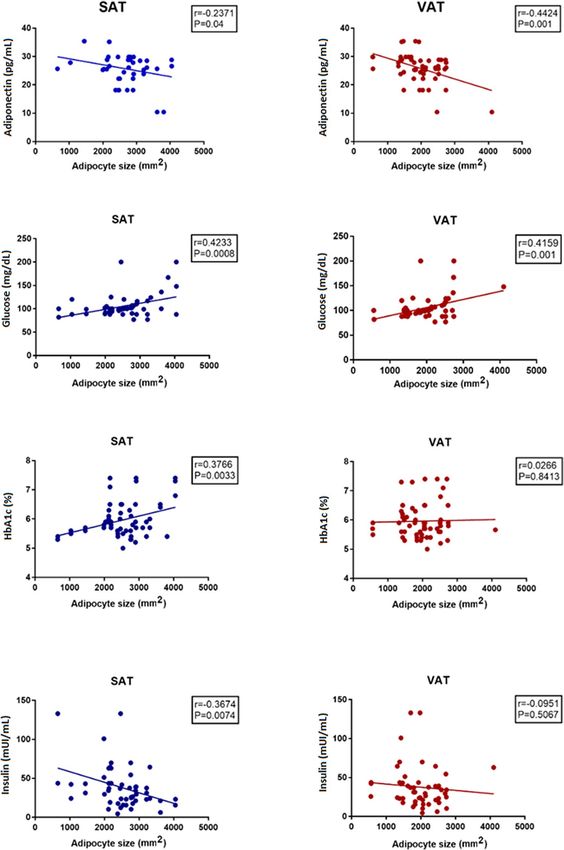
Further characterization of the relation between adipocyte size with cardiometabolic risk markers showed
that adipocyte size particularly from SAT (SAT[as]), but not adipocyte size from VAT (VAT[as]), positively cor-
related with systolic and diastolic blood pressures (Fig. 2).
Regarding metabolic profile, adipocyte size was related again with plasma insulin, adiponectin (negative
correlations) as well as with blood glucose and HbA1c (positive correlations) (Fig. 3).
In addition, adipocyte size showed general correlation with triglycerides (SAT[as] r = 0.31; p = 0.01, VAT[as]
r = 0.32; p = 0.01) and HDL-cholesterol (SAT[as] r = 0.35; p = 0.006, VAT[as] r = 0.32; p = 0.01), but did not cor-
relate with LDL-cholesterol (SAT[as] r = 0.11; p = 0.38, VAT[as] r = 0.20; p = 0.12).
Adipocyte’s size/source, endothelial dysfunction and atherogenic risk. Adipocyte size was
related with surrogate indicators of subclinical vascular dysfunction and atherogenesis, such as FMD and CIMT
(Fig. 4). In general, larger adipocytes were related with higher CIMT measures; whereas only VAT’s larger adi-
pocytes were related with lower FMD values. Such relation of adipocyte size-CIMT was modified by gender (in
VAT adipocytes) and t2DM (in SAT adipocytes). Likewise, gender affected the relation adipocyte size-FMD,
independently from their source; whereas t2DM modified the relation adipocyte size-FMD only in SAT adipo-
cytes.
Adipocyte’s size/source and interactions of cardiometabolic risk factors. Finally, multivariable
analysis was performed to further evaluate potential interactions related to adipocyte size. We found that larger
adipocytes from VAT were significantly associated with adiponectin, only when interacting with insulin (OR
6.2, CI95% 1.6 to 24.2, p = 0.008; adiponectin median cutoff 26.09 pg/mL insulin median cutoff 24.55 mUI/mL)
Likewise, larger adipocytes from SAT were associated with higher systolic pressure, only when accompanied
Scientific Reports | (2021) 11:1831 | https://doi.org/10.1038/s41598-021-81289-2 3
Vol.:(0123456789)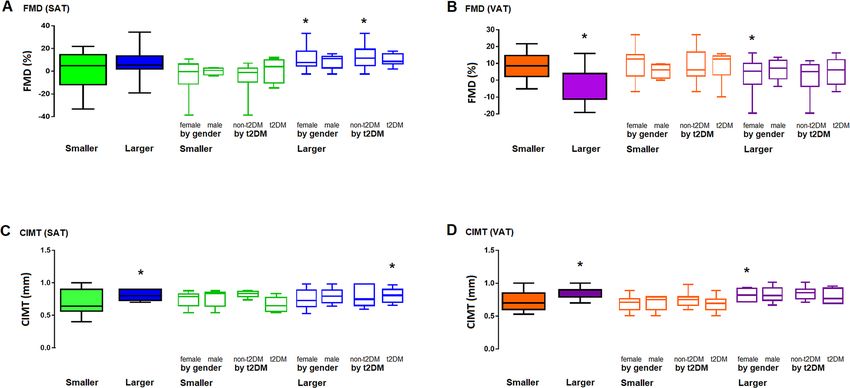
www.nature.com/scientificreports/
Figure 1. Characterization of adipose tissue (adipocytes size and density). The figure shows a representative
image of SAT, including smaller adipocytes (1) and larger adipocytes (2) as well as representative image of VAT
including smaller adipocytes (3) and larger adipocytes (4). Results are shown as mean ± standard deviation. SAT,
subcutaneous adipose tissue; VAT, visceral adipose tissue. (*) = statistical difference p < 0.05, one-tail, T-test.
Images in the figure were analyzed with the software Image J. (v. 1.53g). URL: https://imagej.nih.gov/ij.
by higher values of resistin and H
bA1c (OR 4.6, CI95% 1.3 to 16.4, p = 0.019; systolic pressure median cutoff
124 mmHg, resistin median cutoff 7172 pg/mL HbA1c median cutoff 5.9%).
Discussion
The main finding of the present study was that adipocyte characteristics of size and source showed differences
regarding their impact on cardiometabolic and atherogenic risks in population with obesity.
In general, larger adipocytes were associated with higher blood pressure, glucose and CIMT, as well as lower
concentration of insulin, cHDL and adiponectin; suggesting that the adipocyte size reliably reflected cardio-
metabolic risk. Further findings regarding the metabolic role of adipocyte size/source showed that although all
the study population showed clinically significant insulin resistance, as assessed by HOMA-IR; larger adipocytes
from SAT were associated with a worse gluco-metabolic profile, denoted by significantly higher plasma glucose,
HbA1c and lower plasma insulin, as compared with larger adipocytes from VAT. A possible explanation may come
from the allostatic hypothesis p erspective35. Adipocytes from SAT showed lower expandability, as evaluated by
the range of adipocyte size (Fig. 1, panel 1 and 2) as compared to VAT adipocyte range size (Fig. 1, panel 3 and
4); which would suppose that SAT adipocytes have a more limited ability for lipid storage, prompting to ectopic
lipid accumulation in myocytes, hepatocytes and beta cells, then causing gluco- and lipo-toxic effects such as
insulin resistance and apoptosis. Consistent with this notion, smaller adipocytes from VAT, probably owning
lower expandability than larger adipocytes, showed higher levels of resistin, a pro-inflammatory adipokine.
However, other studies have failed finding correlation between adipocyte size and visceral mass expansion, as
in the case of epicardial thickness. This may be due to the heterogeneity of adipocytes size in VAT from different
body sites, or dissimilarities regarding BMI and gender distribution between study p opulations20,36.
Other possible involved mechanisms explaining adipocyte size influence on metabolic risk include: (a) adi-
pocyte size-related GLUT-4 membrane distribution, as well as the higher intracellular accumulation of lipids in
larger adipocytes, which have been proposed to affect insulin resistance, independently from an inflammatory
response9,37; (b) the relation of adipocyte size with the secretion of several adipokines, including IL-6, IL-8, leptin
and TNFα, which own pro-inflammatory properties7; (c) adipocyte size and density may lead to relative degree
Scientific Reports | (2021) 11:1831 | https://doi.org/10.1038/s41598-021-81289-2 4
Vol:.(1234567890)www.nature.com/scientificreports/
Smaller adipocytes (n = 30) Larger adipocytes (n = 30)
By gender By t2DM By gender By t2DM
All Female Male Non t2DM t2DM All Female Male Non t2DM t2DM
Age (years) 41.3 ± 12.1 45.3 ± 10.1 37.4 ± 9.0 45.5 ± 8.1 42.1 ± 11.5 41.6 ± 7.7 43.9 ± 8.6 47.4 ± 9.3g 44.0 ± 10.0 46.0 ± 7.9
Weight (kg) 121.2 ± 23.0 121.7 ± 21.2 119.7 ± 30.3 121.8 ± 30.4 120.8 ± 30.4 128.1 ± 21.3 128.8 ± 20.3 126.8 ± 24.3 130.3 ± 26.8 126.2 ± 15.7
Height (m) 1.65 ± 0.09 1.61 ± 0.09 1.62 ± 0.07 1.64 ± 0.1 1.59 ± 0.07 1.63 ± 0.1 1.68 ± 0.07g 1.61 ± 0.04 1.65 ± 0.06 1.66 ± 0.07DM
BMI (kg/m2) 46.5 ± 8.1 46.7 ± 7.1 45.8 ± 11.4 44.9 ± 10.8 47.6 ± 5.7 47.0 ± 9.3 46.0 ± 8.7 49.1 ± 10.5 47.1 ± 10.0 46.2 ± 8.9
Waist circumference (cm) 134.8 ± 14.1 133.7 ± 11.0 138.3 ± 22.3 129.0 ± 8.0 138.7 ± 16.0 135.8 ± 17.6 137.7 ± 19.3 132.1 ± 13.7 135.6 ± 17.1 135.9 ± 18.6
SBP (mmHg) 118.8 ± 15.6 123.3 ± 16.0 114.9 ± 11.2 118.8 ± 10.0 123.0 ± 18.2 128.1 ± 11.0* 126.1 ± 10.4 126.4 ± 12.5 124.2 ± 9.6 127.9 ± 12.0
DBP (mmHg) 76.7 ± 9.4 77.9 ± 10.0 73.1 ± 6.9 77.5 ± 8.7 76.2 ± 10.2 82.1 ± 9.4* 81.7 ± 9.2 82.8 ± 9.8g 81.0 ± 8.2 83.0 ± 10.2
Adipokines and CHs
TNF-α (pg/mL) 53.6 ± 78.0 53.5 ± 83.8 48.8 ± 57.4 60.9 ± 79.8 46.4 ± 76.7 50.9 ± 72.1 40.2 ± 64.3 73.5 ± 86.4 47.4 ± 63.6 56.1 ± 82.6
Resistin (pg/mL) 6866 ± 1327 7012 ± 800 6427 ± 2343 6678 ± 1895 6988 ± 829 6846 ± 1828 7092 ± 1883 6428 ± 2031 6844 ± 2080 6848 ± 1855
Adiponectin (pg/mL) 28.2 ± 4.6 27.6 ± 4.8 25.7 ± 6.7 26.8 ± 5.6 27.4 ± 5.1 24.4 ± 5.3* 24.1 ± 5.5g 26.7 ± 3.8 24.9 ± 5.2 24.9 ± 5.2
Glucose (mg/dL) 96.9 ± 10.7 110.5 ± 26.3 97.0 ± 8.8 91.6 ± 4.7 117.8 ± 26.0 117.3 ± 29.5* 105.6 ± 19.1 107.5 ± 33.9 92.5 ± 5.3 118.3 ± 28.3
Insulin (mUI/mL) 42.4 ± 31.1 45.8 ± 36.4 24.6 ± 11.2 30.0 ± 19.4 47.5 ± 38.9 27.3 ± 15.4* 23.1 ± 10.2g 36.8 ± 21.0 28.3 ± 17.1 26.3 ± 14.1
HbA1c (%) 5.9 ± 0.5 6.1 ± 0.6 5.7 ± 0.4 5.7 ± 0.3 6.3 ± 0.5 6.1 ± 0.7 5.8 ± 0.5 6.1 ± 0.7 5.5 ± 0.2 6.3 ± 0.6
HOMA-IR 10.9 ± 9.9 12.9 ± 11.2 6.1 ± 3.0 6.2 ± 4.6 13.8 ± 11.3 7.1 ± 4.2 5.8 ± 2.5g 10.0 ± 5.9 6.5 ± 3.9 7.7 ± 4.5
Antidiabetic drug n (%) 19 (63.3) 14 (60.8) 4 (57.1) 8 (66.6) 10 (55.5) 13 (43.3) 7 (35.0) 3 (30.0) 5 (35.7) 5 (31.2)
Total cholesterol (mg/dL) 180.6 ± 35.4 178.3 ± 44.6 179.0 ± 38.7 183.6 ± 42.7 175.0 ± 43.5 175.5 ± 35.0 183.6 ± 33.9 159.2 ± 33.9 174.7 ± 40.2 176.1 ± 31.7
HDL cholesterol (mg/dL) 50.4 ± 14.0 42.2 ± 13.7 49.5 ± 17.3 53.9 ± 17.0 36.9 ± 7.2 41.7 ± 7.7* 46.2 ± 12.7 40.3 ± 9.7 45.1 ± 11.8 43.5 ± 12.4
LDL cholesterol (mg/dL) 108.7 ± 34.9 112.2 ± 33.0 101.7 ± 41.4 107.8 ± 34.8 110.9 ± 35.6 110.3 ± 32.5 115.8 ± 36.5 101.5 ± 25.2 109.2 ± 32.1 112.7 ± 35.6
Triglycerides (mg/dL) 140.1 ± 55.9 139.0 ± 57.7 151.9 ± 52.7 138.3 ± 52.1 144.4 ± 59.5 135.3 ± 65.1 139.2 ± 71.5 126.8 ± 50.6 126.0 ± 58.4 142.9 ± 71.0
Table 2. SAT’S adipocyte size and clinical-biochemical characteristics (n = 60). Continuous variables
presented as mean ± standard deviation and categorical variables as n (%). SAT, subcutaneous adipose tissue;
t2DM, type 2 diabetes mellitus (includes cases of impaired fasting glucose); BMI, body mass index; SBP,
systolic blood pressure; DBP, diastolic blood pressure; CHs, carbohydrates; HbA1c, glycosylated hemoglobin.
Mean comparison was performed by one-tail, T-test or U-Mann Whitney as appropriate; whereas categorical
data were compared by Fisher exact test. (*) indicates p < 0.05, mean difference between smaller vs. larger
adipocytes; (g) indicates p < 0.05, mean difference regarding adipocyte`s size, subgrouped by gender; (DM)
indicates p < 0.05, mean difference regarding adipocyte’s size, subgrouped by presence of t2DM (includes cases
of impaired fasting glucose).
of cell hypoxia, promoting the expression of hypoxia inducible factor-1α (HIF-1α) which regulates metabolically
relevant proteins like glucose transporters, visfatin, leptin, MMPs, VEGFα and AGPTL-438.
Regarding the effect over vascular function, our results indicate that adipocyte size is related to subclinical
atherogenesis, since larger adipocytes were associated with higher CIMT. Consistently, adipose tissue mass had
been previously described to modify the C IMT39; whereas, the amount of SAT has been associated with blood
pressure in animal models, which is probably explained by the activation of adipocyte renin-angiotensin local
system. Likewise, the increase in angiotensin II has been observed after blood flow modification in SAT, in
population with obesity40. In the other hand, the source of the adipocyte seemed to play a key role, since only
larger adipocytes from VAT were related with lower values of FMD; supporting the notion of a source-specific
contribution of adipose tissue for the CVR, probably explained by their own characteristics of remodeling ability
as well as the endocrine and pro-inflammatory n ature12,41,42.
Gender and t2DM significantly impacted the relation of adipocyte size/source with the metabolic and ath-
erogenic risk. Gender showed to modify the effect of adipocyte size on several surrogate variables of atherogenic
risk; whereas both, gender and t2DM affected the relation of adipocyte size/source on endothelial dysfunction
and atherogenic markers. Furthermore, a multivariate analysis suggests that adiponectin-insulin interactions
are related to larger adipocytes from VAT; as well as H bA1c-resistin- systolic blood pressure interactions related
to SATs larger adipocytes, probably reflecting selective mechanisms and/or metabolic pathways promoting car-
diometabolic risk, as shown in the proposed model (Fig. 5).
Finally, adipose tissue expansion and abnormal cytokine profile found in obesity lead not only to higher CVR,
but also carcinogenesis. Although not fully elucidated, insulin resistance, dysregulated adipokine profile and
chronic inflammation have been proposed to increase cancer risk. Changes in lipid metabolism may promote
cancer development by a free fatty acid increase, due to its functions as energy source for tumor cells and onco-
genic signal43,44. Interestingly, we observed changes in lipid metabolism enzymes and lower plasma adiponectin
associated to larger adipocytes, particularly affected by gender and t2DM in VAT, suggesting that higher VAT
expansion and t2DM provide a higher susceptibility for cancer, particularly important in post-menopausal
females due to the metabolic implications. This notion is consistent with findings from other s tudies45–48.
We consider that our data own reasonable external validation, since characteristics of the study population
are comparable to other populations recruited in similar s tudies39,41. In addition, there is only a low number of
studies characterizing adiposity, which have analyzed simultaneously SAT and VAT; whereas CVR is commonly
Scientific Reports | (2021) 11:1831 | https://doi.org/10.1038/s41598-021-81289-2 5
Vol.:(0123456789)www.nature.com/scientificreports/
Smaller adipocytes (n = 30) Larger adipocytes (n = 30)
By gender By t2DM By gender By t2DM
All Female Male Non t2DM t2DM All Female Male Non t2DM t2DM
Age (years) 41.6 ± 11.8 44.4 ± 9.9 38.5 ± 11.5 45.9 ± 8.4 41.4 ± 11.2 41.4 ± 8.5 44.9 ± 8.8 45.9 ± 8.9 43.6 ± 9.7 46.7 ± 7.8
Weight (kg) 128.3 ± 21.2 128.4 ± 19.8 128.0 ± 28.2 136.4 ± 22.8 122.9 ± 18.7 121. ± 23.1 120.7 ± 21.9 121.6 ± 26.2 117.7 ± 30.4 123.9 ± 14.7
Height (m) 1.65 ± 0.10 1.65 ± 0.09 1.59 ± 0.04 1.66 ± 0.08 1.62 ± 0.09 1.64 ± 0.08 1.63 ± 0.07 1.62 ± 0.06 1.63 ± 0.08 1.63 ± 0.06
BMI (kg/m2) 48.0 ± 8.6 47.4 ± 8.1 50.5 ± 10.5 49.6 ± 9.0 47.0 ± 8.3 45.5 ± 8.7 45.1 ± 7.4 46.2 ± 10.9 44.0 ± 10.9 46.8 ± 6.2
Waist circumference (cm) 136.9 ± 16.1 135.5 ± 14.5 142.7 ± 22.1 132.8 ± 10.3 139.7 ± 18.9 133.7 ± 15.6 135.6 ± 16.8 130.3 ± 13.4 132.4 ± 16.7 134.8 ± 15.1
SBP (mmHg) 122.4 ± 14.3 123.5 ± 14.8 118.0 ± 12.1 120.3 ± 8.3 123.8 ± 17.3 125.3 ± 12.6 126.1 ± 11.9 123.6 ± 13.6 122.9 ± 11.4 127.3 ± 13.3
DBP (mmHg) 78.4 ± 10.9 79.1 ± 11.3 75.7 ± 9.6 77.0 ± 9.0 79.3 ± 12.2 80.2 ± 8.2 80.5 ± 7.2 80.5 ± 9.9 81.4 ± 7.7 79.7 ± 8.7
Adipokines and CHs
TNF-α (pg/mL) 54.6 ± 75.2 43.1 ± 66.4 95.0 ± 96.3 42.8 ± 61.0 62.7 ± 84.6 49.8 ± 74.6 52.3 ± 85.2 46.1 ± 58.2 62.7 ± 78.4 38.7 ± 72.0
Resistin (pg/mL) 7305 ± 1017 7306 ± 1102 7303 ± 721 7583 ± 925 7114 ± 1061 6423 ± 1987* 6729 ± 1624 5950 ± 2457 6078 ± 2344 6722 ± 1643
Adiponectin (pg/mL) 27.8 ± 4.5 27.6 ± 4.3 28.3 ± 5.6 27.7 ± 4.9 27.9 ± 4.4 23.7 ± 5.2* 23.0 ± 5.7g 24.9 ± 4.2 24.2 ± 5.3 23.1 ± 5.3DM
Glucose (mg/dL) 99.9 ± 20.9 104.0 ± 11.4 98.7 ± 10.3 92.8 ± 5.2 109.6 ± 8.8 111.1 ± 25.5* 113.6 ± 32.0 105.6 ± 32.5 91.4 ± 4.8 127.5 ± 36DM
Insulin (mUI/mL) 36.5 ± 30.5 38.2 ± 34.3 30.3 ± 6.7 29.9 ± 11.0 40.8 ± 38.0 30.4 ± 20.0 29.6 ± 18.9 31.7 ± 22.8 28.3 ± 22.4 32.8 ± 17.5
HbA1c (%) 5.9 ± 0.5 6.1 ± 0.6 5.7 ± 0.4 5.6 ± 0.3 6.3 ± 0.5 6.3 ± 0.7 5.8 ± 0.5 6.1 ± 0.6 5.6 ± 0.3 6.3 ± 0.6
HOMA-IR 9.6 ± 9.3 10.2 ± 10.5 7.5 ± 2.3 6.2 ± 2.3 11.4 ± 11.1 8.2 ± 5.5 8.0 ± 5.2 8.6 ± 6.3 6.5 ± 5.1 10.3 ± 5.5
Antidiabetic drug n(%) 17 (56.6) 13 (54.2) 3 (50.0) 7 (58.3) 9 (50.0) 15 (50.0) 8 (42.1) 4 (36.4) 6 (42.8) 6 (37.5)
Total cholesterol (mg/dL) 172.9 ± 37.0 171.5 ± 39.1 178.8 ± 29.2 176.1 ± 36.5 170.8 ± 38.3 179.0 ± 41.6 192.4 ± 38.0 161.1 ± 39.3 181.1 ± 45.3 180.8 ± 37.9
HDL cholesterol (mg/dL) 46.2 ± 12.8 42.7 ± 11.7 53.9 ± 15.4 50.6 ± 14.4 41.2 ± 10.9 41.4 ± 10.3 45.9 ± 15.2 38.7 ± 9.5g 47.9 ± 15.6 38.8 ± 10.1
LDL cholesterol (mg/dL) 101.1 ± 26.6 103.0 ± 32.3 101.6 ± 32.2 102.4 ± 29.2 102.9 ± 34.1 113.9 ± 33.2 128.4 ± 32.3g 101.6 ± 32.9 113.8 ± 35.7 122.4 ± 34.2
Triglycerides (mg/dL) 153.8 ± 59.0 146.3 ± 73.5 149.3 ± 52.2 134.4 ± 55.3 154.7 ± 76.3 169.9 ± 59.8 130.3 ± 50.3 130.8 ± 52.4 129.3 ± 56.4 131.4 ± 46.3
Table 3. VAT’S adipocyte size and clinical-biochemical characteristics (n = 60). Continuous variables
presented as mean ± standard deviation and categorical variables as n (%). VAT, visceral adipose tissue; t2DM,
type 2 diabetes mellitus (includes cases of impaired fasting glucose); BMI, body mass index; SBP, systolic
blood pressure; DBP, diastolic blood pressure; CHs, carbohydrates; HbA1c, glycosylated hemoglobin. Mean
comparison was performed by one-tail, T-test or U-Mann Whitney as appropriate; whereas categorical
data were compared by Fisher exact test. (*) indicates p < 0.05, mean difference between smaller vs. larger
adipocytes; (g) indicates p < 0.05, mean difference regarding adipocyte`s size, subgrouped by gender; (DM)
indicates p < 0.05, mean difference regarding adipocyte`s size, subgrouped by presence of t2DM (includes cases
of impaired fasting glucose).
estimated indirectly using atherogenic risk calculations based on lipids. The present study includes direct indica-
tors of early vascular damage, namely FMD and CIMT.
Our findings may contribute to a better understanding of the link between adiposity characteristics and
cardiometabolic risk; however, some limitations include: (a) the cross-sectional design, which may not reflect
actual cardiovascular risk along time; (b) low sample size leading to potential bias, particularly in sub-analyses;
(c) lack of desirable evaluations, such as determination of a higher number of adipokines and/or ectopic lipid
accumulation.
In conclusion, adipocyte morphology and source differentially affect cardiometabolic and atherogenic risk
in population with obesity, and are potentially influenced by gender and Diabetes Mellitus.
Methods
Design and study sample. Cross-sectional study, evaluating cardiometabolic phenotypes correspond-
ing to adipocyte’s size and source. Additional subanalyses by gender and t2DM were performed. We enrolled
patients > 18 years old, diagnosed with morbid obesity (Body Mass Index [BMI] higher than 40 kg/m2 or BMI
higher than 35 kg/m2 experiencing obesity-related health conditions, such as t2DM, hypertension or obstructive
sleep apnea/hypopnea), programmed for bariatric surgery between January 2016 and December 2017 at C.M.N.
“20 de Noviembre”, ISSSTE at Mexico City. All females in the study sample were pre-menopausal. Patients did
not received weight-reducing therapy during 6 months previous to the enrollment and they were excluded in
case of second bariatric surgery, the existence of inflammatory diseases, severe renal and/or hepatic disease,
active malignancy, pregnancy or evidence of history of cardiovascular disease, considered if self-reported or
diagnostic evidence of ischemic heart disease, coronary artery disease, myocardial structural abnormalities, car-
diac interventions or being under treatment for any of such conditions. The study was designed and performed
elsinki49, and approved by the Local Committees of
according to ethical guidelines of the 1975 Declaration of H
Research, Ethics in Research and Biosafety of the Centro Médico Nacional ‘20 de Noviembre’ ISSSTE, Mexico
City (Protocol ID No. 386.2013). All participants provided written informed consent.
Clinical characterization. BMI was calculated as weight/height250. Waist circumference was measured
halfway between the lowest rib margin and the iliac crest at the end of a normal expiration. Blood pressure was
Scientific Reports | (2021) 11:1831 | https://doi.org/10.1038/s41598-021-81289-2 6
Vol:.(1234567890)www.nature.com/scientificreports/
Figure 2. Adipocyte size, BMI and blood pressure. The graphs show the correlation between adipocyte’s sizes in
VAT and SAT with BMI, systolic and diastolic pressure. SAT, subcutaneous adipose tissue; VAT, visceral adipose
tissue. Figure was produced with the software Graph Pad Prism 7.0. URL https://graphpad-prism.software.infor
mer.com/7.0.
obtained while the patient was in a seated position and was considered to be the mean of three readings obtained
5 min apart using an aneroid sphygmomanometer (Welch Allyn Inc.; Skaneateles Falls, NY, USA).
Clinical biochemistry and other biomarkers. Following a 12 h starvation, venous blood samples (4 ml)
were collected into BD Vacutainer tubes (Becton, Dickinson & Co., Franklin Lakes, NJ, USA) containing EDTA,
and centrifuged at 1500g, 10 min, at 4 °C, separated into fractions and stored at − 80 °C prior to analyses. Plasma
levels of triglycerides, total cholesterol, high-density lipoprotein cholesterol (HDLc), low-density lipoprotein
cholesterol (LDLc), glycosylated hemoglobin (HbA1c) and glucose were determined using routine clinical labo-
ratory auto-analyser (Synchron CX9 PRO Clinical System; Beckman Coulter, Brea, CA, USA). HOMA-IR was
calculated as follows: (Glucose [mg/dL] × Insulin)/405)51. Plasma TNFα, resistin and adiponectin were deter-
mined by immune-magnetic multiplexing assay (Milliplex MAP Human TH17 Magnetic Bead Panel Thermo
Fisher Scientific USA, Milliplex MAP Adiponectin Magnetic Bead Panel Thermo Fisher Scientific USA, Mil-
liplex MAP Resistin Magnetic Bead Panel Thermo Fisher Scientific USA) and read in Magpix System following
recommendations of the provider.
Scientific Reports | (2021) 11:1831 | https://doi.org/10.1038/s41598-021-81289-2 7
Vol.:(0123456789)www.nature.com/scientificreports/
Figure 3. Adipocyte size, adiponectin and glucose metabolism. The graphs show the correlation between
adipocyte’s size in VAT and SAT with adiponectin and glucose metabolism factors. SAT, subcutaneous adipose
tissue; VAT, visceral adipose tissue; HbA1c, glycosylated hemoglobin. Figure was produced with the software
Graph Pad Prism 7.0. URL https://graphpad-prism.software.informer.com/7.0.
Adipose tissue analysis. During the bariatric surgery, samples of 2 c m3 of abdominal Subcutaneous Adi-
pose Tissue (SAT) and Visceral Adipose Tissue (VAT) from the omentum, were obtained, considering all the
aspects of ethics and biosafety of the patient. The size of the adipocytes was analyzed in histologic preparations
stained with toluidine blue, which were further digitalized and measured with Image-J software (v. 1.53g. URL:
https://imagej.nih.gov/ij). Data shown are the results of at least 10 fields performed on each slide.
Scientific Reports | (2021) 11:1831 | https://doi.org/10.1038/s41598-021-81289-2 8
Vol:.(1234567890)www.nature.com/scientificreports/
Figure 4. Cardiovascular risk. FMD (A,B) and CIMT (C,D) values arranged according to adipose tissue
type. Results were further sub-arranged by gender and Diabetes Mellitus. SAT, subcutaneous adipose tissue;
VAT, visceral adipose tissue; FMD, flow mediated dilation; CIMT, carotid intima media thickness. Figure was
produced with the software Graph Pad Prism 7.0. URL https://graphpad-prism.software.informer.com/7.0.
Figure 5. Adipocytes characteristics and cardiovascular risk. The diagram describes a proposed model, based
on the results of adipocytes size/source, potential interactions with metabolic mediators and pathophysiological
effects. SAT, subcutaneous adipose tissue; VAT, visceral adipose tissue; H
bA1c, glycated hemoglobin; RES,
resistin; ADIPON, adiponectin; INS, insulin; HDLc; high density lipoprotein cholesterol; FMD, flow mediated
dilation; CIMT, carotid intima media thickness.
Endothelial dysfunction and subclinical atherogenesis. Flow Mediated Dilation (FMD) test was
performed using ultrasound imaging with a Philips EPIQ7L12-3 Broadband Linear Array Transducer (Royal
Philips) in B-mode according to the recommendations of the International Brachial Artery Reactivity Task
Force52. Carotid Intima Media Thickness (CIMT) was evaluated using an ultrasound imaging 4.0 MHz probe
(Philips, Saronno, Italy). Measurements were according to the 2004 Mannheim Consensus53. Briefly, with the
patient in a supine position, primary transverse and longitudinal scanning of the common carotid artery was
performed, while focusing on the posterior carotid wall at the beginning of the carotid bifurcation and the com-
mon carotid artery. CIMT was acquired at a distance of approximately 1 cm from the bifurcation of the common
carotid artery and considered as the greatest distance between the lumen-intima interface and the media adven-
Scientific Reports | (2021) 11:1831 | https://doi.org/10.1038/s41598-021-81289-2 9
Vol.:(0123456789)www.nature.com/scientificreports/
titia interface. The result was expressed as the mean of at least four measurements. In all cases, reproducible
measures were validated using acceptable intraclass correlation coefficients (> 0.85) for inter-observer reliability.
Statistical analyses. Normality of data distribution was performed with Kolmogórov-Smirnov test. Con-
tinuous variables were expressed as the media ± SD; qualitative data were shown as n (%). Two-tailed, U-Mann
Whitney or non-paired T-test, as well as Fisher Exact Test, were used as appropriate. Pearson correlation coef-
ficient was applied to determine the relationship between clinical-biochemical biomarkers and adipocyte size.
Finally, multivariate regression model analysis was performed. All statistics were performed using software
GraphPad Prism software (v.7) as well as SPSS (v.23 SPSS Inc., Chicago, IL, USA). Statistical significance was
considered if p ≤ 0.05.
Data availability
The datasets generated and analyzed during the current study are not publicly available due to privacy policies
of the hospital and patients information; but are available from the corresponding author on reasonable request.
Received: 4 July 2020; Accepted: 30 December 2020
References
1. NCD Risk Factor Collaboration (NCD-RisC). Worldwide trends in body-mass index, underweight, overweight, and obesity from
1975 to 2016: A pooled analysis of 2416 population-based measurement studies in 128.9 million children, adolescents, and adults.
Lancet 390, 2627–2642 (2017).
2. Lavie, C. J. et al. Obesity and prevalence of cardiovascular diseases and prognosis—the obesity paradox updated. Prog. Cardiovasc.
Dis. 58, 537–547 (2016).
3. Kopelman, P. G. Obesity as a medical problem. Nature 404, 635–643 (2000).
4. Bray, G. A., Kim, K. K. & Wilding, J. P. H. Obesity: A chronic relapsing progressive disease process. A position statement of the
World Obesity Federation. Obes. Rev. 18, 715–723 (2017).
5. Villaret, A. et al. Adipose tissue endothelial cells from obese human subjects: Differences among depots in angiogenic, metabolic,
and inflammatory gene expression and cellular senescence. Diabetes 59, 2755–2763 (2010).
6. Kershaw, E. E. & Flier, J. S. Adipose tissue as an endocrine organ. J. Clin. Endocrinol. Metab. 89, 2548–2556 (2018).
7. Skurk, T., Alberti-Huber, C., Herder, C. & Hauner, H. Relationship between adipocyte size and adipokine expression and secretion.
J. Clin. Endocrinol. Metab. 92, 1023–1033 (2007).
8. Symonds, M. E. Adipose Tissue Biology. 2nd ed, 1–460 (2017).
9. Kim, J. I. et al. Lipid-overloaded enlarged adipocytes provoke insulin resistance independent of inflammation. Mol. Cell. Biol. 35,
1686–1699 (2015).
10. Ibrahim, M. M. Subcutaneous and visceral adipose tissue: Structural and functional differences. Obes. Rev. 11, 11–18 (2010).
11. Smith, S. R. et al. Contributions of total body fat, abdominal subcutaneous adipose tissue compartments, and visceral adipose
tissue to the metabolic complications of obesity. Metabolism. 50, 425–435 (2001).
12. Henninger, A. M. J., Eliasson, B., Jenndahl, L. E. & Hammarstedt, A. Adipocyte hypertrophy, inflammation and fibrosis characterize
subcutaneous adipose tissue of healthy, non-obese subjects predisposed to type 2 diabetes. PLoS ONE 9, e105262 (2014).
13. Zhu, R. et al. A Disintegrin and metalloproteinase with thrombospondin motifs 18 deficiency leads to visceral adiposity and
associated metabolic syndrome in mice. Am. J. Pathol. 188, 461–473 (2018).
14. Yan, Z. C. et al. Exercise reduces adipose tissue via cannabinoid receptor type 1 which is regulated by peroxisome proliferator-
activated receptor-delta. Biochem. Biophys. Res. Commun. 354, 427–433 (2007).
15. Bjorntorp, P., Gustafson, A. & Persson, B. Adipose tissue fat cell size and number in relation to metabolism in endogenous hyper-
triglyceridemia. ActaMedicaScandinavica. 190, 363–367 (1971).
16. Ryden, M. & Arner, P. Cardiovascular risk score is linked to subcutaneous adipocyte size and lipid metabolism. J. Intern. Med. 282,
220–228 (2017).
17. Reynisdottir, S., Eriksson, M., Angelin, B. & Arner, P. Impaired activation of adipocyte lipolysis in familial combined hyperlipi-
demia. J. Clin. Investig. 95, 2161–2169 (1995).
18. Frayn, K., Bernard, S., Spalding, K. & Arner, P. Adipocyte triglyceride turnover is independently associated with atherogenic
dyslipidemia. J. Am. Heart Assoc. 1, e003467 (2012).
19. Arner, E. et al. Adipocyte turnover: Relevance to human adipose tissue morphology. Diabetes 59, 105–109 (2010).
20. Tandon, P., Wafer, R. & Minchin, J. E. N. Adipose morphology and metabolic disease. J. Exp. Biol. 221(Pt Suppl 1), jeb164970
(2018).
21. Krautbauer, S. et al. Adipocyte hypertrophy and improved postprandial lipid response in beta 2 syntrophin deficient mice. Cell.
Physiol. Biochem. 52, 1151–1165 (2019).
22. Khan, T. et al. Metabolic dysregulation and adipose tissue fibrosis: Role of collagen VI. Mol. Cell. Biol. 29, 1575–1591 (2009).
23. Sivasami, P. et al. Adipose tissue loss and lipodystrophy in xylosyltransferase II deficient mice. Int. J. Obes. 43, 1783–1794 (2019).
24. Marcondes, R. R. et al. Exercise differentially affects metabolic functions and white adipose tissue in female letrozole- and dihy-
drotestosterone-induced mouse models of polycystic ovary syndrome. Mol. Cell. Endocrinol. 448, 66–76 (2017).
25. Kilian, T. M., Klöting, N., Blüher, M. & Beck-Sickinger, A. G. Prenatal notch1 receptor blockade by protein delta homolog 1 (DLK1)
modulates adipocyte size in vivo. Int. J. Obes. 40, 698–705 (2016).
26. McLaughlin, T. et al. Enhanced proportion of small adipose cells in insulin-resistant vs insulin-sensitive obese individuals implicates
impaired adipogenesis. Diabetologia 50, 1707–1715 (2007).
27. McLaughlin, T. et al. Inflammation in subcutaneous adipose tissue: Relationship to adipose cell size. Diabetologia 53, 369–377
(2010).
28. Carpentier, A. C., Labbe, S. M., Grenier-Larouche, T. & Noll, C. Abnormal dietary fatty acid metabolic partitioning in insulin
resistance and type 2 diabetes. Clin. Lipidol. 6, 703–716 (2011).
29. McLaughlin, T. et al. Adipose cell size and regional fat deposition as predictors of metabolic response to overfeeding in insulin-
resistant and insulin-sensitive humans. Diabetes 65, 1245–1254 (2016).
30. Kursawe, R. et al. Cellularity and adipogenic profile of the abdominal subcutaneous adipose tissue from obese adolescents: Asso-
ciation with insulin resistance and hepatic steatosis. Diabetes 59, 2288–2296 (2010).
31. Fang, L. et al. The cell size and distribution of adipocytes from subcutaneous and visceral fat is associated with type 2 diabetes
mellitus in humans. Adipocyte. 4, 273–279 (2015).
32. Mundi, M. S. et al. Body fat distribution, adipocyte size, and metabolic characteristics of nondiabetic adults. J. Clin. Endocrinol.
Metab. 95, 67–73 (2010).
Scientific Reports | (2021) 11:1831 | https://doi.org/10.1038/s41598-021-81289-2 10
Vol:.(1234567890)www.nature.com/scientificreports/
33. Meyer, L. K. et al. Adipose tissue depot and cell size dependency of adiponectin synthesis and secretion in human obesity. Adipocyte.
2, 217–226 (2013).
34. Meena, V. P. et al. Relationship of adipocyte size with adiposity and metabolic risk factors in Asian Indians. PLoS ONE 9, e108421
(2014).
35. Virtue, S. & Vidal-Puig, A. Adipose tissue expandability, lipotoxicity and the metabolic syndrome—Anallostatic perspective.
Biochem. Biophys. Acta. 1801, 338–349 (2010).
36. Aitken-Buck, H. M. et al. Relationship between epicardial adipose tissue thickness and epicardial adipocyte size with increasing
body mass index. Adipocyte. 8, 412–420 (2019).
37. Cotillard, A. et al. Adipocyte size threshold matters: Link with risk of type 2 diabetes and improved insulin resistance after gastric
bypass. J. Clin. Endocrinol. Metab. 99, 1466–1470 (2014).
38. Trayhurn, P. Hypoxia and adipose tissue function and dysfunction in obesity. Physiol. Rev. 93, 1–21 (2013).
39. Randrianarisoa, E. et al. Periaortic adipose tissue compared with peribrachial adipose tissue mass as markers and possible modula-
tors of cardiometabolic risk. Angiology 69, 854–860 (2018).
40. Cassis, L. A., Police, S. B., Yiannikouris, F. & Thatcher, S. E. Local adipose tissue renin-angiotensin system. Curr. Hypertens. Rep.
10, 93–98 (2008).
41. Wajchenberg, B. L., Giannella-Neto, D., Da Silva, M. E. R. & Santos, R. F. Depot-specific hormonal characteristics of subcutaneous
and visceral adipose tissue and their relation to the metabolic syndrome. Horm. Metab. Res. 34, 616–621 (2002).
42. Jialal, I. & Devaraj, S. Subcutaneous adipose tissue biology in metabolic syndrome. Horm. Mol. Biol. Clin. Investig. 33, 1–6 (2018).
43. Pérez-Hernández, A. I. et al. Mechanisms linking excess adiposity and carcinogenesis promotion. Front. Endocrinol. 5, 65 (2014).
44. Catalán, V., Gómez-Ambrosi, J., Rodríguez, A. & Frühbeck, G. Adipose tissue immunity and cancer. Front. Physiol. 4, 275 (2013).
45. Khadka, R., Tian, W., Hao, X. & Koirala, R. Risk factor, early diagnosis and overall survival on outcome of association between
pancreatic cancer and diabetes mellitus: Changes and advances, a review. Int. J. Surg. 52, 342–346 (2018).
46. Ballotari, P. et al. Diabetes and risk of cancer incidence: Results from a population-based cohort study in northern Italy. BMC
Cancer. 17, 703 (2017).
47. Ohkuma, T., Peters, S. A. E. & Woodward, M. Sex differences in the association between diabetes and cancer: A systematic review
and meta-analysis of 121 cohorts including 20 million individuals and one million events. Diabetologia 61, 2140–2154 (2018).
48. Picon-Ruiz, M. et al. Obesity and adverse breast cancer risk and outcome: Mechanistic insights and strategies for intervention. CA
Cancer J. Clin. 67, 378–397 (2017).
49. World Medical Association. Declaration of Helsinki. https://www.wma.net/wp-content/uploads/2016/11/DoH-Oct1975.pdf
(Accessed 2 Nov 2020).
50. Quetelet, L. A. Physique SocialeouEssaisur le developpement de ses faculties de l’homme Vol. 2 (C Muquardt, Bruxelles, 1869).
51. Matthews, D. et al. Homeostasis model assessment: Insulin resistance and B-cell function from fasting plasma glucose and insulin
concentrations in man. Diabetologia 28, 412–419 (1985).
52. Corretti, M. C. et al. Guidelines for the ultrasound assessment of endothelial-dependent flow-mediated vasodilation of the brachial
artery: A report of the international brachial artery reactivity task force. J. Am. Coll. Cardiol. 39, 257–265 (2002).
53. Touboul, P. J. et al. Mannheim intima-media thickness consensus. Cerebrovasc. Dis. 18, 346–349 (2004).
Acknowledgements
Authors declare that Alberto Melchor-López received a grant from CONACYT No. 12525 during his PhD studies.
The authors gratefully acknowledge support from Institutional Program E015, ISSSTE; and grant CONACYT
SALUD-2015-1-262335. Special thanks to Dr. María Angélica Díaz-Aranda for her excellent comments and
English translation.
Author contributions
J.A.S-C. and G.D-S. conceived the design and experiments. K.D-M., D.Z.B-L., M.S-G. and J.E.M-H., collected
data and analyzed the results. E.V-G., A.H-P., C.R.Z-A., G.A.D-P. A.S.R-H., J.A.G-B., A.M-L., M.O-F., J.M-R.,
O.F.G-F., A.T-O., M.O-V., M.E-T., J.A.P-J., M.A.T-G., J.O-V. and B.M-A. conducted experiments. S.L.A-E., M.E.R-
A., R.P-C., S.G. and P.M-T. critically revised the manuscript. All authors reviewed the manuscript.
Competing interests
The authors declare no competing interests.
Additional information
Correspondence and requests for materials should be addressed to J.A.S.-C.
Reprints and permissions information is available at www.nature.com/reprints.
Publisher’s note Springer Nature remains neutral with regard to jurisdictional claims in published maps and
institutional affiliations.
Open Access This article is licensed under a Creative Commons Attribution 4.0 International
License, which permits use, sharing, adaptation, distribution and reproduction in any medium or
format, as long as you give appropriate credit to the original author(s) and the source, provide a link to the
Creative Commons licence, and indicate if changes were made. The images or other third party material in this
article are included in the article’s Creative Commons licence, unless indicated otherwise in a credit line to the
material. If material is not included in the article’s Creative Commons licence and your intended use is not
permitted by statutory regulation or exceeds the permitted use, you will need to obtain permission directly from
the copyright holder. To view a copy of this licence, visit http://creativecommons.org/licenses/by/4.0/.
© The Author(s) 2021
Scientific Reports | (2021) 11:1831 | https://doi.org/10.1038/s41598-021-81289-2 11
Vol.:(0123456789)You can also read