Semi-Supervised Deep Learning for Multi-Tissue Segmentation from Multi-Contrast MRI
←
→
Page content transcription
If your browser does not render page correctly, please read the page content below
Noname manuscript No.
                                           (will be inserted by the editor)

                                           Semi-Supervised Deep Learning for Multi-Tissue Segmentation
                                           from Multi-Contrast MRI

                                           Syed Muhammad Anwar · Ismail Irmakci · Drew
                                           A. Torigian · Sachin Jambawalikar · Georgios
                                           Z. Papadakis · Can Akgun · Jutta Ellermann ·
arXiv:2009.03128v2 [eess.IV] 27 Nov 2020

                                           Mehmet Akcakaya · Ulas Bagci

                                           Received: date / Accepted: date

                                           Abstract Segmentation of thigh tissues (muscle, fat, inter-muscular adipose tissue (IMAT), bone,
                                           and bone marrow) from magnetic resonance imaging (MRI) scans is useful for clinical and research
                                           investigations in various conditions such as aging, diabetes mellitus, obesity, metabolic syndrome,
                                           and their associated comorbidities. Towards a fully automated, robust, and precise quantification
                                           of thigh tissues, herein we designed a novel semi-supervised segmentation algorithm based on deep
                                           network architectures. Built upon Tiramisu segmentation engine, our proposed deep networks use
                                           variational and specially designed targeted dropouts for faster and robust convergence, and utilize
                                           multi-contrast MRI scans as input data. In our experiments, we have used 150 scans from 50 distinct
                                           subjects from the Baltimore Longitudinal Study of Aging (BLSA). The proposed system made use
                                           of both labeled and unlabeled data with high efficacy for training, and outperformed the current
                                           state-of-the-art methods. In particular, dice scores of 97.52%, 94.61%, 80.14%, 95.93%, and 96.83%
                                           are achieved for muscle, fat, IMAT, bone, and bone marrow segmentation, respectively. Our results
                                           indicate that the proposed system can be useful for clinical research studies where volumetric and
                                           distributional tissue quantification is pivotal and labeling is a significant issue. To the best of our
                                           knowledge, the proposed system is the first attempt at multi-tissue segmentation using a single
                                           end-to-end semi-supervised deep learning framework for multi-contrast thigh MRI scans.
                                           Keywords Semi-supervised Learning · Tissue segmentation · IMAT

                                           1 Introduction

                                           The body composition of tissues changes over time and human muscles tend to lose strength. This
                                           could be due to aging or clinical conditions such as diabetes milletus and metabolic syndrome [1].
                                           The muscles and bones in human body are mechano-responsive tissues, whose strength reduces
                                           with time due to the accumulation of adipose (fat) tissue. Fat accumulation in bone occurs in the
                                           Dr. Anwar and Dr. Bagci are with the Center for Research in Computer Vision, University of Central Florida,
                                           Orlando, Florida, USA. Dr. Irmakci is with Ege University, Izmir, Turkey. Dr. Torigian is with Department of
                                           Radiology, Hospital of the University of Pennsylvania, Pennsylvania, USA. Dr. Jambawalikar is with Columbia
                                           University, NYC. Dr. Papadakis is with Foundation for Research and Technology Hellas, Crete, Greece. Dr. Akgun
                                           is with FlyWheel Inc., Boston, MA. Dr. Akcakaya and Dr. Ellerman are with University of Minnesota, Minniapolis.
                                           Corresponding author’s email: E-mail: bagci@ucf.edu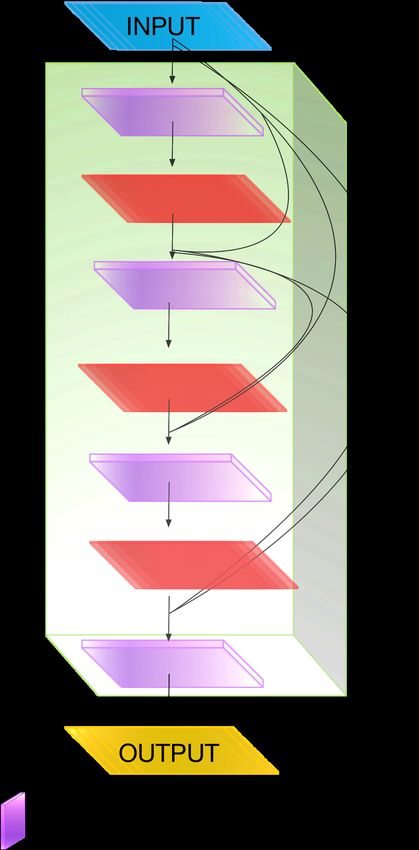
2                                                                          Syed Muhammad Anwar et al.

marrow region. When it occurs within the muscle, it is called fat infiltration [2]. Fat infiltration in
muscles acts as an indicator of various clinical outcomes [3], although, inter- and intra-muscular fat
accumulation is still not well understood. One of the reasons for this research gap is the challenge
in precise quantification of fat accumulation in the muscular tissue. An automated system that can
effectively segment various tissues within the thigh region could lead to a better understanding of
this phenomenon.
    There are numerous skeletal muscles within the human body which help in maintaining posture
and making movements. These tissues also contribute to thermo-regulation by keeping an energy
balance within the body [4]. Among skeletal muscles, the thigh muscle group is one of the largest
and plays a very important role in movement and defining human gait. It can be severely effected
by a lack of use or aging. Muscular dystrophy is an important condition that needs to be detected at
the right time to avoid muscular loss. Fat fraction can be used as a bio-marker to study such kinds
of musculo-skeletal diseases [5], where an accurate segmentation of the muscle tissue becomes an im-
portant task. Multi-contrast Magnetic Resonance (MR) images (e.g., water-and-fat, fat-suppressed,
and water-suppressed images) as shown in Figure 1 are used to address tissue volume quantifi-
cation. Since tissue boundaries are often ambiguous, multi-contrasts are often used. The contrast
levels between muscle and subcutaneous fat are difficult to identify with both automated meth-
ods and expert manual assessment [6]. In this regard, the existing auto-segmentation methods fall
short especially when dealing with Inter-Muscular Adipose Tissue (IMAT). Non-invasive imaging
techniques are often sought to evaluate fat infiltration and to quantify its extent. However, an auto-
mated and accurate image segmentation technique is still required. Although Magnetic Resonance
Imaging (MRI) provides good contrast when imaging muscular regions [7], accurately segmenting
pathological tissue using automated methods is challenging. Mostly in current clinical settings,
manual segmentation methods are used, but these are tedious and time consuming with a high
amount of inter- and intra-observer variability [8].
    Although current efforts are mostly focused on detecting and quantifying IMAT, there is a
strong need for quantifying other tissues in the thigh region including, muscle, fat, bone, and bone
marrow. In particular, there is still a lack in systematic understanding of how change in various
tissue volumes and distribution (across groups or longitudinally) contribute to metabolic health.
In this regard, MRI is a frequent imaging choice for the thigh region due to its lack of ionizing
radiation, and superior soft tissue contrast compared with other non-invasive imaging methods [9].
Furthermore, with MRI, multiple contrasts can be applied to the same tissues for enhancing their
visualization and analysis. An example of this phenomena is illustrated for the thigh MRI shown
in Figure 1, where three different MRI contrasts are visualized: Water-and-fat, fat-suppressed, and
water-suppressed. Despite the provision of complementary tissue information using multi-contrast
MRI, current segmentation methods fall short in capturing tissue details especially when IMAT
distributions change with respect to varying clinical conditions. Hence, there remains a challenge to
develop an automated system that can perform multi-tissue segmentation in multi-contrast thigh
MR images with sparsely annotated data.

1.1 Related Works

Deep learning has become the standard choice for addressing various problems in medical image
analysis [10][11][12], but has not been widely used in musculo-skeletal MRI studies yet. There are
various reasons for this including: the time required to generate manual annotations for supervised
Semi-Supervised Deep Learning for Multi-Tissue Segmentation from Multi-Contrast MRI 3
(a) water-and-fat (b) fat-suppressed
(c) water-suppressed (d) Ground Truth (GT)
Fig. 1: An example of a multi-contrast MRI scan (a, b, c) and ground truth tissue labels (d). Fat:
blue, muscle: green, bone: orange, bone-marrow: brown, IMAT: red.
deep learning, the variability in MRI data, the anatomical differences between subjects, and the
large amount of imaging data required for pixel level labeling. A notable study utilizing deep learning
algorithms was proposed [13], in which fatty infiltration was evaluated with automatic segmentation
using MRIs of healthy subjects. A standard U-Net architecture [14] with Generative Adversarial
Networks (GANs) (to overcome the lack of large scale training data) was utilized to augment texture
and shape into segmentation procedure, achieving a dice score of 88%. A multi-parametric deep
learning network was proposed for generating the tissue map in the thigh region using whole body
MRI scans [15]. The study used a small cohort of 24 patients and reported dice scores of 81% and
82% for fat and muscle tissues, respectively.
Surprisingly, the literature on automatic quantification of thigh tissues from the pre-deep learn-
ing era is limited too, where existing studies are focused on IMAT research mostly, and less on
multi-tissue quantification with multi-contrast MRI. Different techniques were used for the segmen-
tation of fat and muscle using MR scans from 37 patients [6], including thresholding, local, and
global energy minimization (via graph cut). It was found that graph cut methods gave the best
performance for severe fat infiltration where shape prior knowledge was used. A Gaussian mixture
model based method was used for segmenting the muscle, fat, and IMAT [16]. The clustering based
techniques worked well for IMAT, but failed to detect the subcutaneous fat. A novel fuzzy con-
nectivity based segmentation method was used for fat and muscle segmentation in thigh images
[17]. The method used affinity propagation clustering technique to minimize user intervention in
the segmentation process while achieving the-state-of-the-art dice score of 84% and 87% for fat and
muscle tissues, respectively. A comprehensive evaluation of other pre-deep learning era methods can
be found here [17].
The methods presented above either lack in performance or cannot provide an end-to-end so-
lution for multi-tissue segmentation of thigh MR images using a unified framework. Our proposed
method uses a single framework in both supervised and semi-supervised settings to segment multi-
contrast MR images and achieves a fast and reliable segmentation map for multiple tissues within
the thigh region.4 Syed Muhammad Anwar et al. 1.2 Our Contributions We propose a new deep learning framework to accurately segment multiple tissues pertaining to the thigh region using multi-contrast MRI. By employing both supervised and semi-supervised strategies on the Baltimore Longitudinal Study for Aging (BLSA) imaging data, we obtained new state-of-the- art results in quantifying muscle, fat, IMAT, bone, and bone marrow. Our study is novel because no previous study has investigated deep learning as an accurate and efficient solution for multi-tissue quantification from multi-contrast thigh MRI. Furthermore, we incorporated architectural novelties into the deep segmentation problem, where we handled the lack of large amounts of precisely labeled samples using the semi-supervised Tiramisu network. In the last part of the study, we studied the relationship of efficiency and robustness in our proposed semi-supervised deep network. Despite the importance of these concepts (efficiency and robustness), there has been no controlled deep learning based segmentation studies which compare robustness and convergence of the segmentation process when imaging data and ground truth labels are scarce. This is particularly important in the medical imaging field. To address this research gap, we revisited the dropout concept in deep learning, and with the help of Targeted Dropout (TD) and Variational Dropout (VD) anchored into our network, improved segmentation results with faster convergence and better training experience were achieved. Our proposed strategies outperformed the state-of-the-art methods in the literature both in supervised and semi-supervised multi-tissue segmentation problems. We believe that our end-to-end deep network solution will be a significant milestone towards understanding how the inter- and intra-muscular accumulation of adipose tissue affects muscles in particular and metabolic health in general, and would allow us to address muscular dystrophies and the effects of aging. 2 Methods We proposed a semi-supervised approach to segment multiple tissues from three-different contrast MRI scans (Figure 1 a-c). We also test the applicability of our proposed system under fully su- pervised setting (to compare results) for tissues whose ground truth annotations are available. In the supervised approach, fat, muscle, bone, and bone-marrow tissues are learned. In our proposed semi-supervised approach, a more challenging tissue IMAT as well as muscle, fat, bone, and bone marrow tissues were learned. The proposed methodology is shown in Figure 2, where both super- vised and semi-supervised settings are elaborated. After all (three) contrasts of MRI scans (Figure 1) were pre-processed to remove inhomogeneity, minimize noise, and standardize intensity scale across subjects, an encoder-decoder style deep network (called Tiramisu due to its 103-layers with dense connections) was designed for the segmentation of the thigh region by employing both supervised and semi-supervised techniques. The output of the end-to-end framework is the segmentation map for muscle, fat, IMAT, bone, and bone marrow tissues. 2.1 Dataset A total of 150 scans from 50 subjects were used in our evaluations (BLSA study participants, 3T Philips Achieva MR scanner equipped with a Q-body radio frequency coil for transmission and reception) [18]. The dataset is publicly available once a signed agreement is made with BLSA. Three different T1-weighted MR contrasts (water and fat, fat-suppressed, and water-suppressed) were used, where water and fat suppression were achieved using spectral pre-saturation with inversion
Semi-Supervised Deep Learning for Multi-Tissue Segmentation from Multi-Contrast MRI                         5

                                                    Muscle,
                                                                Labeled                           Muscle,
                                                                Dataset                           Fat,
                                                    Fat,
                 Labeled                                                                          Bone,
                                     Tiramisu       Bone,                           Tiramisu      Bone-
                 Dataset                            Bone-      Unlabeled                          marrow,
                                                    marrow
                                                                Dataset                           IMAT
                           Supervised setting                          Semi- Supervised setting

              Fig. 2: Proposed supervised and semi-supervised segmentation settings.

recovery (SPIR). These separate image volumes were obtained using a spoiled gradient recalled
echo (SPGR) sequence, with coverage from the proximal to distal ends of the femur using 80 slices,
a field of view (FOV) of 440 × 440mm2 , a voxel size of 1 × 1mm2 in-plane, and slice thickness
varying from 1 mm to 3 mm in different scans. Acquisition parameters included: Repetition time
(TR) = 7.7 ms, echo time (TE) = 2.4 ms, number of signal averages (NSA) = 2, flip angle (FA)
= 25 degrees, and bandwidth of 452 Hz/pixel. The first image volume (among those three volumes
obtained) containing water and fat signal intensities was obtained with the T1 SPGR/fast field echo
(FFE) sequence described above. For fat-only and water-only images, water and fat suppression were
obtained using spectral pre-saturation with inversion recovery. The age of subjects ranged between
44-89 years (71 ± 11) and the body mass index (BMI) ranged from 18.67 - 45.68 (26.86 ± 5.02). The
details of the subjects included in the study are given in Table 1.

Table 1: Details about the experimental cohort used in the experiments including subject age
(years), weight (kg), height (cm) and Body Mass Index (Kg/m2 ).

          Characteristics                       Range                                   Mean ± Std Dev

          Age                                   [44, 89] years                          71±11 years
          Weight                                [47.7, 121] kg                          77.5±17 kg
          Height                                [148, 187.1] cm                         169.32±9.26 cm
          BMI                                   [18.67, 45.68] kg/m2                    26.87±5.02 kg/m2

2.2 Pre-processing MRIs

MR images are affected by various types of artifacts including inhomogeneity (field bias), inten-
sity non-standardness, and inherent noises from the acquisition process [19]. The removal of bias
generates additional noise, and hence a de-noising filter should be applied after bias correction.
We used a non-uniform non-parametric intensity normalization technique (N4ITK) [20] to remove
field bias, which itself generated additional noise. An edge-preserving diffusive filter was used for
removing this noise, while preserving structures and image sharpness [21]. We also standardized
the MR image intensities between a minimum and maximum value of 1 and 4095, by adopting the
MRI scale standardization approach [22].
6 Syed Muhammad Anwar et al.
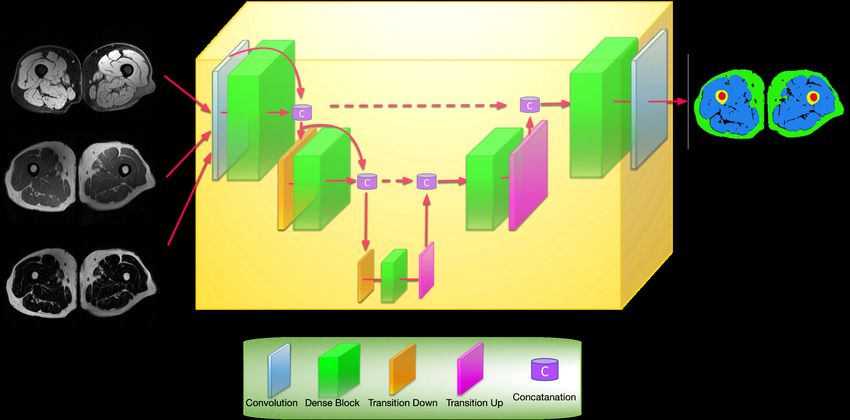
Tiramisu adopted with multi-contrast MRI Content of a
(a) (b)
and various dropouts. dense block.
Fig. 3: Tiramisu architecture with multi-contrast MR as input, and segmentation map as output.
Dropouts are embedded within dense blocks.
2.3 Supervised Segmentation
We created our proposed architecture based on a fully supervised nature before converting it into a
semi-supervised framework. The amount of labeled data plays a significant role in the performance
of the supervised approach (Figure 2). We addressed the lack of annotations (labels) for IMAT tissue
via a semi-supervised approach. The segmentation of the pre-processed thigh MR images was per-
formed using the densely-connected deep network architecture Tiramisu [23] (Figure 3). Tiramisu
follows an encoder-decoder structure and it was originally proposed for semantic segmentation of
natural images. The network architecture was composed of convolution layers, dense blocks, and
skip connections which were arranged in a down-sampling/up-sampling pipeline. In the dense block
(Figure 3 (b)), the information was enhanced by concatenation of layers, where each layer was
composed of batch-normalization, ReLU activation function, and convolution. Furthermore, three
variations of the Tiramisu network were designed: Tiramisu+R, Tiramisu+VD, and Tiramisu+TD,
where R, VD, and TD represent the regular, variational, and targeted dropout, respectively. Four
classes of tissues were segmented using the supervised setting including muscle, fat, bone, and bone-
marrow.Semi-Supervised Deep Learning for Multi-Tissue Segmentation from Multi-Contrast MRI 7
GT
(IMAT manual updated
IMAT non- GT
annotations) annotated
data
Pre-processing
(Multi-contrast Deep Learning Deep Learning
Deep Learning Framework Framework
Thigh MRI) Framework annotations segmented
segmented output
output
Step 1. Train from scratch Step 2. Run the network
Step 3. Train from scratch
with original GT and test to annotate non-annotated using the new GT and test
IMAT data
Fig. 4: The semi-supervised setting for dealing with scarcely labeled data for IMAT segmentation.
GT = ground truth.
2.4 Semi-supervised Segmentation
In medical image segmentation, semi-supervised learning is finding wider significance in tackling
the scarce availability of labeled data [24]. Subcutaneous adipose tissue and IMAT are separated
by the anatomical structure called fascia lata. Due to its low-water content, fascia lata has a low
signal intensity, and therefore is difficult to visualize or is distorted in MRI scans [25]. Expert an-
notation of the fascia lata (and as a result, IMAT identification) is challenging. For example, only
very small portion of our dataset have the IMAT annotations by expert radiologists. To take into
account the lack of ground truths for IMAT while targeting accurate segmentation of IMAT, we
designed a semi-supervised approach (Figure 4). We used the self-training process where the labels
were propagated from the labeled data to the unlabeled data. We used a three step process where
the unlabeled data was annotated using the proposed network. In the first step, the network was
trained with the scarcely labeled data (original ground truth) from experts. The trained model
was used to generate new annotations for IMAT (step 2). This new annotated data was added
to the originally available ground truth for training and testing (step 3) the system performance.
The semi-supervised approach was used to generate segmentation maps for fat, muscle, bone, bone
marrow, and IMAT.
2.5 Dropouts
The model capacity, hence complexity, increases quickly when neural networks become deeper and
can easily cause over-fitting problems. In this regard, dropout was introduced as a regularization
technique to sparsify deep networks to avoid over-fitting problems [26]. In regular dropout, one
of the dominant methods due to its simplicity, neural units are randomly dropped to prevent the
feature co-adaptation. The dropout function can be defined as,
Yl = (Xl )Wl ∈ i,j ∼ p(i,j ), (1)
where Yl is L × M output matrix at layer l, Xl is L × K input, and Wl is the K × M weight
matrix. is the noise sampled from a known probability distribution (usually Bernoulli). There is8 Syed Muhammad Anwar et al.
a lack of clarity regarding whether prior information can play a significant role in weight selection
for the dropout mechanism as opposed to random selection, especially in semi-supervised learning
where the lack of large amounts of training data require the selection procedure to be reconsidered
carefully.
One of the major drawbacks of regular dropout is a slower training time [26]. At the same time,
the set of dropped weights do not take into account any prior information. It has been shown that
the noise can be sampled from a continuous distribution, such as Gaussian, which gives better per-
formance [27]. Our objective related to dropout design was to increase robustness and speed of the
training procedure for segmentation, and provide an improved segmentation performance through
better generalization of the network. To achieve this, we have adapted variational and targeted
dropouts into the Tiramisu network to obtain benefits in convergence and robustness.
Variational Dropout (VD): As proposed in [28], VD is a generalization of Gaussian dropout
where the dropout rates are learned. In our semi-supervised learning paradigm, since we have limited
data, we argue that learning model parameters (such as dropout rates) can lead to better models.
In other words, instead of randomly picking weights to be dropped in a regular network, we propose
to use VD to achieve better efficiency and robustness. More specifically, given the input and output
datasets X = {x1 , x2 , .., xN } and Y = {y1 , y2 , .., yN }, we seek the posterior distribution p(ω|X, Y ),
by which we can predict output y ∗ for a new input point x∗ by solving the integral
Z
p(y ∗ |x∗ , X, Y ) = p(y ∗ |X ∗ , ω)p(ω|X, Y )dω. (2)
To obtain the posterior distributions, a Gaussian prior distribution N (0, I) can be placed over the
network weights leading to much faster convergence. The objective function is given as,
max L(w,α) − DKL (q(W )||p(W )), (3)
w,α
where DKL is the Kullback Leibler divergence loss, p(W) is the prior distribution (a Gaussian),
q(W) is the posterior distribution, and α is the variance of the Gaussian distribution.
Targeted Dropout (TD): A post-hoc pruning mechanism was proposed in [29], with the rationale
to make pruning part of the learning process for sparsity regularization for classification problems.
Given a neural network parameterized by Θ, the goal was to find the optimal parameters WΘ
such that the loss (L(WΘ )) was minimized. For efficiency and generalization reasons, |WΘ | ≤ k,
where only k weights of the highest magnitude in the network were employed. In this regard, a
deterministic approach is to drop the lowest |WΘ | − k weights. In TD, using a target rate γ and a
dropout rate p, first a target set T was generated with the lowest weights with the target rate γ.
Next, weights were stochastically dropped from the target set T with the dropout rate p. In our
study, we applied this strategy to pixel level classification where five different tissues were segmented
in thigh MRI.
3 Results
3.1 Deep Network Parameters
The Tiramisu network was used as a baseline segmentor, which contains 103 layers, composed of
approximately 9 million trainable parameters, and 35 million neurons. We used a soft-max cross-Semi-Supervised Deep Learning for Multi-Tissue Segmentation from Multi-Contrast MRI 9
entropy loss function and the learning rate was set to 0.00005 for initialization. Although the adam
optimizer was used with Xavier initializer, the bias term was initialized to zero. The ReLU activation
function was used along with batch normalization, and the batch size was set to 3. For the dense
blocks, we empirically found that a growth rate of 24 was comparably better than others. The
experiments were conducted on 2 Nvidia Titan-XP GPUs each with 12GB memory. We evaluated
the experiments using a 5-fold cross-validation strategy. For the supervised method, the split ratio
of the train, validation, and test sets was set to 70 : 10 : 20. For the semi-supervised method, in the
first step, the train and validation split ratio was set to 90 : 10, while in the second step (similar to
the supervised approach) the train, validation, and test split ratio was set to 70 : 10 : 20.
3.2 Supervised-Learning
The segmentation results using supervised learning were evaluated with conventional dice score,
Hausdorff distance, sensitivity, and specificity metrics. The results are presented in Table 2. We
analyzed the performance for 2-, 4-, and 5- tissue segmentation and found that all of our proposed
methods performed statistically similarly (p > 0.005) when the system is fully supervised. For 5-
tissue segmentation (including IMAT), a semi-supervised approach was used. With a greater number
of tissues in the segmentation task, the performance of muscle segmentation decreases. This may
be explained by the increased number of the classes to learn and also the increased correlation of
the tissues classified. In contrast, fat tissue does not have direct spatial correlation with bone and
bone marrow tissues. The results were also compared with a baseline method (U-net) using multi-
contrast MRIs. The method preforms well in some of the performance parameters, but our proposed
supervised methods outperforms in majority of the cases in dice scores (fat and bone-marrow),
sensitivity (muscle, fat, and bone-marrow), and specificity (muscle, fat, bone, and bone-marrow).
Whereas, our proposed semi-supervised method outperforms U-net in all performance parameters
with a significant margin for all tissues except for bone sensitivity which is slightly lower. This
highlights the fact that it was difficult to segment all tissues consistently with high performance,
which we have achieved here with our proposed semi-supervised method.
Results for regular dropout are reported for 2-tissue segmentation, whereas for 4-tissue seg-
mentation all three dropout results (regular (R), variational dropout (VD), and targeted dropout
(TD)) are reported. We observed that results for various parameters were mixed when choosing
among the dropouts. In general, Tiramisu with variational dropout (Tiramisu+VD) performance
was either better or comparable to Tiramisu with regular (Tiramisu+R) and targeted dropout
(Tiramisu+TD). A significant benefit of these dropouts was also observed in the convergence rate
and for semi-supervised learning. We concluded that variational dropout gives better performance
than regular and targeted dropout in thigh tissue segmentation and used it in the semi-supervised
setting.
3.3 Semi-supervised Learning
Experiments were conducted for 5-tissue segmentation including fat, muscle, bone, bone marrow,
and IMAT using variational dropout. For IMAT, annotating the fascia lata is a labor-intensive task.
For semi-supervised learning, images from 20 subjects were manually segmented using the Amira
software (AMIRA, Mercury Computer Systems, Berlin, Germany) by participating experts. We
first trained the Tiramisu network with the expert annotated scans for semi-supervised learning.10 Syed Muhammad Anwar et al.
Table 2: Summary of the segmentation performance for 4- and 5-tissue segmentation of thigh MRIs
(DSC = dice score).
Method Muscle Fat Bone Bone Marrow IMAT Metric (%)
97.52 94.61 95.93 96.83 80.14 DSC
5-Tissue Segmentation
97.11 92.89 99.36 95.69 88.15 Sensitivity
(Proposed Semi-supervised)
99.73 99.79 99.96 99.99 99.44 Specificity
94.67 90.92 - - - DSC
2-Tissue Segmentation
99.75 91.29 - - - Sensitivity
(Tiramisu+R)
99.71 93.64 - - - Specificity
87.37 89.89 89.26 86.01 - DSC
4-Tissue Segmentation
86.99 93.20 88.81 88.70 - Sensitivity
(U-net multi-contrast)
98.99 98.61 99.98 99.94 - Specificity
86.65 92.96 80.84 88.49 - DSC
4-Tissue Segmentation
86.99 94.14 78.90 89.53 - Sensitivity
(Tiramisu+R)
98.54 99.16 99.99 99.96 - Specificity
86.85 93.01 83.62 84.30 - DSC
4-Tissue Segmentation
90.30 93.20 85.08 83.42 - Sensitivity
(Tiramisu+VD)
98.26 99.25 99.98 99.97 - Specificity
80.48 92.03 82.01 79.97 - DSC
4-Tissue Segmentation
73.78 95.70 83.36 72.72 - Sensitivity
(Tiramisu+TD)
99.09 98.71 99.98 99.98 - Specificity
Next, we used the trained network to automatically label the rest of the non-annotated scans (from
20 subjects), which were then combined with the manually annotated ground truths for re-training
from scratch. The whole data set was then divided into 80% and 20% portions for training (images
from 40 subjects) and testing (images from 20 subjects), respectively. The results for performance
parameters using the semi-supervised approach are given in Table 2. We obtained mean dice scores
of 97.52%, 94.61%, 95.63%, 96.83%, and 80.14% for muscle, fat, bone, bone marrow, and IMAT
tissues, respectively. The sensitivity value for the IMAT tissue was lower than that for other tissues,
which revealed that IMAT remains the most challenging tissue to be segmented within the thigh
region. We also achieved significantly higher dice scores for muscle, fat, bone, and bone marrow
tissues using the semi-supervised approach, even higher than the 2- and 4-tissue segmentation using
the fully supervised setting. This demonstrates the effectiveness of our proposed semi-supervised
setting for these tissues (muscle, fat, bone, and bone marrow) as well as the challenging IMAT
tissue. The segmented images using our proposed methodology are shown in Figure 5 for both fully
supervised U-net (first row) method, the Tiramisu (second row) method, and semi-supervised (third
row) technique, along with the ground truth (GT) segmented images and the corresponding input
of multi-contrast MR scans. The input MRIs include fat suppressed (MRI1), water and fat (MRI2),
and water suppressed (MRI3) contrasts. The predictions include 4-tissues (muscle, fat, bone, and
bone marrow) in the first and second rows, and 5-tissues (muscle, fat, bone, bone marrow, and
IMAT) in the third row.Semi-Supervised Deep Learning for Multi-Tissue Segmentation from Multi-Contrast MRI 11
(A) (B) (C)
Water and
Fat
Fat
Suppressed
Water
Suppressed
GT
Prediction
Fig. 5: Multi-contrast thigh MRI scans with GT and predictions for tissue segmentation. (A) Mus-
cle, fat, bone, and bone marrow segmentation using U-net. (B) Muscle, fat, bone, and bone marrow
segmentation using our proposed method. (C) Muscle, fat, bone, bone marrow, and IMAT segmen-
tation using our proposed semi-supervised method.12
Muscle Fat Bone Bone Marrow
Method Input
DSC Sensitivity Specificity DSC Sensitivity Specificity DSC Sensitivity Specificity DSC Sensitivity Specificity
MRI1 75.96 72.94 97.93 82.26 87.92 95.37 71.74 70.04 99.97 66.79 67.03 99.87
MRI2 83.64 81.21 98.98 90.82 91.61 99.08 91.04 91.70 99.98 88.20 89.92 99.95
U-net
MRI3 86.01 85.51 98.88 91.56 89.64 99.39 81.55 83.77 99.96 76.69 78.99 99.91
Multi-contrast 87.39 86.99 98.99 89.89 93.20 98.61 89.26 88.81 99.98 86.06 88.70 99.94
MRI1 80.19 73.30 98.61 85.77 83.25 98.64 75.44 79.20 99.95 74.62 79.27 99.88
MRI2 78.71 83.54 97.06 84.74 81.33 98.97 91.48 90.94 99.98 90.10 93.57 99.95
Proposed
MRI3 84.98 89.63 97.78 91.59 88.82 99.54 74.84 74.96 99.96 72.39 75.05 99.89
Multi-contrast 86.85 90.30 98.26 93.01 93.20 99.25 83.62 85.08 99.98 84.30 83.42 99.97
Table 3: Summary of the segmentation performance using single and multi-contrast MRIs.
Syed Muhammad Anwar et al.Semi-Supervised Deep Learning for Multi-Tissue Segmentation from Multi-Contrast MRI 13
Image U-net Tiramisu
GT
MRI1
MRI2
MRI3
multi-contrast
Fig. 6: Examples of ground truth and segmented images with MRI1 (fat-suppressed), MRI2
(water-and-fat), MRI3 (water-suppressed) and multi-contrast inputs using first column U-net and
second column Tiramisu architectures.
4 Discussion
The segmentation of multiple tissues in thigh MRI scans is a challenging task due to lack of an-
notated data and the complex nature of the tissue distribution in the thigh region. In this study,
we have presented a semi-supervised deep learning to train segmentation network (Tiramisu) for
overcoming the limited availability of annotated data while segmenting multiple tissues with high
accuracy. Tiramisu architecture included 103 dense layers; hence, it provided a comprehensive com-
bination of low and high level imaging features for pixel level labeling with high precision. In our
experiments, we have used the U-Net [14] architecture to get the baseline results. In medical image
segmentation, U-Net has been widely used for a variety of radiology images and has been found to
perform well for MRI. It derives its name form the U-shaped architecture which follows an encoder-
decoder structure and differs from conventional convolutional neural networks (CNNs). We have
further experimented to verify the benefits of using multi-contrast MRI. In our experiments, we
have segmented thigh tissues using single-contrast as well as multi-contrast MRI scans with both
U-Net and the proposed architectures (Tiramisu) with results presented in Table 3.
4.1 Multi-contrast MRI Performs Better in Quantification
We have presented the segmentation of tissues in the thigh using multi-contrast MRI for the first
time to the best of our knowledge. We compared the results for segmentation using each single
contrast as well (i.e., using fat- suppressed, water-suppressed, and water and fat signal intensity14 Syed Muhammad Anwar et al. Fig. 7: Box plots showing a comparison of dice scores for muscle, fat, bone, and bone marrow tissues using: First column U-net with fat-suppressed (MRI1), water-and-fat (MRI2), water-suppressed (MRI3), and multi-contrast inputs. Second column Tiramisu with fat-suppressed (MRI1), water- and-fat (MRI2), water-suppressed (MRI3), and multi-contrast for inputs. MRIs individually). The results were evaluated using U-net (as a baseline) and the proposed archi- tecture. A summary of the performance parameters are given in Table 3. It is generally observed
Semi-Supervised Deep Learning for Multi-Tissue Segmentation from Multi-Contrast MRI               15

Fig. 8: Box plots showing a comparison of dice scores for muscle, fat, bone, and bone marrow tissues
using multi-contrast inputs to U-net and different variants of our proposed methods.

that multi-contrast MRIs as input to both U-Net and our proposed Tiramisu architectures perform
better in most instances. For bone and bone marrow, using MRI2 (water and fat) as the input gives
the highest dice scores, whereas for muscle and fat, the performance is better with multi-contrast
MRIs. These results are consistent with what we observed earlier (Table 2) where it was difficult
to find a single method that outperforms all other methods in this challenging task. It is important
to note that with multi-contrast inputs to our proposed Tiramisu architecture, the performance is
consistently high for all tissues. Based on these observations, we selected multi-contrast Tiramisu
for our proposed semi-supervised method, which has significantly higher performance than all other
methods we have compared here. Moreover, the results for the segmentation were compared with
ground-truth labels using Hausdorff distance (HD) at 95% (in mm) [30]. An average HD value of
1.10 (mm) was achieved using 95 percentile for the proposed semi-supervised framework. The values
for HD at 95 percentile for other methods used are presented in Table 4.
    A few examples of segmented images (4-tissue) using multi-contrast and single-contrast MRI
inputs: MRI1 (fat-suppressed), MRI2 (water and fat), and MRI3 (water suppressed), using U-Net
and our proposed architectures are shown in Figure 6. The performance is compared using the
dice score (Figure 7). The box-plots compare U-Net and tiramisu architectures in terms of single-
16 Syed Muhammad Anwar et al.
Fig. 9: Box plots showing dice scores for various tissues segmented using our proposed semi-
supervised method.
Method HD95 (mm)
Multi-contrast with U-NET 3.33
Multi-contrast with Tiramisu + R 4.27
Multi-contrast with Tiramisu + VD 2.81
Multi-contrast with Tiramisu + TD 3.46
Multi-contrast with semi-supervised 1.10
Table 4: Hausdorff distance based segmentation evaluations. Lower values indicate better perfor-
mance.
contrast and multi-contrast inputs. A comparison of U-Net based segmentation with our proposed
methods using multi-contrast input for fat, bone, bone marrow, and muscle are shown in Figure 8.
It is observed that our proposed tiramisu method with semi-supervision performs better in terms
of dice. The dice scores for all tissues including IMAT are shown in Figure 9, when semi-supervised
method was used. We observed small variance in the dice scores for all tissues except IMAT, which
shows the robustness of our proposed semi-supervised method.
4.2 Faster Convergence with Improved Dropouts
There was no significant difference (in terms of accuracy) in using different dropout mechanisms.
However, VD and TD demonstrated faster convergence compared to regular dropout. For regular
dropout, we observed convergence after 800 epochs, whereas for VD and TD, 200 epochs were
required. The convergence process for VD and TD was smoother as compared to regular dropout.
Similar patterns were observed for all tissues including muscle, fat, bone, bone marrow, and IMAT.
We also observed this significant improvement for all folds. Overall, the results for VD were superiorSemi-Supervised Deep Learning for Multi-Tissue Segmentation from Multi-Contrast MRI 17
Table 5: Comparison with state-of-the-art methods. DSC = dice score
Method DSC Tissue
Bocchieri et. al. (healthy) [15] 92.00
Bocchieri et. al. (patients) [15] 88.00
Fat
Irmakci et al. [17] 84.04
Proposed semi-supervised 94.61
Bocchieri et. al. (healthy) [15] 88.00
Bocchieri et. al. (patients) [15] 82.00
Irmakci et al. [17] 87.18 Muscle
Yao et al. [31] 96.90
Proposed semi-supervised 97.52
Yao et al. [31] 74.80
IMAT
Proposed semi-supervised 80.14
to the results for both regular and TD, and therefore VD was chosen for our semi-supervised
method. The segmentation results with the semi-supervised method using VD reveals a significant
improvement over the state-of-the-art with mean dice scores of 97.52%, 94.61%, 80.14%, 95.93%,
and 96.83% for muscle, fat, IMAT, bone, and bone marrow tissues, respectively.
4.3 Performance Comparison
We compared the proposed strategy with the state-of-the-art methods (as summarized in Table 5)
and showed that our semi-supervised deep learning algorithm outperformed them by a significant
margin, especially with IMAT segmentation. It is important that a single model was able to segment
all five tissues with such high performance. A deep learning framework was used for a small cohort
of subjects for generating segmentation maps of fat and muscle tissue using thigh MRI scans [15].
The results were reported separately for healthy subjects and patients suffering from limb girdle
dystrophy. The dice scores for both fat and muscle tissue are significantly lower as compared to our
proposed methodology. A fuzzy connectivity based method (previous state-of-the-art method) was
proposed for thigh tissue segmentation using MRI scans [17], where the same dataset (from BLSA)
was used for evaluating the system. In comparison, our proposed method outperforms the fuzzy
connectivity based method in dice score by a large margin for both muscle and fat segmentation.
IMAT segmentation was not addressed in this study. For muscle and IMAT, our proposed method
clearly outperforms [31], which adopted a holistic neural network approach for muscle and IMAT
segmentation. The results are particularly promising for IMAT, which is more challenging in terms
of segmentation. These results will be used in future to detect fat infiltration within the muscle,
which is of significance in aging and muscular atrophy studies.
5 Conclusion
To the best of our knowledge, previous studies have not dealt with addressing all tissues in the thigh
region with deep learning. Also, until now, semi-supervised deep learning and multi-contrast MRI
scans have not been combined to solve the thigh tissue segmentation problem yet. In this regard,18 Syed Muhammad Anwar et al.
our proposed semi-supervised deep learning based segmentation strategy is novel and its success
has been demonstrated with a comprehensive set of experiments. In our study, we also revisited the
dropout concept in deep learning, and showed the use of targeted and variational dropout functions
for faster convergence and more robust segmentation. These gains were possible due to better
objective function and statistical weight selection in dropout targets. We empirically observed that
such inference-based dropout methods were better suited for challenging segmentation tasks when
labeled data was scarce. We successfully segmented five tissues in thigh MRIs with our proposed
end-to-end semi-supervised approach giving state-of-the-art results. A notable performance was
achieved for IMAT (dice score: 80.14%, sensitivity: 88.15%, specificity: 99.44%), which is a very
challenging tissue to segment. Our future studies will include exploration of the underlying theory
behind statistical selection strategies for regularization and semi-supervised deep learning.
6 Author contributions
UB is the PI of the project as a part of the larger effort for creating Musculoskeletal AI in multiple
institutes, agreed by the participating institutes’ PIs: MA, JE, CA, SJ, and DAT. SMA structured
the overall experiments and discussions while II, SJ, and SMA ran the image analysis pipelines
and deep learning experiments. UB, SJ, DAT, JE, MA, GZP, and SMA analyzed the results, and
evaluated the clinical relevance, reproducibility, and feasibility of the proposed method(s). DAT
and JE participated to the study as radiologists while CA and SJ contributed as MRI physicists.
All authors wrote and edited the manuscript, and agreed on the content prior to submission.
7 Competing interests
The authors declare no competing interests.
8 Data Availability
The data sets generated during and/or analyzed during the current study are available from the
BLSA with research agreement [2].
9 Acknowledgment
We would like to acknowledge the Baltimore Longitudinal Aging Study (BLAS) for providing the
data set used in this study. We would also like to thank NVIDIA for donating a Titan X GPU for
our experiments.
References
1. B.H. Goodpaster, S. Krishnaswami, H. Resnick, D.E. Kelley, C. Haggerty, T.B. Harris, A.V. Schwartz,
S. Kritchevsky, A.B. Newman, Association between regional adipose tissue distribution and both type 2 dia-
betes and impaired glucose tolerance in elderly men and women, Diabetes care 26(2), 372 (2003)Semi-Supervised Deep Learning for Multi-Tissue Segmentation from Multi-Contrast MRI 19
2. BLSA, Longitudinal study of muscle strength, quality, and adipose tissue infiltration, The American Journal
of Clinical Nutrition 90(6), 1579 (2009). DOI 10.3945/ajcn.2009.28047. URL https://doi.org/10.3945/ajcn.
2009.28047
3. M.W. Hamrick, M.E. McGee-Lawrence, D.M. Frechette, Fatty infiltration of skeletal muscle: mechanisms and
comparisons with bone marrow adiposity, Frontiers in endocrinology 7, 69 (2016)
4. M.M. Porter, A.A. Vandervoort, J. Lexell, Aging of human muscle: structure, function and adaptability, Scan-
dinavian journal of medicine & science in sports 5(3), 129 (1995)
5. T. Loughran, D.M. Higgins, M. McCallum, A. Coombs, V. Straub, K.G. Hollingsworth, Improving highly accel-
erated fat fraction measurements for clinical trials in muscular dystrophy: origin and quantitative effect of r2*
changes, Radiology 275(2), 570 (2015)
6. M. Gadermayr, C. Disch, M. Müller, D. Merhof, B. Gess, A comprehensive study on automated muscle segmen-
tation for assessing fat infiltration in neuromuscular diseases, Magnetic resonance imaging 48, 20 (2018)
7. J.M. Morrow, C.D. Sinclair, A. Fischmann, P.M. Machado, M.M. Reilly, T.A. Yousry, J.S. Thornton, M.G. Hanna,
Mri biomarker assessment of neuromuscular disease progression: a prospective observational cohort study, The
Lancet Neurology 15(1), 65 (2016)
8. Á.N. Mhuiris, T. Volken, J.M. Elliott, M. Hoggarth, D. Samartzis, R.J. Crawford, Reliability of quantifying the
spatial distribution of fatty infiltration in lumbar paravertebral muscles using a new segmentation method for
t1-weighted mri, BMC musculoskeletal disorders 17(1), 234 (2016)
9. J. Díaz-Manera, J. Llauger, E. Gallardo, I. Illa, Muscle mri in muscular dystrophies, Acta Myologica 34(2-3), 95
(2015)
10. S.M. Anwar, M. Majid, A. Qayyum, M. Awais, M. Alnowami, M.K. Khan, Medical image analysis using convo-
lutional neural networks: a review, Journal of medical systems 42(11), 226 (2018)
11. S. Hussain, S.M. Anwar, M. Majid, Segmentation of glioma tumors in brain using deep convolutional neural
network, Neurocomputing 282, 248 (2018)
12. S. Hussein, P. Kandel, C.W. Bolan, M.B. Wallace, U. Bagci, Lung and pancreatic tumor characterization in the
deep learning era: novel supervised and unsupervised learning approaches, IEEE transactions on medical imaging
(2019)
13. M. Gadermayr, K. Li, M. Müller, D. Truhn, N. Krämer, D. Merhof, B. Gess, Domain-specific data augmentation
for segmenting mr images of fatty infiltrated human thighs with neural networks, Journal of Magnetic Resonance
Imaging (2019)
14. O. Ronneberger, P. Fischer, T. Brox, in International Conference on Medical image computing and computer-
assisted intervention (Springer, 2015), pp. 234–241
15. A.E. Bocchieri, V.S. Parekh, K.R. Wagner, S.A.V. Braverman, D.G. Leung, M.A. Jacobs, Multiparametric deep
learning tissue signatures for muscular dystrophy: Preliminary results (2019)
16. S. Makrogiannis, K.W. Fishbein, A. Moore, R. Spencer, L. Ferrucci, Image-based tissue distribution modeling
for skeletal muscle quality characterization, IEEE Transactions on Biomedical Engineering 63(4), 805 (2016)
17. I. Irmakci, S. Hussein, A. Savran, R.R. Kalyani, D. Reiter, C.W. Chia, K. Fishbein, R.G. Spencer, L. Ferrucci,
U. Bagci, A novel extension to fuzzy connectivity for body composition analysis: Applications in thigh, brain,
and whole body tissue segmentation, IEEE Transactions on Biomedical Engineering (2018)
18. L. Ferrucci, The baltimore longitudinal study of aging (blsa): A 50-year-long journey and plans for the future,
Journals of Gerontology - Series A Biological Sciences and Medical Sciences 63(12), 1416 (2008)
19. F. Lugauer, D. Nickel, J. Wetzl, S.A. Kannengiesser, A. Maier, J. Hornegger, in International Conference on
Medical Image Computing and Computer-Assisted Intervention (Springer, 2015), pp. 667–674
20. N.J. Tustison, B.B. Avants, P.A. Cook, Y. Zheng, A. Egan, P.A. Yushkevich, J.C. Gee, N4itk: improved n3 bias
correction, IEEE transactions on medical imaging 29(6), 1310 (2010)
21. V. Aurich, J. Weule, in Mustererkennung 1995 (Springer, 1995), pp. 538–545
22. L.G. Nyúl, J.K. Udupa, X. Zhang, New variants of a method of mri scale standardization, IEEE transactions on
medical imaging 19(2), 143 (2000)
23. S. Jégou, M. Drozdzal, D. Vazquez, A. Romero, Y. Bengio, in Proceedings of the IEEE Conference on Computer
Vision and Pattern Recognition Workshops (2017), pp. 11–19
24. V. Cheplygina, M. de Bruijne, J.P. Pluim, Not-so-supervised: A survey of semi-supervised, multi-instance, and
transfer learning in medical image analysis, Medical Image Analysis 54, 280 (2019). DOI https://doi.org/10.
1016/j.media.2019.03.009. URL http://www.sciencedirect.com/science/article/pii/S1361841518307588
25. S. Orgiu, C.L. Lafortuna, F. Rastelli, M. Cadioli, A. Falini, G. Rizzo, Automatic muscle and fat segmentation
in the thigh from t1-weighted mri, Journal of Magnetic Resonance Imaging 43(3), 601 (2016)
26. N. Srivastava, G. Hinton, A. Krizhevsky, I. Sutskever, R. Salakhutdinov, Dropout: a simple way to prevent neural
networks from overfitting, The Journal of Machine Learning Research 15(1), 1929 (2014)
27. A. Neelakantan, L. Vilnis, Q.V. Le, I. Sutskever, L. Kaiser, K. Kurach, J. Martens, Adding gradient noise
improves learning for very deep networks, arXiv preprint arXiv:1511.06807 (2015)20 Syed Muhammad Anwar et al.
28. D.P. Kingma, T. Salimans, M. Welling, in Advances in Neural Information Processing Systems (2015), pp.
2575–2583
29. A.N. Gomez, I. Zhang, K. Swersky, Y. Gal, G.E. Hinton, Learning sparse networks using targeted dropout, arXiv
preprint arXiv:1905.13678 (2019)
30. D.P. Huttenlocher, G.A. Klanderman, W.J. Rucklidge, Comparing images using the hausdorff distance, IEEE
Transactions on pattern analysis and machine intelligence 15(9), 850 (1993)
31. J. Yao, W. Kovacs, N. Hsieh, C.Y. Liu, R.M. Summers, in MICCAI (2017), pp. 737–745You can also read