Health Effects of Alternate Day Fasting Versus Pair-Fed Caloric Restriction in Diet-Induced Obese C57Bl/6J Male Mice - Frontiers
←
→
Page content transcription
If your browser does not render page correctly, please read the page content below
ORIGINAL RESEARCH
                                                                                                                                               published: 26 February 2021
                                                                                                                                          doi: 10.3389/fphys.2021.641532

                                                Health Effects of Alternate Day
                                                Fasting Versus Pair-Fed Caloric
                                                Restriction in Diet-Induced Obese
                                                C57Bl/6J Male Mice
                                                Chloe G. Henderson, Damian L. Turner and Steven J. Swoap*
                                                Department of Biology, Williams College, Williamstown, MA, United States

                                                Alternate day fasting (ADF) induces weight loss and improves various markers of health
                                                in rodents and humans. However, it is unclear whether the benefits of ADF are derived
                                                from the lower caloric intake of ADF or from the 24-h fasting period. Therefore, this study
                                                directly compared selected markers for health – such as glucose control, body weight,
                                                liver triglycerides, T cell frequencies, and others – in high-fat (60% calories from fat)
                                                diet-induced obese mice subjected to either ADF or caloric restriction (CR). Obese mice
                           Edited by:
                                                were randomly assigned to one of four groups: (1) ADF: remained on the high-fat diet,
                 Jean-Pierre Montani,           but fed on alternate days (n = 5), (2) PF: remained on the high-fat diet, but pair-fed to
   Université de Fribourg, Switzerland          the ADF group (n = 5), (3) LF: moved to a chow ad libitum diet (n = 5; 17% calories from
                       Reviewed by:             fat), and (4) HF: remained on the high-fat ad libitum diet (n = 5). An additional group of
                          Jaap Keijer,
Wageningen University and Research,             non-obese mice maintained on a chow diet since weaning were used as controls (CON:
                          Netherlands           n = 5). After 10 weeks, ADF, PF, and LF mice ate fewer kcals, had a lower body mass,
                  Femke Hoevenaars,
 Netherlands Organisation for Applied
                                                had smaller epididymal fat pads, improved glucose tolerance, and had a lower hepatic
     Scientific Research, Netherlands           triglyceride content relative to HF mice (p < 0.05), but none reached that of CON mice
                      Daniel L. Smith,          in these measures. T cell frequencies of the spleen, blood, and mesenteric lymph nodes
University of Alabama at Birmingham,
                        United States           were reduced in ADF, PF, and HF compared to the CON group. Importantly, there were
                   *Correspondence:             no significant differences between the ADF and PF groups in any of the measurements
                     Steven J. Swoap            made in the current study. These data suggest that ADF, PF, and LF diets each lead to
                 sswoap@williams.edu
                                                improved markers of health relative to high-fat diet-induced obese mice, and that the
                   Specialty section:           caloric restriction associated with ADF is the major factor for the noted improvements.
         This article was submitted to
                                                Keywords: ADF, CR, high-fat diet, intermittent fast, obesity, glucose
                Integrative Physiology,
               a section of the journal
               Frontiers in Physiology
       Received: 14 December 2020               INTRODUCTION
        Accepted: 05 February 2021
       Published: 26 February 2021              Intermittent fasting can induce weight loss, improve glucose control, and improve lipid profiles
                              Citation:
                                                among other physiological improvements in both humans and rodents (Varady and Hellerstein,
         Henderson CG, Turner DL and            2007; Bhutani et al., 2013; Varady et al., 2013; Catenacci et al., 2016; Dedual et al., 2019). Alternate
       Swoap SJ (2021) Health Effects           day fasting (ADF) is a form of intermittent fasting defined by alternating days of fasting (with
        of Alternate Day Fasting Versus         full access to water and other calorie-free beverages) and ad libitum eating. ADF is an effective
            Pair-Fed Caloric Restriction
in Diet-Induced Obese C57Bl/6J Male
      Mice. Front. Physiol. 12:641532.          Abbreviations: ADF, alternate day fasting; AUC, area under the curve; CR, caloric restriction; GTT, glucose tolerance test;
     doi: 10.3389/fphys.2021.641532             HF, high fat; LF, low fat; IAGT, insulin assisted glucose tolerance test; NAFLD, non-alcoholic fatty liver disease.

Frontiers in Physiology | www.frontiersin.org                                          1                                        February 2021 | Volume 12 | Article 641532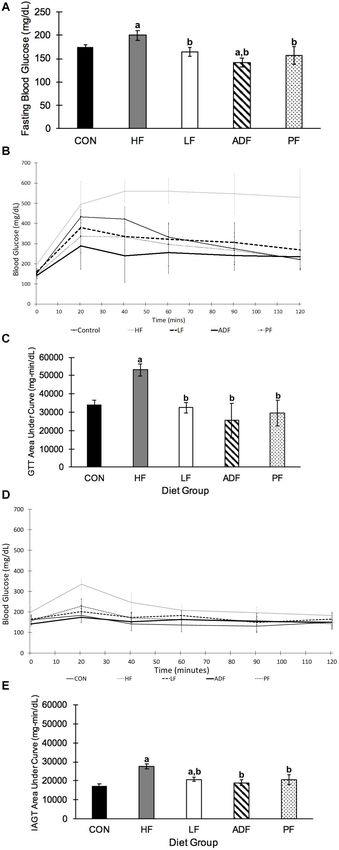
Henderson et al.                                                                                                                    ADF vs. CR in Mice

form of intermittent fasting that leads to weight loss, specifically         possibly contributing to fatty liver disease when present in excess
fat mass (Varady et al., 2011; Baumeier et al., 2015; Catenacci              (Vozarova et al., 2001; Senn et al., 2002; Emerson et al., 2017).
et al., 2016; Joslin et al., 2017; Trepanowski et al., 2017; Gabel           Diet-induced obesity has been associated with impaired immune
et al., 2019; Parvaresh et al., 2019), improved glucose control and          responses and reduced numbers of memory T cells in response
insulin sensitivity (Halberg et al., 2005; Heilbronn et al., 2005;           to infection (Smith et al., 2007; Karlsson et al., 2010). Therefore,
Yang et al., 2016; Swoap et al., 2019), and lowered circulating              we sought to determine whether there were systemic changes in
lipids and cholesterol in both rodents and humans (Mahoney                   the frequencies of T cell populations in circulation and within
et al., 2006; Bhutani et al., 2013; Varady et al., 2015). In rodent          lymphoid organs as a result of the various diets. Overall, we
models, ADF has also been shown to increase cancer survival                  employed a diverse panel of these health markers as above to
(Descamps et al., 2005; Varady et al., 2009; Xie et al., 2017),              examine the potential differences between the dieting strategies
increase mean and maximal life span (Anson et al., 2003;                     of ADF and pair-fed CR.
Descamps et al., 2005), and reduce the effects of specific diseases
such as asthma (Johnson et al., 2007). Importantly, ADF is a form
of caloric restriction (CR) in that over 2 days, an individual will          MATERIALS AND METHODS
consume less than they would by eating ad libitum for 2 days
(Anson et al., 2003; Caro et al., 2008; Catenacci et al., 2016; Joslin       Animals and Animal Diets
et al., 2017; Trepanowski et al., 2017). Because the ADF is a form           Thirteen-week-old diet-induced obese C57BL/6J male mice were
of CR, a pair-fed group is also a form of CR.                                delivered to Williams College from Jackson Laboratory (Stock
    Continuous CR has long been known to have similar beneficial             No: 380050; Bar Harbor, Maine). At 6 weeks of age, these mice
metabolic and health effects as ADF (Spindler, 2010; Speakman                had been placed on a high-fat diet to induce obesity (60% of
and Mitchell, 2011). One question that remains open is whether               calories from fat, 20% from carbohydrates, and 20% from protein
the health improvements from ADF derive from the decreased                   with a caloric density of 5.2 kcal/g, Research Diets D12492). Upon
caloric intake over a 48-h period, or from the extended fasting              arrival at Williams College, the mice remained on the high-fat
period on the fasting day. One mouse study showed lower fasting              diet and were given 5 days to acclimate to the vivarium before the
glucose and insulin in ADF mice as compared to both control and              onset of the experimental diets. Thereafter, the mice were weight-
pair-fed mice (Anson et al., 2003). Human studies that directly              matched and allocated into four diet regimens (n = 5 per group):
compare ADF with CR have found similar weight loss effects                   (1) high-fat diet ADF. ADF treatment was defined by 24 h of
(Varady et al., 2011; Catenacci et al., 2016; Trepanowski et al.,            ad libitum feeding followed by 24 h of fasting. The amount of
2017; Gabel et al., 2019). Some such studies show ADF as superior            food provided at the dark phase was weighed, as was the amount
to daily CR for health benefits that include lowered systolic blood          of food removed at the onset of the dark phase on the next
pressure and fasting plasma glucose (Gabel et al., 2019; Parvaresh           day to calculate food consumption. (2) High-fat pair-fed (PF).
et al., 2019). Other measures have been shown to not differ                  The food consumed from all members of the ADF group was
between ADF and CR in adults; these include body composition                 averaged from their fed day. The PF group then received half of
(in terms of total fat and lean muscle mass), serum cholesterol,             this amount on each of the next 2 days, such that they were pair-
HDL, LDL, triglycerides, insulin sensitivity, blood pressure, heart          fed over a 48-h period. The PF group was always 2 days behind the
rate, fasting insulin, fasting glucose, C-reactive protein, and              other experimental groups. The PF group was provided food at
homocysteine (Catenacci et al., 2016; Trepanowski et al., 2017;              the onset of the dark phase on each day. (3) Chow food ad libitum
Gabel et al., 2019). Therefore, the differential health benefits of          (LF). The chow food, considered a low-fat food, contained 17% of
CR, by means of pair-feeding, compared to ADF remain unclear.                calories from fat sources, 58% from carbohydrates, and 25% from
    While the mouse is only a model for human responses to                   protein with a caloric density of 3.1 kcal/g (Envigo Teklad LM-
diet manipulation, the mouse model allows for precise pair-                  485). (4) High-fat food ad libitum (HF). The mice in this group
feeding to examine whether the benefits of ADF are a result of               were maintained on the high-fat food throughout the duration
the extended fast or from the reduction in caloric intake. We                of the experiment. Concurrently, a group (CON: n = 5) of 14-
have previously shown that obese high-fat fed male C57Bl/6J                  week-old male C57BL/6J mice were raised at Williams College
mice have significant health gains (in terms of body weight                  after two breedings from parents purchased from Jackson Labs,
(BW) and glucose regulation) when they undergo ADF while                     and had ad libitum access to the low-fat chow diet before and
continuing on the high-fat diet (Joslin et al., 2017). Given the             throughout the study as a control (Envigo Teklad LM-485). Food
prevalent association of glucose dysregulation with obesity, many            intake and BW were measured daily in the hour before the onset
measures of glucose regulation [e.g., fasting blood levels, glucose          of the dark phase. All mice were singly housed in clear, standard,
tolerance tests, insulin-assisted glucose tolerance tests (IAGTs)]           polycarbonate mouse cages with metal wire tops, maple sani-
are used to assess the efficacy of ADF and CR (Varady et al.,                chip bedding (Envigo Teklad 7090), shredded paper (EnviroDri)
                                                                                 R

2010; Baumeier et al., 2015; Hatting et al., 2017; Smith et al.,             for nesting, and ad libitum access to water. Cages were sustained
2019; Swoap et al., 2019). Plasma corticosterone and IL6, markers            in a 12:12 h light:dark phase at 23◦ C. Only male mice were used
of stress and inflammation, respectively, have been shown to                 for two reasons: (1) because their metabolic response to a HF
increase with a high-fat diet (Emerson et al., 2017; Appiakannan             diet is substantially more pronounced than the female response
et al., 2019). Additionally, IL6 has been shown to play a role               to a HF diet, and (2) the epididymal fat pad is easily isolated
in insulin resistance in both animals and humans while also                  from males. All experimental treatment was approved by the

Frontiers in Physiology | www.frontiersin.org                            2                                   February 2021 | Volume 12 | Article 641532
Henderson et al. ADF vs. CR in Mice
Williams College Institutional Animal Care and Use Committee San Diego, CA, United States) for 2 min and then resuspended
and complied with the Guide for the Care and Use of Laboratory in RPMI media. Mesenteric lymph nodes were mechanically
Animals (protocol # SS-N-17). disrupted in RPMI media alone. Cell pellets from blood samples
were resuspended in red blood cell lysing buffer (Biolegend, San
Glucose Tolerance Test and Diego, CA, United States), incubated for 2 min, centrifuged, then
Insulin-Assisted Glucose Tolerance Test incubated in lysis buffer a second time. Cell suspensions from all
A Glucose Tolerance Test (GTT) was performed on each mouse tissues were filtered through 100 µm nylon mesh and aliquots
from all diet regimens at 20 weeks of age, 6 weeks into the containing 1 × 10⁶ – 5 × 10⁶ cells stained with the fluorescently
feeding paradigm, as described by Schindler et al. (2014). At conjugated antibodies: CD4 (Pacific. Blue), CD8 (PE), and CD3
the onset of the light phase, 6 h before testing, mice were (BV785) (Biolegend, San Diego, CA, United States). Samples were
weighed with continued ad libitum access to water, and food analyzed using a Beckman Cytoflex flow cytometer and analyzed
was removed. After the 6-h fast, each mouse had its tail nipped using Flowjo flow cytometry analysis software (FlowJo LLC, OR).
with a disposable sterile surgical blade. The drop of blood from
the tail was used to measure fasting blood glucose concentration Blood Analytes
(t = 0) with a glucometer (Nova Max Plus). Immediately after, Plasma corticosterone concentrations were measured using
the mouse was intraperitoneally injected with 1 g glucose/kg of the Mouse Corticosterone ELISA Kit (Arbor Assays , Ann R
BW in 0.1–0.2 cc of sterile saline. Blood glucose concentrations Arbor, Michigan) according to the manufacturer’s instructions.
were measured at 20, 40, 60, 90, and 120 min after injection. Plasma and liver homogenate triglyceride concentrations were
An IAGT was performed on each mouse from each diet group measured using the Triglyceride Colorimetric Assay Kit (Cayman
at 23 weeks of age, 9 weeks into the feeding paradigm, as Chemical, Ann Arbor, Michigan) according to the manufacturer’s
previously described (Reynolds et al., 2009; Joslin et al., 2017). instructions. Frozen livers were homogenized in NP40 Substitute
The same 6 h fasting protocol from the GTT was followed, except Assay Reagent from the Triglyceride Colorimetric Assay Kit,
that the mice were intraperitoneally injected with a cocktail of centrifuged at 10,000 × g for 10 min, and triglycerides were
glucose (1 g/kg BW) and insulin (0.75 U/kg BW; Sigma Aldrich measured in the supernatant according to the manufacturer’s
I0908) in 0.1–0.2 cc of sterile saline. Thereafter, blood glucose instructions. Plasma interleukin 6 (IL6) concentrations were
concentration measurements were taken at t = 20, 40, 60, 90, and determined using a Mouse IL-6 ELISA Kit (RayBio , Norcross,
R
120 min after injection. The area under the curve measurement Georgia) following the manufacturer’s instructions.
(AUC) was calculated in Excel by adding two consecutive data
points, dividing by two, and multiplying by the difference in time Statistical Data Analysis
per the formula [(B1 + B2)/2) × (A2−A1)] where column A All results are expressed as means ± standard deviation.
contains the time in minutes and column B contains the blood Statistical analyses were performed in SPSS 25.0 to conduct
glucose measurement at that time. This formula was applied 1 × 5 ANOVAs, followed by LSD post hoc testing on all variables
to the full duration of the blood glucose test and values were except kcal consumed. For this test, we used a 1 × 4 ANOVA
summed to calculate the total AUC. and left out the PF group as the food given to this group was
not a measured variable. A non-paired student T-test was used
to analyze initial BWs. Only p-values < 0.05 were reported as
Blood and Tissue Collection
statistically significant.
Mice were euthanized while under 4% isoflurane anesthesia
after 10 weeks of their specified diet treatment. ADF mice were
euthanized after a fed day. All mice were fasted for 6 h before RESULTS
euthanasia. Blood was withdrawn from the left ventricle of the
heart into a syringe pretreated with EDTA, transferred to a Body Weight and Food Intake
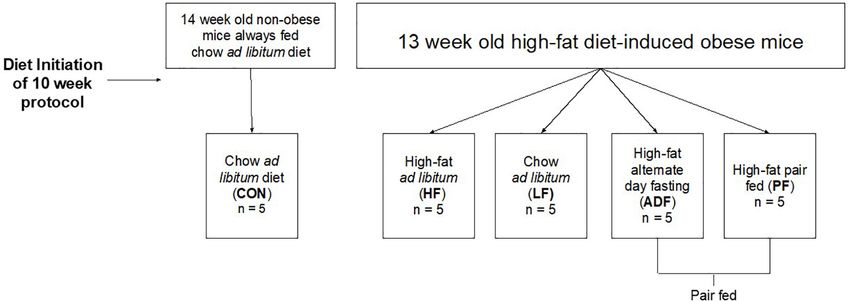
1.7-ml microcentrifuge tube, and centrifuged at 10,000 × g for At the onset of the dietary manipulations (see Figure 1 for
2 min. Plasma was aliquoted into several tubes, flash-frozen in a schematic), the mice consuming the high-fat diet weighed
liquid nitrogen, and stored at –80◦ C. The cellular component of 41.0 ± 3.3 g, significantly more than those consuming the chow
the blood was treated as below. Liver lobes and epididymal fat diet, 24.0 ± 2.5 g (p < 0.05). After initiation of the dietary
pads were excised, flash frozen in liquid nitrogen, and stored manipulation on the high-fat fed mice, BW rapidly decreased
at –80◦ C. Epididymal fat pads were also weighed immediately for the three experimental diet regimens (ADF, PF, and LF)
after excision. The spleen and mesenteric lymph nodes were (Figure 2A). Roughly 2 to 3 weeks into the dietary manipulation,
dissected and processed immediately as described below. BWs for all of the groups stabilized and were maintained
throughout the remainder of the study, except for BW of the
Preparation of Cell Suspensions and HF group which continued to increase throughout all 10 weeks
Flow Cytometric Analysis (Figure 2A). At the end of 10 weeks, the BW of CON and HF
Spleens were mechanically disrupted using the cap of an groups were statistically significant from all of the experimental
Eppendorf tube to grind tissue against a piece of 100 µm nylon diet regimens and from each other (p < 0.05) (Figure 2B). BW
mesh that was placed in a petri dish. The disrupted spleen tissue differences among the experimental diet regimens at the end of
was then incubated in red blood cell lysing buffer (Biolegend, the 10 weeks were not significant from each other (Figure 2B).
Frontiers in Physiology | www.frontiersin.org 3 February 2021 | Volume 12 | Article 641532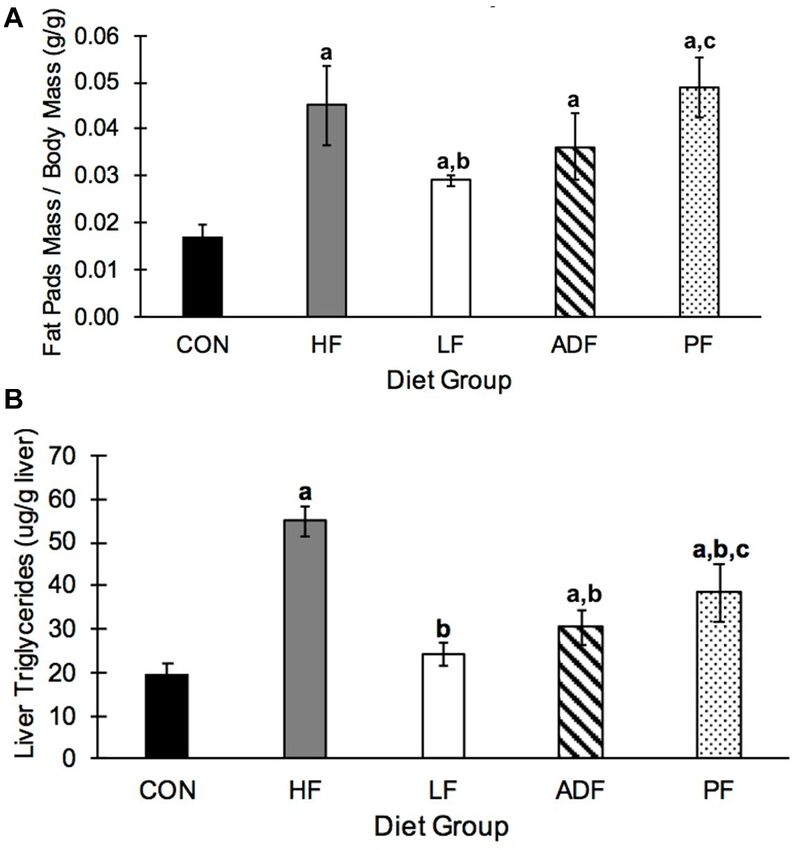
Henderson et al.                                                                                                                                    ADF vs. CR in Mice

  FIGURE 1 | Schematic of experimental grouping.

  FIGURE 2 | Changes in body weight. (A) Body weight over 10 weeks of designated diet. Mice on the high-fat diet leading up to the dietary manipulation weighed
  41.0 ± 3.3 g. The alternate-day-fast on a high-fat diet (ADF: green) and the switch to ad libitum chow diet (LF: pink) commenced at Day 0, whereas the pair fed
  group (PF: purple) that received the same amount of high-fat food as the ADF, began on Day 2. The other two groups of mice were those that remained ad libitum on
  the high-fat diet (HF: blue), and the mice that were maintained on an ad libitum chow diet (CON: black). The daily variation in BW of the ADF group was due to
  alternating days of feeding and fasting. Mice were weighed daily in the hour before the onset of the dark phase. (B) Body Weight on last experimental day. Alternate
  day fasting, caloric restriction, and switching to a chow ad libitum diet all led to a significantly lower BW as compared to the BW of HF ad lib diet-induced obese
  mice. Body weights shown are after a 6 h fast and after a fed day for ADF mice on the last experimental day. a: p < 0.05 vs. CON; b: p < 0.05 vs. HF.

Frontiers in Physiology | www.frontiersin.org                                      4                                        February 2021 | Volume 12 | Article 641532
Henderson et al. ADF vs. CR in Mice
Over the 10-week experimental period, HF mice ate Epididymal Fat Pads Mass and Liver
significantly more kcals than all of the other groups (Figure 3). Triglycerides
CON, ADF, and LF did not consume significantly different
Epididymal fat pads mass varied widely among the groups
amounts of kcals from each other (Figure 3). By definition, the
(Figure 5A). HF (2.24 ± 0.73 g) and PF (1.81 ± 0.31 g) mice
PF group consumed the identical caloric intake as the ADF group,
had significantly heavier epididymal fat pads than all other groups
and therefore was excluded from the statistical analysis here. It is
(CON: 0.48 ± 0.19 g; LF: 0.96 ± 0.14 g; ADF: 1.25 ± 0.22 g),
important to note that the experimental mice that were initially
but not from each other. When epididymal fat pad masses were
obese from the high-fat diet all continued to weigh more than
normalized to control for BW, CON mice had a lower relative fat
CON mice (Figure 2) despite eating the same number of calories
pads mass than all of the other groups (Figure 5A). Only mice in
over the 10-week period (Figure 3).
the LF group had smaller relative fat pad mass as compared to the
HF group (p = 0.044). The relative fat pad mass from PF mice was
Blood Glucose, Glucose Tolerance Test, not significantly different from that of the ADF mice (p = 0.080).
and Insulin-Assisted Glucose Tolerance Liver triglycerides were measured in liver homogenates. HF
Test mice had significantly more hepatic triglycerides than all other
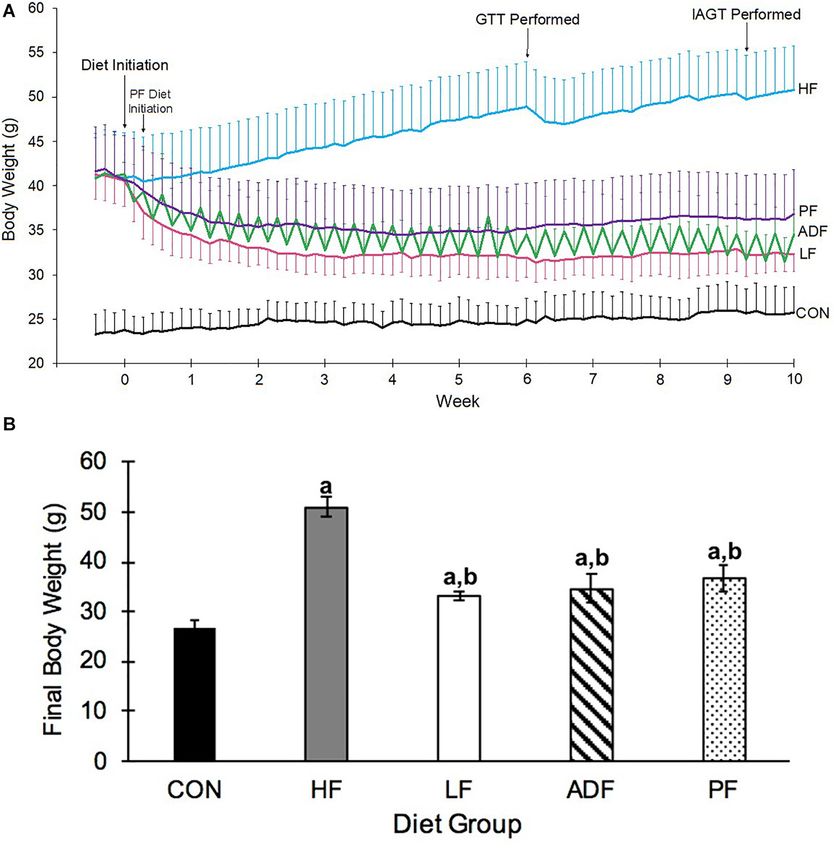
After 6 weeks of the dietary treatment, fasting blood glucose diet regimens (Figure 5B). The two groups of mice consuming
was significantly lower in all of the groups as compared to chow food, the CON group and the LF ad libitum group, had
the HF mice (Figure 4A). ADF mice had a significantly lower lower liver triglycerides than all of the groups on the high-fat
blood glucose from CON mice, but no different to any of the food, except ADF. The liver triglyceride content was not different
other groups (Figure 4A). In the glucose tolerance test (GTT), between the PF group and the ADF group (Figure 5B).
the HF mice were the least glucose tolerant with the greatest
area-under-the-curve (AUC) measurement, statistically higher T Cell Frequency in the Spleen, Blood,
than each of the other groups (Figures 4B,C). There were no and Mesenteric Lymph Nodes
differences among the ADF, PF, LF, and CON groups for the Single cell suspensions derived from spleen, blood, and
GTT AUC (Figure 4C). However, the peak blood glucose value mesenteric lymph nodes were stained with T cell specific
during the GTT for the ADF group (289 ± 117 mg/dl) was antibodies and analyzed by flow cytometry. T cell frequencies
significantly lower than that of the CON (439 ± 50 mg/dl), in the spleen, blood, and mesenteric lymph nodes were reduced
HF (574 ± 42 mg/dl), and LF (400 ± 97 mg/dl) groups. in all diet regimens compared to the CON group (p < 0.05)
Meanwhile, the peak blood glucose value during the GTT for the (Figure 6). The lower splenic T cell frequencies were due to
PF group (361 ± 122 mg/dl) was only significantly lower than reductions in the frequencies of both major subsets of T cells
that of the HF group. (CD4+ and CD8+) (Figure 6A). Interestingly, the reduction in
For the IAGT administered 9 weeks into the dietary regimen splenic CD4 + T cell frequency was less in the LF, ADF, and PF
(Figures 4D,E), the AUC value of the HF mice was significantly groups than in HF mice (p < 0.05) (Figure 6A). Splenic CD8 + T
greater than all other groups. As with the GTT AUC, there were cells were also less dramatically reduced in the LF mice compared
no differences among the other four groups. It is important to to the HF group (p < 0.05) (Figure 6A). There were no significant
note that despite the rapid rise in blood glucose in HF mice reductions in blood CD4+ and CD8+ T cell frequencies in the
during the IAGT, circulating blood glucose steadily decreased, as LF group compared to the HF group (Figure 6B); however, both
opposed to the GTT. The LF response was significantly greater CD4+ and CD8+ T cell frequencies were reduced in ADF and PF
than that of the CON mice (Figure 4E). mice (p < 0.05) (Figure 6B). Likewise, there were no significant
reductions in mesenteric lymph node CD4+ and CD8+ T cell
frequencies in the LF group compared to CON (Figure 6C).
Mesenteric lymph node CD8+ T cell frequencies in the ADF
and PF groups were reduced compared to CON (p < 0.05)
(Figure 6C) but CD4+ T cell frequencies were not significantly
different (Figure 6C).
Plasma Measures
Plasma corticosterone, plasma IL6, and plasma triglycerides were
not significantly different among all of the groups (Table 1).
DISCUSSION
FIGURE 3 | Cumulative kcal intake over 10 weeks. Mice in the HF group In the current experiment, we wanted to examine whether the
consumed significantly more kcals than all other diet regimens, with no improvement in select health markers seen in high-fat diet-
differences among any of the other groups. a: p < 0.05 vs. CON; b: p < 0.05
induced obese mice from ADF (Joslin et al., 2017) was due to the
vs. HF.
CR effect of ADF or due to the fasting nature of the ADF regimen.
Frontiers in Physiology | www.frontiersin.org 5 February 2021 | Volume 12 | Article 641532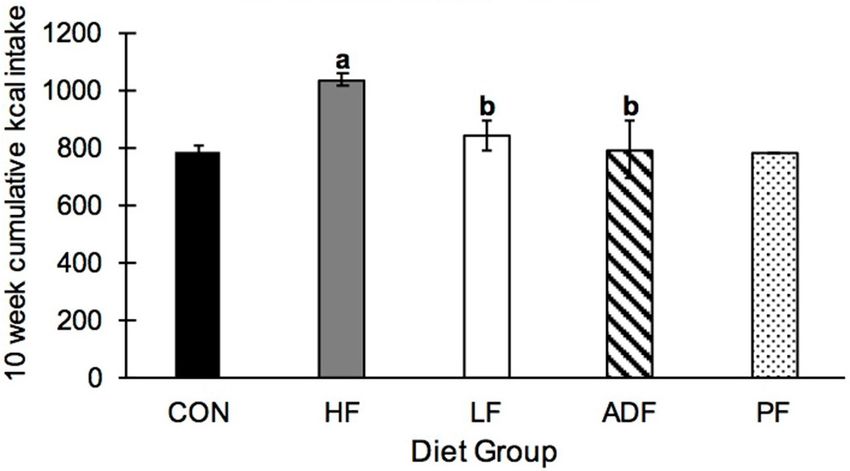
Henderson et al. ADF vs. CR in Mice
FIGURE 4 | Continued
conducted after a 6 h fast, which began at the onset of the light phase. ADF
mice were tested after a fed day. Samples were collected 20, 40, 60, 90, and
120 min after intraperitoneal injection of glucose. (C) Glucose tolerance test
area under the curve (AUC). The “area under the curve” calculation was
measured using the lowest blood glucose concentration from the GTT as a
baseline. All mice were significantly more glucose tolerant than HF mice.
(D) Insulin assisted glucose tolerance test. An IAGT was conducted after a 6 h
fast, which began at the onset of the light phase. ADF mice were tested after
a fed day. Mice were 23 weeks of age and 9 weeks into their experimental
diets at the time of the IAGT. Mice were given intraperitoneal injections of a
cocktail of 1 g glucose/kg body weight with 0.75 U/kg body weight in
0.1–0.2 cc of sterile saline. (E) Insulin assisted glucose tolerance test area
under the curve (AUC). HF mice had a significantly larger AUC than all other
diet regimens, once again suggesting that they are more glucose intolerant
than the other diet regimens. a: p < 0.05 vs. CON; b: p < 0.05 vs. HF.
We first confirmed that ADF in this model leads to lower caloric
intake (Figure 3). Indeed, the ADF protocol resulted in ∼20%
reduction in food intake, a little less than what we have measured
previously at ∼30% (Joslin et al., 2017), but approximately what
others have found (Caro et al., 2008; Gabel et al., 2019). By
definition, the PF group received the same amount of high-fat
food as the ADF group. We note that this level of caloric intake
for the ADF group (and PF group) was not different from either
group on the ad libitum chow diets (CON and LF: Figure 3), as
has been seen previously (Gotthardt et al., 2016). That is, all of the
dietary manipulations here resulted in similar caloric intake. We
found significant improvement among all of those mice that ate
fewer calories than the HF ad libitum group, but few differences
among the diet groups themselves. For mice, it appears that the
most important variable for improved health markers measured
here from an obese state is the reduction of calorie intake, and not
the length of fasting time. In other words, reducing caloric intake
through either changing the composition of the diet (i.e., the LF
group), eating every other day (ADF group), or eating less every
day (PF group), results in similar health outcomes. Each of these
outcomes is outlined below, starting with BW.
Body weight dropped precipitously in all of the dieting groups,
particularly during the first 1–2 weeks of the feeding paradigm,
but did not reach the BW of CON mice. For the experimental
diets, BW did not continue to decrease after the initial 2 weeks,
suggesting that there may be a limit to the BW loss induced by
diet alone in these feeding regimens. Others (Baumeier et al.,
2015; Gotthardt et al., 2016; Joslin et al., 2017; Kusuoka et al.,
2018) have shown that some version of ADF, CR, or returning
to a LF diet causes weight loss in a diet-induced obese rodent
model. We extend those findings here by directly comparing
these dieting groups. We found that each of the diets is equally
efficacious for BW control in previously obese mice.
Associated with the BW loss was an improvement in
FIGURE 4 | Blood glucose and glucose tolerance tests. (A) Fasting blood
glucoregulatory control, which is important as a health marker
glucose. Blood glucose was measured after a 6 h fast, which started at the due to the association of obesity with glucose dysregulation. We
onset of the light phase. Blood glucose of ADF mice was measured after a fed examined four related markers associated with glucose regulation
day. Mice in the HF group had significantly higher fasting blood glucose than including fasting blood glucose, peak blood glucose, response to
all other diet regimens (p < 0.05). ADF mice had significantly lower blood
a GTT, and response to an IAGT. Fasting blood glucose of HF
glucose compared to CON mice (B) Glucose tolerance test. A GTT was
(Continued
mice was high (200 ± 25 mg/dL) suggesting that the high-fat
diet-induced obese mice had blood glucose dysregulation. All
Frontiers in Physiology | www.frontiersin.org 6 February 2021 | Volume 12 | Article 641532Henderson et al. ADF vs. CR in Mice
FIGURE 5 | Epididymal fat and hepatic triglycerides. (A) Average mass of
both epididymal fat pads relative to body weight. CON mice had significantly
smaller epididymal fat pads relative to BW compared to all other groups. In
addition, the relative size of epididymal fat pads in the LF group were
significantly smaller than those from HF and PF mice. (B) Liver triglyceride
concentrations. HF liver triglyceride concentrations were triple that seen in
CON mice. All diet regimens reduced this measure, with moving to a LF diet
as the most effective. a: p < 0.05 vs. CON; b: p < 0.05 vs. HF; c: p < 0.05
vs. LF.
diet groups showed a decreased fasting blood glucose relative FIGURE 6 | Single cell suspensions from the spleen, blood, and mesenteric
lymph nodes were stained with anti-CD3, anti-CD4, and anti-CD8 monoclonal
to HF mice, as seen previously, with the ADF group exhibiting antibodies and analyzed by flow cytometry. The lymphocyte population was
lower blood glucose despite the measurement taken after a fed gated based on FSC vs SSC profiles then CD3 + cells gated and used as the
day (Anson et al., 2003; Gotthardt et al., 2016; Yang et al., 2016; parent population for CD4 + and CD8 + T cell identification. Graphs show
Liu et al., 2018). The improved glucose control seen in ADF mean and SD of the percentage of CD4 + and CD8 + T cells of lymphocytes.
(A) Frequency of T cells in the spleen. All diet regimens had a lower
mice compared to ad libitum controls is well known in rodents
percentage of splenic CD4 + and CD8 + T cells compared to the CON group.
and humans (Joslin et al., 2017; Dedual et al., 2019; Swoap The LF group had a significantly higher percentage of CD4 + and CD8 + T
et al., 2019). We found that all of the diet manipulations lead to cells compared to the HF group. (B) Frequency of T cells in the blood. HF,
improved GTT responses relative to the HF group, confirming ADF, and PF groups had reduced frequencies of CD4+ and CD8+ T cells in
those findings. We extend those findings to show that there the blood, while the LF group showed no significant reduction. (C) Frequency
of T cells in the mesenteric lymph node. HF, ADF, and PF groups had reduced
were no differences among the different dieting regimens, and in
frequencies of T cells in the mesenteric lymph nodes while the LF group
particular, the ADF group vs. the PF group (Figures 4B,C). showed no significant reductions in T cell frequency. a: p < 0.05 vs. CON; b:
Another measure that can be associated with obesity is hepatic p < 0.05 vs. HF; c: p < 0.05 vs. LF for each respective lymphocyte
triglyceride content. We also observed a reduction in this health population.
marker in the groups consuming fewer calories. Hepatic fat
content is a critical contributor to non-alcoholic fatty liver disease
(NAFLD) and studies have shown that ADF can be an effective fat pad mass on both an absolute level (see results) and on a
diet therapy for NAFLD in both obese humans (Cai et al., 2019; body mass-specific level (Figure 5A) than the HF group, an
Johari et al., 2019) and animals (Yang et al., 2016; Rusli et al., observation not seen in either the ADF or PF groups. That
2017). In our study, any form of CR significantly decreased is, epididymal fat pad mass was not dependent on BW. This
hepatic triglycerides compared to HF mice (Figure 5B). suggests that the feeding regimen is the key factor in determining
Switching to a chow diet from a high-fat diet (LF group) epididymal fat pad mass, not BW or caloric intake (Figure 5A).
proved to be more effective than the CR associated with ADF While we measured epididymal fat mass, and not whole-body fat
and PF for two measures: epididymal fat pad mass and T cell mass, others have done so in mice and show significant decreases
frequency. Mice in the LF group showed significantly smaller in body fat mass in mice undergoing the ADF protocol for both
Frontiers in Physiology | www.frontiersin.org 7 February 2021 | Volume 12 | Article 641532Henderson et al. ADF vs. CR in Mice
TABLE 1 | Experimental values of plasma corticosterone, IL6, and triglycerides. rate and blood pressure, and lower LDL, among others (Varady
et al., 2013; Stekovic et al., 2019). This warrants further research
Group Plasma corticosterone Plasma IL6 Plasma triglyceride
(ng/mL) (pg/mL) (mg/dL) into how the health benefits of ADF may compare to CR in a non-
obese model.
CON 49 ± 12 33 ± 10 42 ± 9 To sum, the results of this study suggest that for BW and
HF 128 ± 40 31 ± 5 50 ± 11 glucoregulatory action, the primary factor for improvement seen
LF 52 ± 14 29 ± 8 57 ± 11 in obese mice exposed to ADF appeared to be the reduction
ADF 61 ± 14 31 ± 9 63 ± 3 of calories, and not the fasting inherent to the ADF model or
PF 92 ± 25 26 ± 4 41 ± 4 to the type of calories consumed (low-fat or high-fat). Hepatic
triglyceride content demonstrated a beneficial effect for the ADF
low-fat and high-fat food (Gotthardt et al., 2016; Smith et al., vs. the PF group, however, the interpretation of this finding is
2019). We used the epididymal fat pad as an easily dissected and limited by sample size. For T cell frequency, the high-fat diet
self-contained tissue as one indicator of fat storage in the mouse. seems to play a more important role, although some changes
Finally, our results on T cell frequencies also suggest that the type were seen with decreased caloric intake, particularly in the blood
of food consumed might be critical for immune cell homeostasis. and mesenteric lymph nodes. Although the sample size in the
Previous research has shown that chronic CR leads to a reduction current study was not large, the changes in these markers relative
in circulating monocytes (CD14+ and CD16+) in both mice and to the HF group were robust. Importantly, we found that all of the
humans (Jordan et al., 2019), with enhanced T cell accumulation dieting groups displayed improvement in most of the measured
in the bone marrow (Collins et al., 2019). We observed that T markers over the 10-week feeding paradigm. Understanding the
cell frequencies were reduced in the spleen, blood, and mesenteric differing physiological effects of ADF versus continuous CR on a
lymph nodes in all three HF groups (HF, ADF, and PF) (Figure 6). high-fat diet can help us in evaluating the efficacy of common
In all three tissues, the LF group showed smaller reductions in T dieting regimens as treatments for diseases such as obesity,
cell frequencies (if any). These results suggest that diet regimens NAFLD, and diabetes.
with high fat content might have a deleterious effect on T cell
expansion, survival, or homeostasis. An alternate explanation for
reduced T cell frequencies, however, might be the expansion of B DATA AVAILABILITY STATEMENT
cells, the other major lymphocyte population. It will be important
to determine whether HF diet regimens reduce T cell numbers or The raw data supporting the conclusions of this article will be
increase B cell numbers in lymphoid organs and in circulation. made available by the authors, without undue reservation.
It is important to note that all measurements were made after
a fed day for the ADF group. We have previously shown that
there are differences in BW and glucoregulatory control after ETHICS STATEMENT
a fed versus a fasted day for obese mice on HF ADF (Joslin
et al., 2017). Because measurements are known to be different The animal study was reviewed and approved by the Williams
between the fed day versus the fasted day, we wanted to test College Animal Use Committee.
for changes after a day of food overconsumption, when a mouse
might be metabolically worse than after the fasted day. We did
not specifically note when mice in the ADF group ate or when
AUTHOR CONTRIBUTIONS
the PF mice finished consuming their food. The specific timing CH and SS designed the research. CH, DT, and SS conducted the
of eating in these groups may be of interest for future studies. research and analyzed the data. CH wrote the manuscript. DT
The sample size in the current study was small (n = 5 and SS edited the manuscript. SS had primary responsibility for
per group), and we only studied male mice. It remains to be final content. All authors read and approved the final manuscript.
determined whether a similar phenotype will be found in female
mice. Further, while the chow diet and HF diet used here is
well defined for macronutrients (calories from carbohydrate, FUNDING
fat, and protein), the chow diet used is not well-defined for
its micronutrient availability. Of note, the CON mice used in The work was supported by internal grants from Williams
this study were derived from mice that were ordered from College to SS and DT.
Jackson labs 4 months prior to the start of the study. These
mice were bred twice without backcrossing at Williams College;
therefore, we would not expect any drastic genetic changes ACKNOWLEDGMENTS
between this group of mice and the 13-week-old obese mice
ordered from Jackson labs. The authors thank Dr. Noah Sandstrom for assistance in
In addition to treating obesity, ADF is also commonly used statistical analyses, Audrey Werner for her lab assistance, and our
to improve health in non-obese conditions. In non-obese adults, research assistants, Yang Lee, Simone Veale, Sonia Nyarko, Chris
ADF has been found to decrease fat mass, improve the fat-to-lean Ochoa, Molly Craig, Omar Kawam, Fiona Keller, and Marya Rana
ratio, improve cardiovascular parameters such as decreased heart for their assistance in animal care.
Frontiers in Physiology | www.frontiersin.org 8 February 2021 | Volume 12 | Article 641532Henderson et al. ADF vs. CR in Mice
REFERENCES with moderate asthma. Free Radic. Biol. Med. 42, 665–674. doi: 10.1016/j.
freeradbiomed.2006.12.005
Anson, R. M., Guo, Z. H., de Cabo, R., Iyun, T., Rios, M., Hagepanos, A., et al. Jordan, S., Tung, N., Casanova-Acebes, M., Chang, C., Cantoni, C., Zhang, D., et al.
(2003). Intermittent fasting dissociates beneficial effects of dietary restriction (2019). Dietary intake regulates the circulating inflammatory monocyte pool.
on glucose metabolism and neuronal resistance to injury from calorie intake. Cell 178, 1102–1114.e17.
Proc. Natl. Acad. Sci. U.S.A. 100, 6216–6220. doi: 10.1073/pnas.1035720100 Joslin, P. M. N., Bell, R. K., and Swoap, S. J. (2017). Obese mice on a
Appiakannan, H. S., Kestyus, D. R., and Weber, E. T. (2019). Effects of high fat diet high-fat alternate-day fasting regimen lose weight and improve glucose
and chronic circadian challenge on glucocorticoid regulation in C57BL/6J mice. tolerance. J. Anim. Physiol. Anim. Nutr. 101, 1036–1045. doi: 10.1111/jpn.1
Physiol. Behav. 204, 100–105. doi: 10.1016/j.physbeh.2019.01.014 2546
Baumeier, C., Kaiser, D., Heeren, J., Scheja, L., John, C., Weise, C., et al. (2015). Karlsson, E. A., Sheridan, P. A., and Beck, M. A. (2010). Diet-induced obesity
Caloric restriction and intermittent fasting alter hepatic lipid droplet proteome impairs the T cell memory response to influenza virus infection. J. Immunol.
and diacylglycerol species and prevent diabetes in NZO mice. Biochim. Biophys. 184, 3127–3133. doi: 10.4049/jimmunol.0903220
Acta 1851, 566–576. doi: 10.1016/j.bbalip.2015.01.013 Kusuoka, O., Fujiwara-Tani, R., Nakashima, C., Fujii, K., Ohmori, H., Mori, T.,
Bhutani, S., Klempel, M. C., Kroeger, C. M., Trepanowski, J. F., and Varady, et al. (2018). Intermittent calorie restriction enhances epithelial-mesenchymal
K. A. (2013). Alternate day fasting and endurance exercise combine to reduce transition through the alteration of energy metabolism in a mouse tumor
body weight and favorably alter plasma lipids in obese humans. Obesity 21, model. Int. J. Oncol. 52, 413–423.
1370–1379. doi: 10.1002/oby.20353 Liu, B., Page, A. J., Hatzinikolas, G., Chen, M., Wittert, G. A., and Heilbronn, L. K.
Cai, H., Qin, Y.-L., Shi, Z.-Y., Chen, J.-H., Zeng, M.-J., Zhou, W., et al. (2019). (2018). Intermittent fasting improves glucose tolerance and promotes adipose
Effects of alternate-day fasting on body weight and dyslipidaemia in patients tissue remodeling in male mice fed a high-fat diet. Endocrinology 160, 169–180.
with non-alcoholic fatty liver disease: a randomised controlled trial. BMC doi: 10.1210/en.2018-00701
Gastroenterol. 19:219. doi: 10.1186/s12876-019-1132-8 Mahoney, L. B., Denny, C. A., and Seyfried, T. N. (2006). Caloric restriction in
Caro, P., Gómez, J., López-Torres, M., Sánchez, I., Naudi, A., Portero-Otín, M., C57BL/6J mice mimics therapeutic fasting in humans. Lipids Health Dis. 5:13.
et al. (2008). Effect of every other day feeding on mitochondrial free radical Parvaresh, A., Razavi, R., Abbasi, B., Yaghoobloo, K., Hassanzadeh, A.,
production and oxidative stress in mouse liver. Rejuvenation Res. 11, 621–629. Mohammadifard, N., et al. (2019). Modified alternate-day fasting vs. calorie
doi: 10.1089/rej.2008.0704 restriction in the treatment of patients with metabolic syndrome: a randomized
Catenacci, V. A., Pan, Z., Ostendorf, D., Brannon, S., Gozansky, W. S., Mattson, clinical trial. Complement. Ther. Med. 47:102187. doi: 10.1016/j.ctim.2019.
M. P., et al. (2016). A randomized pilot study comparing zero-calorie alternate- 08.021
day fasting to daily caloric restriction in adults with obesity. Obesity 24, Reynolds, T. H., Cinquino, N., Anthony, M., Phelps, C. B., and Zachary Berk,
1874–1883. doi: 10.1002/oby.21581 E. (2009). Insulin resistance without elevated mammalian target of rapamycin
Collins, N., Han, S. J., Enamorado, M., Link, V. M., Huang, B., Moseman, E. A., complex 1 activity in muscles of mice fed a high-fat diet. J. Appl. Physiol. 107,
et al. (2019). The bone marrow protects and optimizes immunological memory 1479–1485. doi: 10.1152/japplphysiol.00574.2009
during dietary restriction. Cell 178, 1088–1101.e15. Rusli, F., Lute, C., Boekschoten, M. V., van Dijk, M., van Norren, K., Menke, A. L.,
Dedual, M. A., Wueest, S., Borsigova, M., and Konrad, D. (2019). Intermittent et al. (2017). Intermittent calorie restriction largely counteracts the adverse
fasting improves metabolic flexibility in short-term high-fat diet-fed mice. Am. health effects of a moderate-fat diet in aging C57BL/6J mice. Mol. Nutr. Food
J. Physiol. Endocrinol. Metab. 317, E773–E782. Res. 61:1600677. doi: 10.1002/mnfr.201600677
Descamps, O., Riondel, J., Ducros, V., and Roussel, A.-M. (2005). Mitochondrial Schindler, C. E., Partap, U., Patchen, B. K., and Swoap, S. J. (2014). Chronic
production of reactive oxygen species and incidence of age-associated rapamycin treatment causes diabetes in male mice. Am. J. Physiol. Regul. Integr.
lymphoma in OF1 mice: effect of alternate-day fasting. Mech. Ageing Dev. 126, Comp. Physiol. 307, R434–R443.
1185–1191. doi: 10.1016/j.mad.2005.06.007 Senn, J. J., Klover, P. J., Nowak, I. A., and Mooney, R. A. (2002). Interleukin-
Emerson, S. R., Kurti, S. P., Harms, C. A., Haub, M. D., Melgarejo, T., Logan, C., 6 induces cellular insulin resistance in hepatocytes. Diabetes 51, 3391–3399.
et al. (2017). Magnitude and timing of the postprandial inflammatory response doi: 10.2337/diabetes.51.12.3391
to a high-fat meal in healthy adults: a systematic review. Adv. Nutr. 8, 213–225. Smith, A. G., Sheridan, P. A., Harp, J. B., and Beck, M. A. (2007). Diet-induced
doi: 10.3945/an.116.014431 obese mice have increased mortality and altered immune responses when
Gabel, K., Kroeger, C. M., Trepanowski, J. F., Hoddy, K. K., Cienfuegos, S., Kalam, infected with influenza virus. J Nutr. 137, 1236–1243. doi: 10.1093/jn/137.5.
F., et al. (2019). Differential effects of alternate-day fasting versus daily calorie 1236
restriction on insulin resistance. Obesity (Silver Spring) 27, 1443–1450. Smith, N. J., Caldwell, J. L., van der Merwe, M., Sharma, S., Butawan, M., Puppa,
Gotthardt, J. D., Verpeut, J. L., Yeomans, B. L., Yang, J. A., Yasrebi, A., Roepke, M., et al. (2019). A comparison of dietary and caloric restriction models on
T. A., et al. (2016). Intermittent fasting promotes fat loss with lean mass body composition, physical performance, and metabolic health in young mice.
retention, increased hypothalamic norepinephrine content, and increased Nutrients 11:350. doi: 10.3390/nu11020350
neuropeptide y gene expression in diet-induced obese male mice. Endocrinology Speakman, J. R., and Mitchell, S. E. (2011). Caloric restriction. Mol. Aspects Med.
157, 679–691. doi: 10.1210/en.2015-1622 32, 159–221.
Halberg, N., Henriksen, M., Söderhamn, N., Stallknecht, B., Ploug, T., Schjerling, Spindler, S. R. (2010). Caloric restriction: from soup to nuts. Ageing Res. Rev. 9,
P., et al. (2005). Effect of intermittent fasting and refeeding on insulin action in 324–353. doi: 10.1016/j.arr.2009.10.003
healthy men. J. Appl. Physiol. 99, 2128–2136. doi: 10.1152/japplphysiol.00683. Stekovic, S., Hofer, S. J., Tripolt, N., Aon, M. A., Royer, P., Pein, L., et al. (2019).
2005 Alternate day fasting improves physiological and molecular markers of aging in
Hatting, M., Rines, A. K., Luo, C., Tabata, M., Sharabi, K., Hall, J. A., et al. healthy, non-obese humans. Cell Metab. 30, 462–476.e6.
(2017). Adipose tissue CLK2 promotes energy expenditure during high-fat diet Swoap, S. J., Bingaman, M. J., Hult, E. M., and Sandstrom, N. J. (2019). Alternate-
intermittent fasting. Cell Metab. 25, 428–437. doi: 10.1016/j.cmet.2016.12.007 day feeding leads to improved glucose regulation on fasting days without
Heilbronn, L. K., Civitarese, A. E., Bogacka, I., Smith, S. R., Hulver, M., and significant weight loss in genetically obese mice. Am. J. Physiol. Regul. Integr.
Ravussin, E. (2005). Glucose tolerance and skeletal muscle gene expression in Comp. Physiol. 317, R461–R469.
response to alternate day fasting. Obes. Res. 13, 574–581. doi: 10.1038/oby. Trepanowski, J. F., Kroeger, C. M., Barnosky, A., Klempel, M. C., Bhutani, S.,
2005.61 Hoddy, K. K., et al. (2017). Effect of alternate-day fasting on weight loss, weight
Johari, M. I., Yusoff, K., Haron, J., Nadarajan, C., Ibrahim, K. N., Wong, M. S., maintenance, and cardioprotection among metabolically healthy obese adults:
et al. (2019). A randomised controlled trial on the effectiveness and adherence of a randomized clinical trial. JAMA Intern. Med. 177, 930–938. doi: 10.1001/
modified alternate-day calorie restriction in improving activity of non-alcoholic jamainternmed.2017.0936
fatty liver disease. Sci. Rep. 9:11232. Varady, K. A., Allister, C. A., Roohk, D. J., and Hellerstein, M. K. (2010).
Johnson, J. B., Summer, W., Cutler, R. G., Martin, B., Hyun, D. H., Dixit, V. D., Improvements in body fat distribution and circulating adiponectin by alternate-
et al. (2007). Alternate day calorie restriction improves clinical findings and day fasting versus calorie restriction. J. Nutr. Biochem. 21, 188–195. doi: 10.
reduces markers of oxidative stress and inflammation in overweight adults 1016/j.jnutbio.2008.11.001
Frontiers in Physiology | www.frontiersin.org 9 February 2021 | Volume 12 | Article 641532Henderson et al. ADF vs. CR in Mice Varady, K. A., and Hellerstein, M. K. (2007). Alternate-day fasting and chronic Xie, K., Neff, F., Markert, A., Rozman, J., Aguilar-Pimentel, J. A., Amarie, O. V., disease prevention: a review of human and animal trials. Am. J. Clin. Nutr. 86, et al. (2017). Every-other-day feeding extends lifespan but fails to delay many 7–13. doi: 10.1093/ajcn/86.1.7 symptoms of aging in mice. Nat. Commun. 8:155. Varady, K. A., Bhutani, S., Klempel, M. C., and Kroeger, C. M. (2011). Comparison Yang, W., Cao, M., Mao, X., Wei, X., Li, X., Chen, G., et al. (2016). Alternate-day of effects of diet versus exercise weight loss regimens on LDL and HDL particle fasting protects the livers of mice against high-fat diet-induced inflammation size in obese adults. Lipids Health Dis. 10:119. doi: 10.1186/1476-511x-10-119 associated with the suppression of Toll-like receptor 4/nuclear factor kappaB Varady, K. A., Bhutani, S., Klempel, M. C., Kroeger, C. M., Trepanowski, J. F., Haus, signaling. Nutr. Res. 36, 586–593. doi: 10.1016/j.nutres.2016.02.001 J. M., et al. (2013). Alternate day fasting for weight loss in normal weight and overweight subjects: a randomized controlled trial. Nutr. J. 12:146. Conflict of Interest: The authors declare that the research was conducted in the Varady, K. A., Dam, V. T., Klempel, M. C., Horne, M., Cruz, R., Kroeger, C. M., absence of any commercial or financial relationships that could be construed as a et al. (2015). Effects of weight loss via high fat vs. low fat alternate day fasting potential conflict of interest. diets on free fatty acid profiles. Sci Rep. 5:7561. Varady, K. A., Roohk, D. J., Bruss, M., and Hellerstein, M. K. (2009). Alternate- Copyright © 2021 Henderson, Turner and Swoap. This is an open-access article day fasting reduces global cell proliferation rates independently of dietary fat distributed under the terms of the Creative Commons Attribution License (CC BY). content in mice. Nutrition 25, 486–491. doi: 10.1016/j.nut.2008.10.017 The use, distribution or reproduction in other forums is permitted, provided the Vozarova, B., Weyer, C., Hanson, K., Tataranni, P. A., Bogardus, C., and Pratley, original author(s) and the copyright owner(s) are credited and that the original R. E. (2001). Circulating interleukin-6 in relation to adiposity, insulin action, publication in this journal is cited, in accordance with accepted academic practice. No and insulin secretion. Obes. Res. 9, 414–417. doi: 10.1038/oby.2001.54 use, distribution or reproduction is permitted which does not comply with these terms. Frontiers in Physiology | www.frontiersin.org 10 February 2021 | Volume 12 | Article 641532
You can also read